
0 ITEMS

How to Create a Startup Financial Forecast in 5 Steps

A startup financial forecast is a structured projection of your revenue, costs, and cash position over a defined period—typically 3 to 5 years—built on explicit, testable assumptions rather than guesswork.
Key Takeaways
- A complete startup financial forecast requires 3 core statements: a profit and loss (P&L), a cash flow statement, and a balance sheet—each serving a different audience.
- Bottom-up revenue modeling, which builds projections from individual customer or unit assumptions, is 40% more credible to early-stage investors than top-down market-share estimates, according to experienced venture partners.
- SaaS businesses typically target gross margins of 70–80%, while ecommerce runs 30–50% and hardware often sits below 40%—your forecast must reflect your industry benchmark.
- Founders who model 3 scenarios (base, best, worst) close funding rounds faster because they demonstrate they understand risk, not just opportunity.
- Monthly cash flow detail for Year 1 is non-negotiable for seed and Series A investors; quarterly detail suffices for Years 2 through 5.
- The average early-stage startup burns between $50,000 and $150,000 per month according to the Kauffman Foundation, making runway calculation the single most critical output of any forecast.
- eFinancialModels offers a free startup financial model template with built-in scenario modeling and investor-ready formatting.
Why Financial Forecasts Matter for Startups
A financial forecast is not a prediction—it is a structured argument about how your business will grow, what it will cost, and when it will generate cash. Investors use it to stress-test your logic, not to hold you to exact numbers.
According to the National Venture Capital Association, more than 70% of venture investors rank financial projections as a critical screening criterion in early-stage due diligence.
A weak or internally inconsistent forecast signals poor business judgment, not just poor math. Conversely, a well-constructed forecast demonstrates that you understand your unit economics (the revenue and cost tied to a single customer or transaction), your market dynamics, and your capital efficiency.
For internal planning, the forecast becomes your operating budget, your hiring roadmap, and your fundraising trigger. When actual results diverge from projections—and they always do—the variance (the gap between projected and actual) tells you exactly where your assumptions were wrong and what to fix.
What Goes Into a Startup Financial Forecast: The Three Essential Statements
Every complete startup financial forecast contains three interconnected financial statements. Each statement answers a different question for a different stakeholder.
Profit and Loss Statement (P&L): Also called an income statement, the P&L shows revenue minus expenses over a period to arrive at net profit or net loss. Investors use it to evaluate gross margin (revenue minus direct costs, expressed as a percentage) and the path to profitability. A SaaS business with 75% gross margins and a clear path to operating leverage reads very differently from a hardware startup running at 35%.
Cash Flow Statement: The cash flow statement tracks actual cash moving in and out of the business, separated into operating, investing, and financing activities. This is the statement that determines your runway—how many months of cash you have before you need more funding. Many profitable-looking startups have failed because they ran out of cash before revenue caught up with expenses.
Balance Sheet: The balance sheet shows assets (what you own), liabilities (what you owe), and equity (the residual value belonging to shareholders) at a specific point in time. Lenders and later-stage investors scrutinize it to assess solvency and capital structure.
All three statements must be mathematically linked: net income from the P&L flows into retained earnings on the balance sheet, and changes in working capital (short-term assets and liabilities) flow into the operating section of the cash flow statement.

Net income from the P&L flows into retained earnings on the balance sheet, and working capital changes flow into the cash flow statement.
Step 1: Build Your Revenue Model and Assumptions
Revenue modeling is the foundation of your entire forecast, and it is where most founders either win or lose investor credibility. Start with your revenue model type, then build assumptions from the bottom up.
Top-Down vs. Bottom-Up Revenue Modeling
Top-down modeling starts with a total addressable market (TAM) figure and assumes you capture a percentage of it. For example: “The US project management software market is $6 billion; we’ll capture 1% in Year 3, generating $60 million.” This approach is weak because it provides no mechanism—it doesn’t explain how you get from zero to 1%.
Bottom-up modeling starts with your actual sales process. For a SaaS business, that means: How many leads can your sales team contact per month? What is your conversion rate from lead to trial to paid? What is your average contract value (ACV)? What is your monthly churn rate (the percentage of customers who cancel each month)?
Worked Example: SaaS Bottom-Up Revenue Model
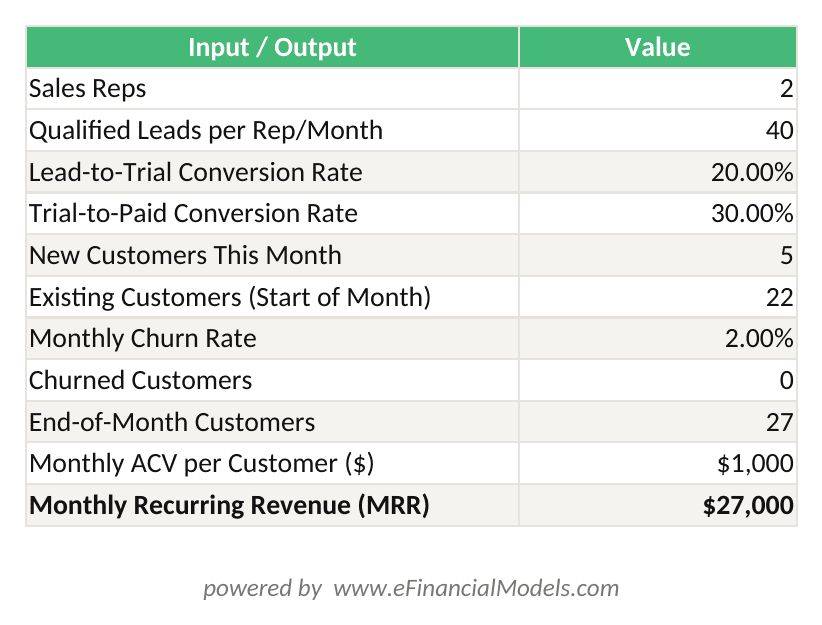
Here are the inputs and the math for a B2B SaaS startup in Month 6:
- Sales reps: 2
- Qualified leads per rep per month: 40
- Lead-to-trial conversion: 20%
- Trial-to-paid conversion: 30%
- Monthly new customers: 2 reps × 40 leads × 20% × 30% = 4.8 new customers per month (round to 5)
- Average contract value (ACV): $12,000 per year = $1,000 per month
- Existing customer base at start of Month 6: 22 customers
- Monthly churn rate: 2%
- Churned customers: 22 × 2% = 0.44 (round to 0)
- End-of-month customers: 22 + 5 – 0 = 27 customers
- Monthly Recurring Revenue (MRR): 27 × $1,000 = $27,000
Repeat this logic for each month of Year 1, then roll it forward quarterly for Years 2 through 5 with updated assumptions for team size and conversion rates.
MRR = (Sales Reps × Leads/Rep × Lead-to-Trial % × Trial-to-Paid %) × ACV/12 + Prior Month Customers × (1 – Churn Rate) × ACV/12
For marketplace businesses, model gross merchandise volume (GMV) first, then apply your take rate (the percentage fee you charge on each transaction) to derive net revenue. For product businesses, model units sold by channel, then apply average selling price and returns rate.
Step 2: Map Your Complete Cost Structure
Cost modeling is where founders most consistently underestimate reality. Build your costs in four categories: Cost of Goods Sold (COGS), Sales and Marketing, Research and Development (R&D), and General and Administrative (G&A).
COGS (also called cost of revenue) are the direct costs to deliver your product or service. For SaaS, this includes hosting, third-party software licenses, and customer support salaries. For physical products, it includes manufacturing, materials, and fulfillment.
Expenses founders most often miss or underestimate:
- Customer Acquisition Cost (CAC): The total sales and marketing spend divided by the number of new customers acquired. A healthy SaaS business targets a CAC payback period of 12 months or less.
- Founder salaries: Many founders model zero salary in Year 1. Investors know this is unsustainable and will ask when you plan to pay yourself. Model a below-market salary from Month 1.
- Payment processing fees: Stripe and similar processors charge approximately 2.9% plus $0.30 per transaction. On $500,000 in annual revenue, that is roughly $14,500 in fees—not trivial.
- Compliance and legal: Entity formation, contracts, privacy policy compliance (GDPR, CCPA), and employment law can cost $15,000 to $40,000 in Year 1 for a US-based startup.
- Insurance: Directors and officers (D&O) insurance, general liability, and cyber liability are increasingly required by investors and enterprise customers.
According to the U.S. Small Business Administration, underestimating startup costs is one of the top 3 reasons small businesses fail in their first two years.
Build a 15% contingency buffer into your G&A line for expenses you haven’t anticipated yet.

Payment processing fees alone can cost $14,500+ annually on $500,000 in revenue—a line item many founders omit entirely.
Step 3: Project Monthly Cash Flow and Calculate Runway
Cash flow projection is the most operationally critical output of your forecast. Runway (the number of months until you run out of cash) is the number every investor will calculate within 30 seconds of seeing your model.
Here is the runway formula:
Runway (months) = Current Cash Balance / Average Monthly Net Burn
Net burn is your total cash out minus total cash in during a given month. If you have $600,000 in the bank and your average monthly net burn is $75,000, your runway is 8 months.
For Year 1, build your cash flow statement month by month. Key line items to include:
- Cash receipts from customers (note: this may lag revenue if you invoice on net-30 or net-60 terms)
- Payroll and contractor payments
- Rent and utilities
- Software subscriptions
- Marketing spend
- Capital expenditures (equipment, hardware)
- Loan repayments or investor capital inflows
Most pre-seed and seed-stage startups should target a minimum of 18 months of runway after each funding round according to Y Combinator’s standard guidance. This gives you 12 months to hit milestones and 6 months to run a fundraising process before cash runs out.
For financial projections that include proper cash flow modeling, your model should flag the month when cash drops below a 3-month buffer—this is your fundraising trigger date.

Runway = Current Cash / Monthly Net Burn. A 3-month buffer threshold triggers the fundraising process before cash runs out.
Step 4: Create Scenario Models
Scenario modeling means building three versions of your forecast using different assumption sets. This is not a sign of uncertainty—it is a sign of analytical rigor.
- Base case: Your most likely outcome based on current conversion rates, hiring plans, and market conditions. This is your operating budget.
- Best case: Assumes 20–30% better performance on key drivers (higher conversion, lower churn, faster hiring). Use this to show upside potential.
- Worst case: Assumes 20–30% worse performance on key drivers. Use this to show that the business survives adversity and that you’ve stress-tested your model.
Present all three scenarios to investors in a single summary table. Never present only the best case—experienced investors will immediately ask for downside scenarios, and not having them prepared signals naivety.
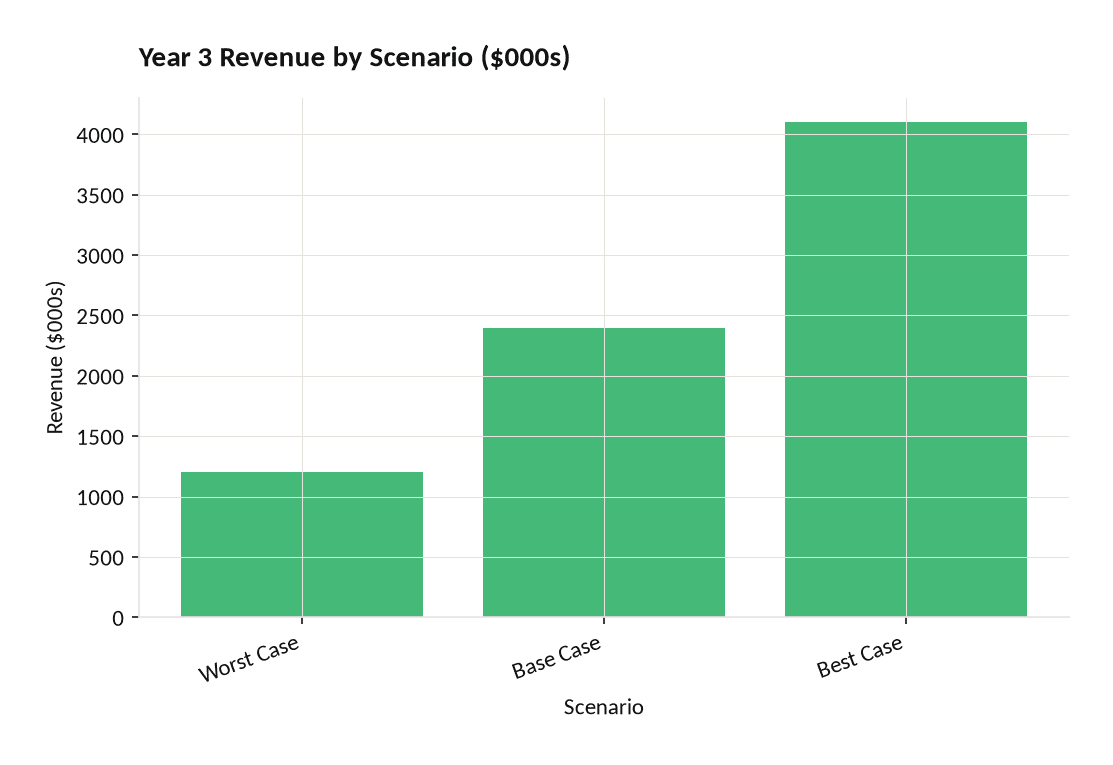
A 10-percentage-point difference in monthly growth rate produces a 3.4x spread in Year 3 revenue—illustrating why scenario modeling matters.
The key variable to stress-test first is your revenue growth rate. A 10-percentage-point change in monthly growth rate compounds dramatically over 36 months. Run your model with growth rates of 5%, 10%, and 15% per month and show investors the cash implications of each.
For 5-year financial projections with built-in scenario toggles, eFinancialModels provides templates where you change one input cell and all three scenarios update automatically.
Choosing the Right Tools and Templates
The right tool depends on your stage, technical comfort, and how you’ll share the model.
| Tool | Best For | Cost | Collaboration | Investor-Ready |
|---|---|---|---|---|
| Excel | Series A+ | $10/mo | Limited | Yes |
| Google Sheets | Pre-seed/Seed | Free | Strong | Yes |
| Specialized SaaS | All stages | $50–200/mo | Strong | Varies |
| EFM Templates | All stages | Free–$99 | Sheets/Excel | Yes |
Excel remains the industry standard for investor-grade financial models because it supports up to 1,048,576 rows of data (Microsoft) and handles complex formula structures that Google Sheets sometimes struggles with at scale. Additionally, a single Excel workbook can contain up to 255 sheets (Microsoft), which means you can house your P&L, cash flow statement, balance sheet, and all three scenario models within a single file without hitting structural limits. However, Google Sheets is perfectly adequate for pre-seed and seed-stage models and makes real-time collaboration with co-founders and advisors much easier.
Specialized tools like Runway or Mosaic are useful once you have live accounting data to sync, typically post-Series A. Before that stage, they add cost without proportional benefit.
For most first-time founders, the fastest path is a structured startup financial model template from eFinancialModels. These templates include pre-built formula logic, scenario toggles, and investor-ready summary dashboards—reducing build time from weeks to hours. Excel formulas can nest up to 64 levels deep (Microsoft), giving financial modelers the flexibility to build sophisticated interdependent logic across all three financial statements without restructuring their workbooks.
Common Forecasting Mistakes That Undermine Credibility
Investors see hundreds of forecasts per year. These are the 5 mistakes that trigger immediate skepticism.
1. Hockey-stick projections without a mechanism. Revenue that is flat for 12 months then suddenly grows 300% in Month 13 requires a specific explanation: a product launch, a partnership, a sales team expansion. If you can’t name the mechanism, cut the hockey stick.
2. Ignoring cash flow entirely. Showing only a P&L is a red flag. Investors know that profitable-looking startups die from cash flow problems. Always include a monthly cash flow statement.
3. Gross margins that don’t match industry benchmarks. Projecting 80% gross margins for a hardware business or 30% for a SaaS business signals that you don’t understand your cost structure. Research your industry’s standard margins before building your model.
4. No sensitivity analysis. A model with a single set of assumptions is not a model—it’s a spreadsheet. Show what happens to your runway if CAC doubles or conversion rates drop by half.
5. Expenses that don’t scale with revenue. If your revenue grows 10x but your headcount stays flat, investors will question whether you’ve modeled the operational reality. Hiring plans, infrastructure costs, and support costs must scale proportionally.
For KPI tracking and variance analysis, eFinancialModels offers templates that compare actuals to projections automatically, flagging the metrics that need attention each month.
How to Present Your Forecast to Investors
Your forecast presentation should tell a story, not just display numbers. Lead with your key assumptions, not your outputs.
Structure your investor presentation of the forecast in this order:
- Revenue model summary: One slide showing your revenue model type, key drivers, and Year 1 through Year 3 revenue in base case.
- Unit economics: CAC, LTV (lifetime value of a customer), LTV:CAC ratio (healthy SaaS targets 3:1 or higher), and payback period.
- Burn and runway: Current monthly burn, current cash balance, and runway in months.
- Use of funds: How the capital you’re raising maps to specific milestones (e.g., “$1.5M funds 18 months of runway and gets us to 100 paying customers”).
- Scenario summary: A single table showing Year 3 revenue, EBITDA (earnings before interest, taxes, depreciation, and amortization—a proxy for operating profitability), and cash position across base, best, and worst cases.
Never apologize for uncertainty. Every investor knows your Year 3 numbers will be wrong. What they’re evaluating is whether your thinking is rigorous and whether you understand the levers that drive your business.
Maintaining and Updating Your Forecast
A financial forecast is a living document, not a one-time deliverable. Update it monthly once you have 3 or more months of actual operating data.
The update process has three steps:
- Enter actuals: Replace projected figures with actual revenue, expenses, and cash for the completed month.
- Calculate variance: For each line item, compute the difference between actual and projected, both in absolute dollars and as a percentage.
- Update forward assumptions: If your actual CAC is 40% higher than projected, update your forward CAC assumption and recalculate runway. Don’t leave stale assumptions in place.
Monthly variance analysis (comparing actual results to your forecast) is also the primary deliverable in investor update emails. Investors who receive clear, honest variance analysis with explanations build significantly more trust than those who receive vague qualitative updates.
For forecasting templates that include built-in variance tracking, eFinancialModels provides models where you enter actuals in a dedicated column and the variance populates automatically.
Monthly variance analysis—comparing actuals to projections—is the primary deliverable in investor update emails.
Frequently Asked Questions
How long does it take to build a startup financial forecast from scratch?
Building a complete startup financial forecast from scratch typically takes a first-time founder 20 to 40 hours without a template, and 4 to 8 hours with a well-structured template. The time is dominated by defining and documenting your revenue model assumptions, not by the spreadsheet mechanics. The most time-consuming part is usually the first revenue model iteration—once you have your unit economics defined (CAC, LTV, churn rate, ACV), the rest of the model builds relatively quickly. Using a pre-built template from eFinancialModels can compress the process to a single working day for most pre-seed and seed-stage businesses.
How far out should a startup financial forecast go?
The standard forecast horizon depends on your funding stage. Pre-seed founders typically present 3-year forecasts with monthly detail for Year 1 and quarterly detail for Years 2 and 3. Seed-stage founders should extend to 3 to 5 years, still with monthly Year 1 detail. Series A investors expect 5-year models with monthly detail for at least the first 2 years. The reason for monthly detail in early years is that cash flow timing matters enormously when you’re burning $50,000 to $150,000 per month—a quarterly view can hide a cash crisis that a monthly view would reveal immediately.
What gross margin should I project for my startup?
Your projected gross margin must reflect your business model and industry. SaaS businesses typically achieve 70% to 80% gross margins at scale because their primary costs are hosting and support, which don’t scale linearly with revenue. Ecommerce businesses typically run 30% to 50% gross margins depending on product category and fulfillment model. Marketplace businesses often show 60% to 70% gross margins on net revenue (after paying out to sellers). Hardware businesses frequently operate below 40% gross margin due to manufacturing and component costs. Projecting margins significantly above your industry benchmark without a specific structural reason will immediately raise red flags with experienced investors.
What is a healthy LTV to CAC ratio for a startup?
A healthy LTV:CAC ratio for a SaaS or subscription business is 3:1 or higher—meaning the lifetime value of a customer is at least 3 times what it costs to acquire them. LTV (lifetime value) is calculated as: Average Revenue Per User (ARPU) divided by your monthly churn rate. For example, if your ARPU is $1,000 per month and your monthly churn is 2%, your LTV is $1,000 / 0.02 = $50,000. If your CAC is $15,000, your LTV:CAC ratio is 3.3:1, which is at the lower end of acceptable. Ratios below 2:1 signal that your business model may not be economically viable at scale, and investors will probe this aggressively.
Should I include founder salaries in my financial forecast?
Yes, always include founder salaries in your financial forecast, even if you plan to defer payment initially. Investors know that founders working for free is not a sustainable operating model, and a forecast that excludes founder compensation understates your true cost structure. A common approach is to model a below-market salary (for example, $60,000 to $80,000 per year for a US-based technical founder) from Month 1, with a note that founders are deferring a portion until after the funding round closes. This approach is honest, shows financial discipline, and avoids the awkward conversation when an investor asks why your burn rate will suddenly jump after you hire yourself.
How do I handle negative cash flow periods in my forecast?
Negative cash flow periods are expected and normal for early-stage startups—they are the reason you’re raising money. In your forecast, model negative cash flow explicitly by month, show the cumulative cash position, and identify the month when cash would reach zero without additional funding. This is your fundraising trigger date. Present this clearly to investors: “Based on our current burn of $85,000 per month and $510,000 in the bank, we have 6 months of runway. We are raising $1.5M now, which extends our runway to 24 months and funds us to our Series A milestone of $500,000 in ARR.” Investors respect founders who understand their cash position precisely.
What’s the difference between a financial forecast and a financial model?
A financial forecast is the output—the projected P&L, cash flow statement, and balance sheet for a specific time period. A financial model is the tool that generates the forecast: the spreadsheet or software that contains your assumptions, formulas, and scenario logic. In practice, founders and investors use the terms interchangeably, but the distinction matters when you’re building: the model is what you maintain and update, while the forecast is what you present. A good financial model from eFinancialModels includes both the assumption inputs and the formatted output statements, so you can update one cell and have the entire forecast recalculate automatically.
Conclusion
Building a credible startup financial forecast comes down to four things: defensible revenue assumptions built from the bottom up, a complete and honest cost structure, monthly cash flow detail that shows your runway, and scenario modeling that demonstrates you’ve stress-tested your logic. The math is secondary to the thinking—investors fund founders who understand their business, not founders who can build impressive-looking spreadsheets.
I recommend downloading the eFinancialModels startup financial model template to build your projections in hours instead of weeks. It includes pre-built P&L, cash flow, and balance sheet statements, a scenario toggle for base, best, and worst cases, and an investor-ready summary dashboard—everything you need to walk into your next pitch with confidence.
























































