
0 ITEMS

Chile Copper & Lithium: 5.72 Mt and 416 kt by 2031

Chile enters the 2026–2031 window as the only country on Earth that pairs world-scale copper reserves with the largest lithium brine resource — but the investment story for each metal runs on a completely different clock.
Key Takeaways
- Chile produced roughly 5.3 million tonnes of copper in 2025, about 25% of global supply, yet national output is forecast to oscillate in a narrow 5.4–6.0 Mt band through 2031 — making price, not volume, the dominant equity driver.
- The LME copper price hit an all-time high near US$14,527 per tonne in January 2026; the base-case deck holds US$12,500–14,000 through 2031, with a bear-case correction to US$10,000 as the key downside stress.
- The Codelco–SQM joint venture NovaAndino Litio SpA, sealed 27 December 2025, locks Salar de Atacama lithium production to 2060 and shifts the state’s margin capture from roughly 70% (2025–2030) to up to 85% from 2031 — a hard economic discontinuity every modeller must build in explicitly.
- Battery-grade lithium carbonate collapsed from a 2022 peak near US$80,000 per tonne to a US$9,000–15,000 trough in 2024–2025, then spiked toward US$20,000–28,000 in early 2026; the base-case envelope for 2031 is US$18,000–28,000.
- Three scenarios for 2031: Base Case (55% probability) projects 5.72 Mt copper and 416 kt LCE lithium; Bear Case (25%) projects 5.25 Mt and 330 kt; Bull Case (20%) projects 6.25 Mt and 520 kt.
- Water scarcity is the single most critical structural risk: desalinated seawater is projected to supply roughly two-thirds of Chilean mining water by 2034 at an all-in cost near US$4.45 per cubic meter, a rising and explicit operating-cost line.
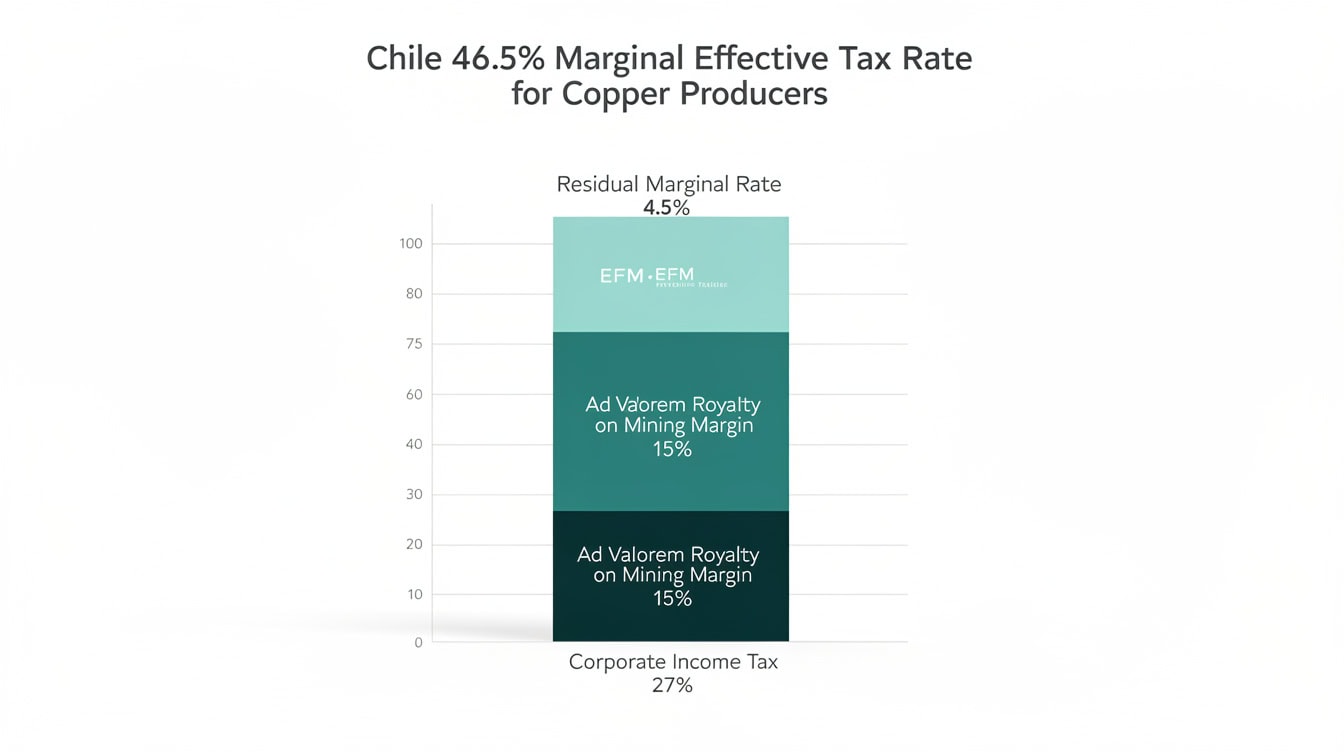
- The 2024 Mining Royalty Law (Ley 21.591) caps the maximum effective tax burden on large copper producers at 46.5% — a binding constraint that modellers must apply at the margin, not as a footnote.
Chile’s Structural Position in Copper and Lithium
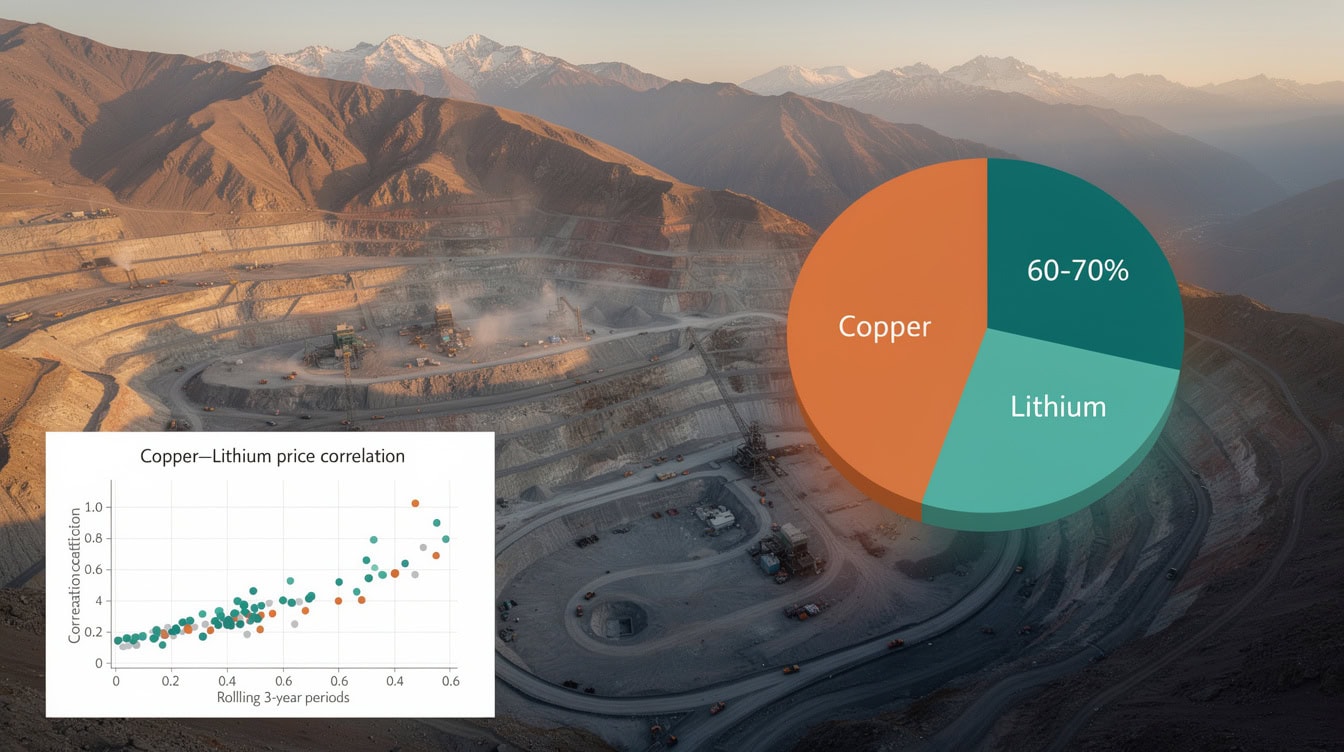
Chile is structurally irreplaceable in both metals, but its competitive edge is shifting from cost leadership toward reserve and resource leadership. The country holds about 190 million tonnes of copper reserves according to the USGS Mineral Commodity Summaries (2025), roughly a quarter of the world total, and simultaneously holds the planet’s largest economically extractable lithium reserves, also about a quarter of the global figure. No other jurisdiction pairs this scale across both metals.
For a financial modeller, Chile is therefore not one market but two distinct cash-flow regimes. The copper sector is mature, grade-constrained, and capital-intensive. The lithium sector is younger, state-reorganised, and price-volatile. They share a single fiscal, regulatory, water, and political envelope — which is precisely why understanding the interaction between the two is essential before building any project-level model.
Copper Supply: Volume Stagnation, Price Leverage
Chilean copper output will not grow meaningfully through 2031. Cochilco (Comisión Chilena del Cobre), Chile’s official copper commission, projects a national output peak near 5.97 Mt in 2027 followed by a trough near 5.43 Mt in 2030, as new tonnes from sanctioned expansions roughly offset grade-driven declines at mature mines. The binding constraints are physical and institutional — falling ore grades, water availability, permitting timelines, and execution risk on Codelco’s US$40-billion-plus structural-project program — rather than a shortage of capital or reserves.
Codelco, the state producer, is the swing variable. Its four structural projects aim to restore production toward 1.7 Mt per year by 2030 from a base near 1.31 Mt in 2025. Codelco reported a C1 cash cost (direct site cash cost per pound of payable copper, net of by-product credits) of 208.6 US cents per pound in 2025, placing it in the second cost quartile globally as higher-grade deposits in Peru and the Democratic Republic of Congo claim the lowest-cost positions. The July 2025 El Teniente seismic collapse, which killed six workers and temporarily curtailed the division, illustrates the execution and safety risk that makes the recovery schedule credible but not assured.
Private-sector growth concentrates in a handful of sanctioned expansions. Antofagasta plc’s US$4.4-billion Centinela Second Concentrator targets first copper in 2027 and adds roughly 144,000 tonnes per year. Teck’s Quebrada Blanca is ramping toward steady-state above 300,000 tonnes and studying a Phase 3 that could double capacity. The elevated 2026 price regime has materially improved the economics of these decisions relative to the sub-US$9,000 environment in which several were first evaluated.

Copper Pipeline Summary
| Project | Operator | Capex | Added Capacity | First Output |
|---|---|---|---|---|
| Chuquicamata Underground | Codelco | ~US$6.2bn | ~140 kt/day ore by 2030 | Ramping |
| Rajo Inca (El Salvador) | Codelco | n.d. | Integrated plant | Started 2025 |
| El Teniente New Mine Level | Codelco | Part of US$40bn+ | Sustains division | Post-2025 (delayed) |
| Centinela Second Concentrator | Antofagasta plc | ~US$4.4bn | +~144 kt Cu/yr | 2027 |
| Quebrada Blanca ramp / Phase 3 | Teck | Under study | To >300 kt; P3 ~doubles | 2026–2031 |
| NuevaUnión | Teck / Newmont | n.d. | ~190 kt Cu + 315 koz Au | Pre-FID |
Source: eFinancialModels Research based on company project disclosures and Cochilco pipeline data (2025–2026). n.d. = not separately disclosed.
Lithium Supply: The NovaAndino Discontinuity
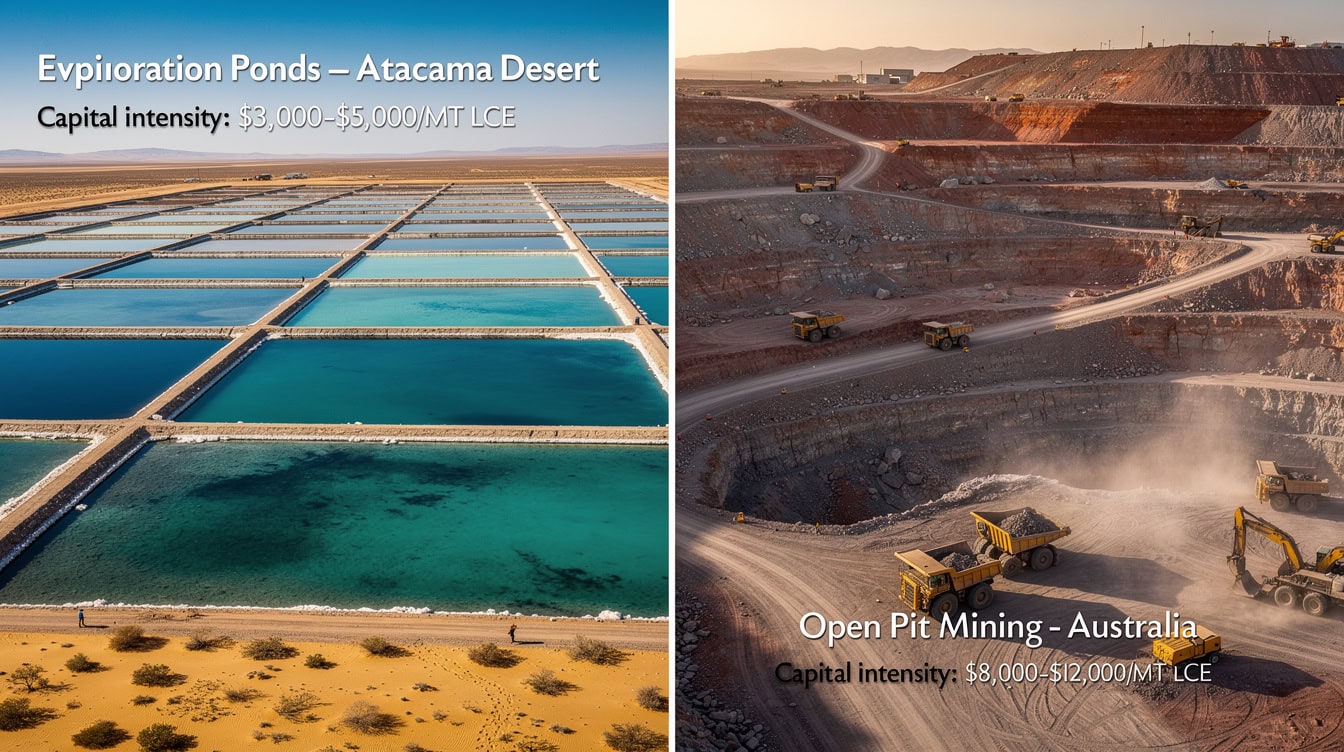
Chilean lithium supply through 2031 is incumbent-led and modest in growth. The Salar de Atacama — the highest-grade, lowest-cost brine resource on Earth — is the source of essentially all current Chilean output, operated by SQM and Albemarle under existing Corfo leases. Together they produced roughly 285,000–305,000 tonnes of lithium carbonate equivalent (LCE) in 2025. LCE is the standard unit for lithium markets: it measures the amount of lithium carbonate (Li₂CO₃) that a given quantity of lithium-bearing material would yield, using a conversion factor of approximately 5.323 tonnes LCE per tonne of contained lithium.
The transformational policy event is NovaAndino Litio SpA, the Codelco–SQM joint venture sealed on 27 December 2025 after Chilean antitrust clearance, Chinese SAMR approval, and conditions met before the Comptroller General. It secures Atacama exploitation to 2060. SQM operates to 2030 under roughly 50/50 economics; Codelco takes the majority from 2031, with the state capturing up to 85% of Atacama operating margin thereafter. This is not a gradual shift — it is a hard discontinuity that changes who captures the Atacama cost advantage rather than whether that advantage exists.
Pipeline salars add little volume before 2031. Codelco’s Maricunga project (with Rio Tinto at 49.99%) targets first production around 2030 at roughly 20,000 tonnes per year. ENAMI’s Salares Altoandinos (with Rio Tinto) targets 2032. The transformational Salar Futuro DLE project — budgeted near US$3 billion and targeting 280,000–300,000 tonnes per year — had its environmental study submitted in June 2026 but its final investment decision was still pending at that date. DLE, or Direct Lithium Extraction, recovers lithium from brine without large evaporation ponds, dramatically reducing land use and water consumption relative to conventional methods.
Demand Fundamentals: Two Different Clocks
Global demand underpins both metals, but on different timelines. For copper, refined demand of roughly 27 Mt in 2024 is projected to reach about 33 Mt by 2035 under the IEA’s stated-policies scenario (IEA Global Critical Minerals Outlook 2025), with power-grid investment and electrification accounting for more than 60% of that growth. The IEA warns of an approximately 30% copper supply shortfall by 2035 even on optimistic project assumptions. According to the USGS, Chile holds approximately 190 million metric tons of copper reserves (USGS), representing the single largest national share of identified global copper reserves. AI data centers are an emerging but fast-growing demand source: the IEA places data-center copper demand at 250,000–550,000 tonnes per year by 2030.
For lithium, demand of roughly 1.8 Mt LCE in 2025 is projected to roughly double to about 3.7 Mt by 2030, dominated by electric-vehicle batteries (close to 90% of demand) and grid-scale storage. The post-2022 surplus that crushed prices is expected to narrow and then invert: Cochilco projects demand near 3.8 Mt against supply near 2.46 Mt by 2035, placing the onset of a structural deficit firmly in the 2030–2031 window — precisely the inflection at which Chile’s state-majority Atacama economics take hold.
Global Demand and Supply Balance
| Metric | 2024 | 2030 | 2035 | Source |
|---|---|---|---|---|
| Global refined copper demand (Mt) | ~27 | ~30 | ~33 | IEA STEPS |
| Copper supply shortfall vs demand | Balance | Deficit | ~30% | IEA |
| Global lithium demand (Mt LCE) | ~1.8 | ~3.7 | ~4.5 | Albemarle / WEF |
| Lithium market balance | Surplus | Deficit onset | Deficit | Cochilco / BMI |
| Data-center copper demand (kt/yr) | Minor | 250–550 | Higher | IEA |
Source: IEA Global Critical Minerals Outlook 2025; Cochilco and BMI balance estimates.
Pricing and Cost Dynamics
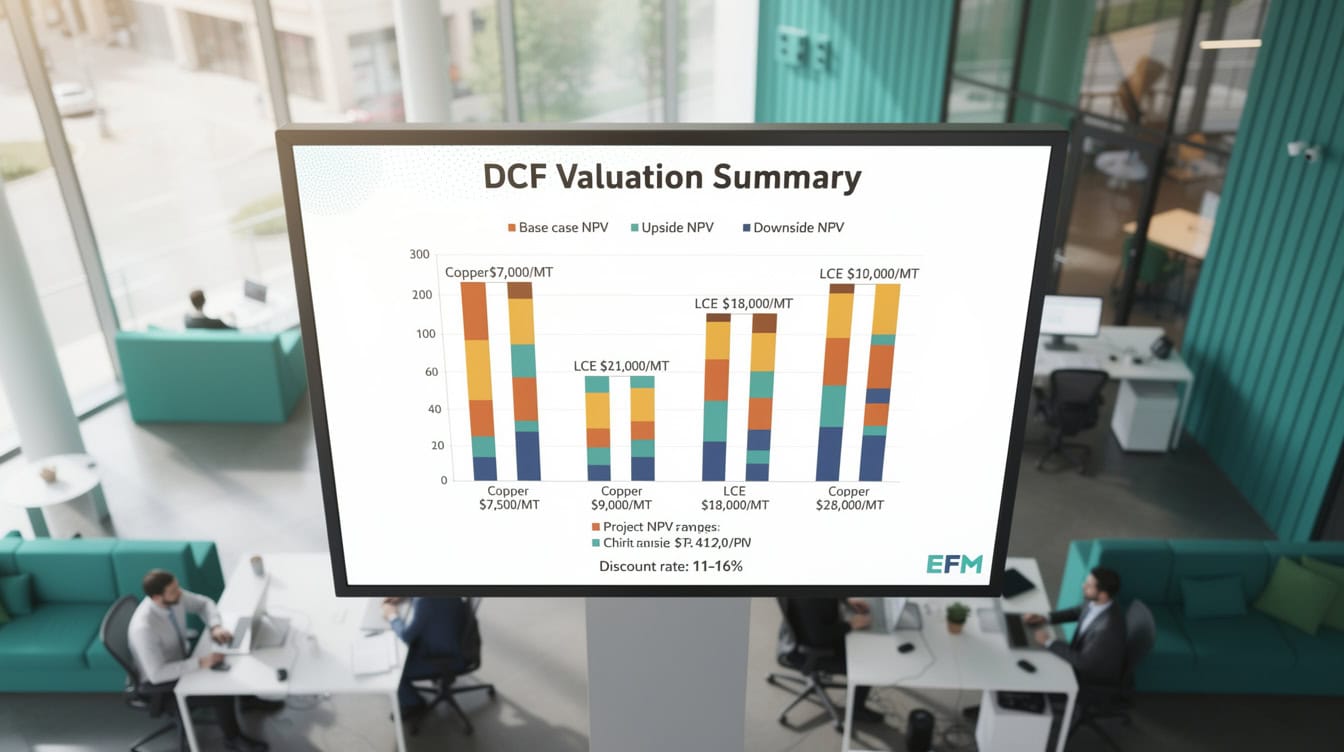
Copper pricing through 2031 is governed by a structural-deficit narrative interrupted by cyclical correction risk. The LME copper price set an all-time high near US$14,527 per tonne in January 2026 (Cochilco), trading in an elevated band thereafter. The base-case deck holds copper in a US$12,500–14,000 band through 2031, reflecting Goldman Sachs year-end 2026 and 2027 forecasts near US$13,700–13,800 and a long-run pull toward US$15,000 as demand overtakes supply. The bear case allows a correction toward US$10,000; the bull case sustains US$15,000-plus.
Lithium pricing is the more volatile and more consequential modeling input. Battery-grade carbonate fell from a 2022 peak near US$60,000–80,000 per tonne to a US$9,000–15,000 trough across 2024–2025, then spiked toward US$20,000–28,000 in spot markets during early 2026 on supply curtailment and resurgent battery demand. The base-case envelope for 2031 is US$18,000–28,000, with a bear case near US$13,000 and a bull case near US$45,000. Never use a single point estimate for lithium — the range is the model.
Worked Example: Copper Project IRR Sensitivity
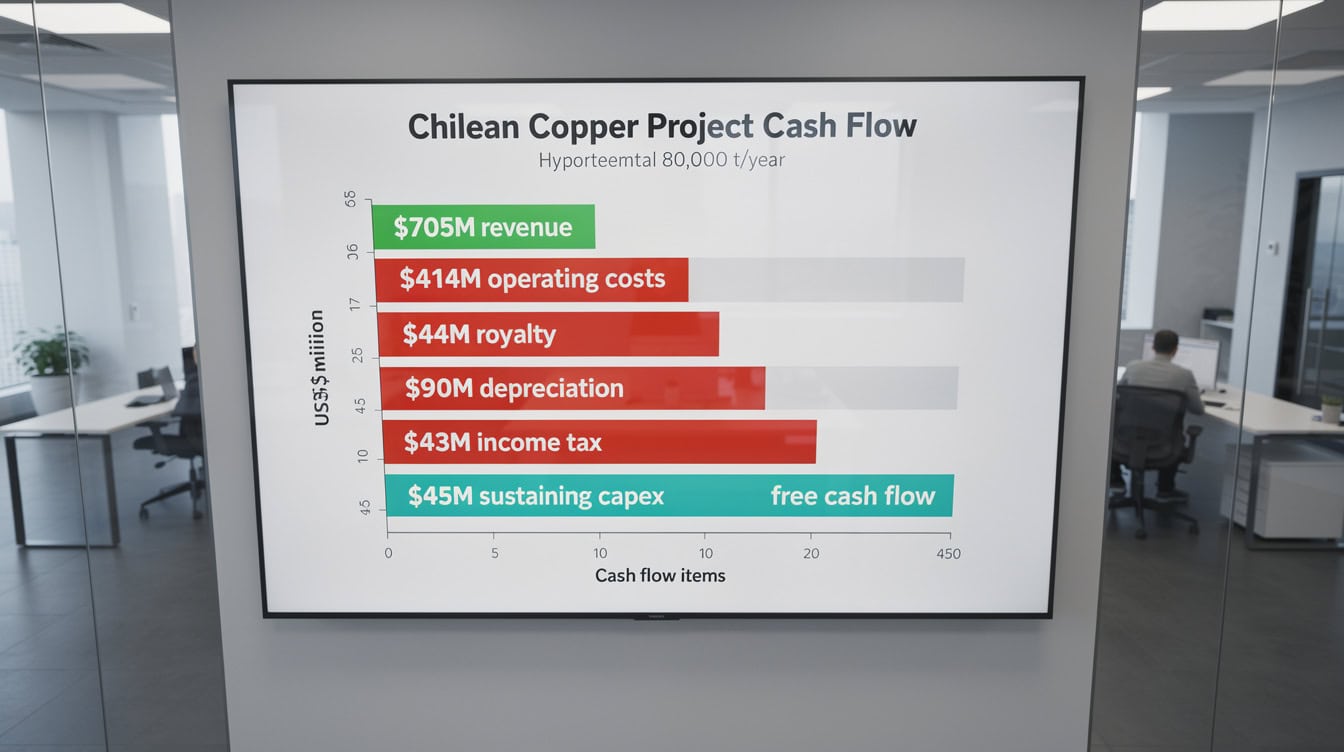
Here’s the math that shows why price dominates the Chilean copper investment case. Consider a hypothetical brownfield copper expansion with the following base-case inputs drawn from the study’s Appendix A assumptions:
- LME copper price: US$13,000 per tonne (base case midpoint)
- C1 cash cost: US$2.10 per pound = US$4,630 per tonne
- AISC (all-in sustaining cost, which adds sustaining capital expenditure and overhead to C1): US$2.85 per pound = US$6,283 per tonne
- Annual production: 100,000 tonnes copper
- Initial capex: US$1.5 billion
- Debt/equity: 70/30
- WACC (weighted average cost of capital, the blended required return on debt and equity): 9% real
- Royalty Law 21.591 effective tax burden: 46.5% cap applied
Step 1: Annual revenue = 100,000 t × US$13,000/t = US$1,300,000,000
Step 2: Annual operating cost at AISC = 100,000 t × US$6,283/t = US$628,300,000
Step 3: Pre-tax EBITDA = US$1,300M – US$628.3M = US$671.7M
Step 4: Apply 46.5% effective tax cap = US$671.7M × (1 – 0.465) = US$358.9M after-tax operating cash flow
Step 5: Equity portion of capex = US$1,500M × 0.30 = US$450M
Step 6: Simplified equity IRR (perpetuity approximation) = US$358.9M × 0.30 equity share / US$450M equity invested = US$107.7M / US$450M ≈ 23.9%
Now stress the price to the bear case of US$10,000 per tonne:
Revenue = US$1,000M; EBITDA = US$371.7M; After-tax = US$198.6M; Equity cash flow = US$59.6M; Equity IRR ≈ 13.2%
At US$9,000 per tonne, the equity IRR falls below the 10% lender hurdle rate, which is precisely why the study notes that a high-grade greenfield project clears a 10% equity hurdle only above roughly US$9,000 per tonne. The 2026 elevated price regime reopened expansion decisions that were marginal at sub-US$9,000 copper.
Three Scenarios to 2031
The Chile Mining Market Study 2026-2031 presents three probabilistic scenarios for Chilean output at the end of the forecast horizon.

| Metric | Bear (25%) | Base (55%) | Bull (20%) |
|---|---|---|---|
| Chile copper output 2031 (Mt) | 5.25 | 5.72 | 6.25 |
| Chile lithium output 2031 (kt LCE) | 330 | 416 | 520 |
| LME copper price (US$/t) | ~10,000 | 12,500–14,000 | ≥15,000 |
| Li carbonate price 2031 (US$/t) | ~13,000 | 18,000–28,000 | ~45,000 |
| Codelco 2030 output (Mt) | 1.45 | 1.60 | 1.70 |
Source: eFinancialModels Research. Illustrative only — not investment advice.
The Bear Case reflects slower Codelco recovery, water and permitting setbacks (illustrated by the May 2026 revocation of Collahuasi’s desalination permit), and DLE delays. The Bull Case assumes faster project delivery and an accelerated salar pipeline. The Base Case assumes Codelco’s structural projects deliver on a delayed but credible schedule and the NovaAndino transition proceeds without disruption.
Regulatory and Policy Context
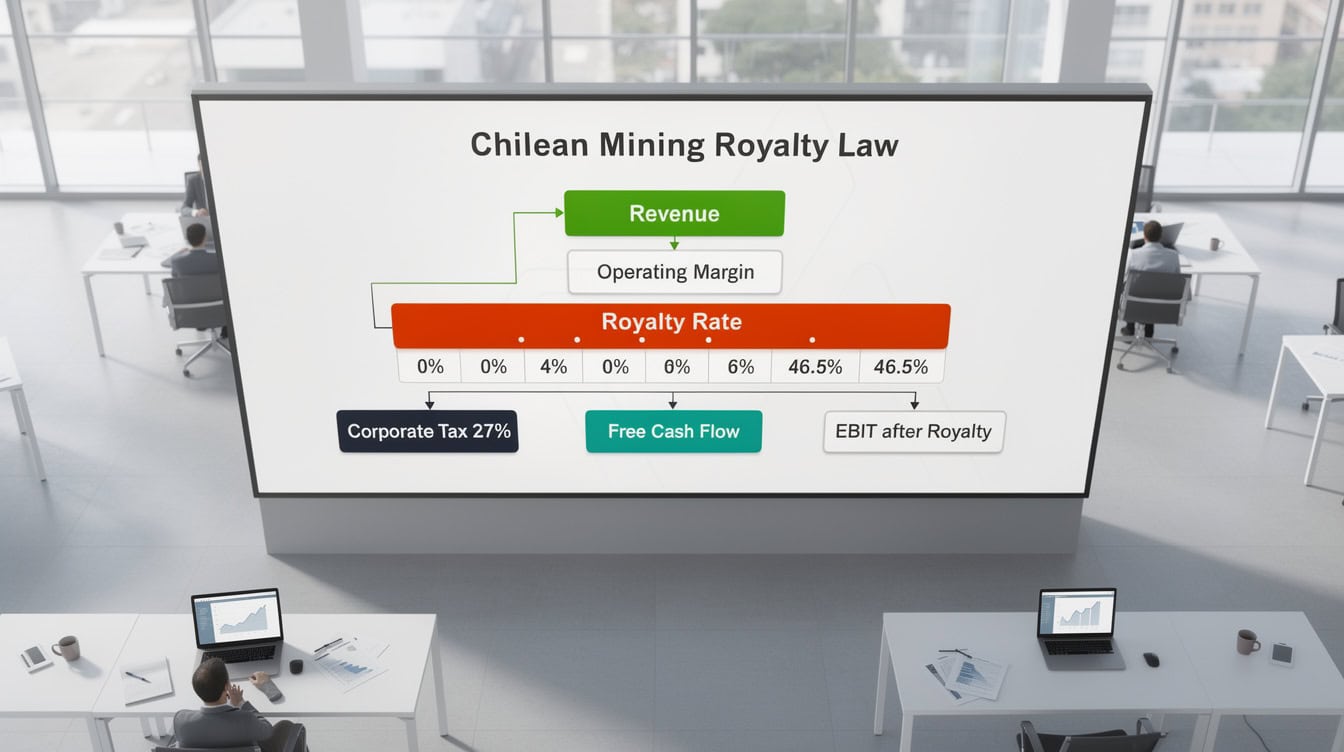
Chile’s policy environment shifted materially in 2025–2026. The 2024 Mining Royalty Law (Ley 21.591) introduced a 1% ad-valorem charge plus an 8–26% margin component, capped at a 46.5% maximum effective tax burden for large copper producers. MTFC, or metric tonnes of fine copper, is the threshold unit for this law. Modellers must apply this cap at the margin on every large-scale copper project — it is binding, not theoretical.
On permitting, Law 21.770 (published 29 September 2025) aims to cut permit-processing times by 30–70% through a single national digital platform and fixed decision timelines. President José Antonio Kast, who took office on 11 March 2026 and merged the Economy and Mining ministries, adopted a pro-investment posture while pledging to respect signed agreements such as NovaAndino. Chile and the United States signed critical-minerals and security agreements in March–April 2026, signalling a Western-alignment pivot in copper and lithium supply chains.
Indigenous consultation under ILO Convention 169 is increasingly decisive. The May 2026 revocation of Collahuasi’s desalination permit — driven in part by fractured community agreements — demonstrates that social license is a first-order NPV input, not a footnote. Modellers should treat a durable indigenous-community agreement as having the same materiality as the ore grade itself.
Common Modeling Mistakes and How to Fix Them
Five specific errors appear repeatedly in Chilean copper and lithium models.
Mistake 1: Treating Chilean copper as a volume-growth story. Chilean output oscillates in a 5.4–6.0 Mt band through 2031. Fix: anchor your revenue model on price sensitivity, not production growth. Run at least three price scenarios.
Mistake 2: Ignoring the 2031 lithium discontinuity. Many models extrapolate SQM/Albemarle economics past 2030 without adjusting for the NovaAndino state margin capture rising to 85%. Fix: build a hard break at 2031 in your Atacama lithium model and apply the new margin-split explicitly.
Mistake 3: Using a single lithium price point. The lithium carbonate price moved from US$80,000 to US$9,000 to US$28,000 in three years. Fix: use a wide envelope (US$13,000–45,000 by 2031) and model spot versus contract realisations separately.
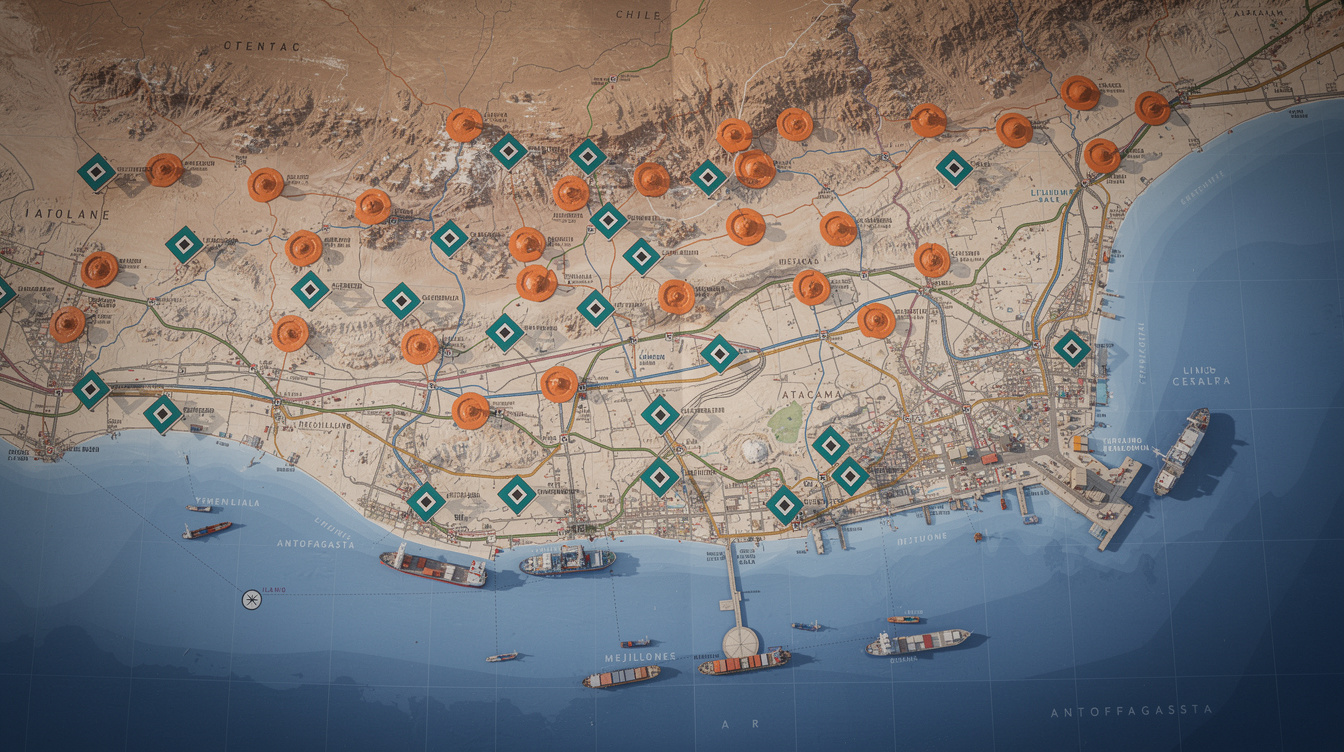
Mistake 4: Omitting the desalination cost premium. Water costs near US$4.45 per cubic meter for desalinated seawater are now a material and rising component of Chilean copper operating cost. Fix: add a water-cost line item scaled to each operation’s supply route; coastal operations with direct seawater access carry a different cost profile than inland operations.
Mistake 5: Applying the royalty as a simple pass-through. The 46.5% effective-burden cap under Ley 21.591 is a binding constraint at the margin for large producers. Fix: model the royalty as a cap on total effective tax burden, not as an additive line on top of corporate income tax.
Competitive Landscape and Operator Positioning
The Chilean competitive landscape divides cleanly by metal. In copper, Codelco and BHP-operated Escondida are the two anchors, followed by Antofagasta plc, Anglo American, Glencore, Teck, and Lundin. In lithium, the landscape is being reconstituted around state participation: the SQM–Codelco NovaAndino venture now governs Atacama, Albemarle operates alongside it, and Rio Tinto has become the preferred Western partner for the state’s pipeline salars.
Benchmark Mineral Intelligence projects Argentine lithium production growing roughly 340% to 2035 against Chile’s roughly 56% — a concrete illustration that resource quality does not guarantee output growth when the investment framework differs. Chile’s wager is that DLE, the NovaAndino structure, and the post-2031 structural deficit will let it capture more value per tonne even as it cedes volume-growth leadership to Argentina. According to the USGS Mineral Commodity Summaries 2025, world identified lithium resources total approximately 98 million tonnes (USGS), with Chile accounting for roughly 11 million tonnes of reserves — the largest single national reserve base on the planet. Albemarle has reported piloting DLE technology at the Salar de Atacama with lithium recovery rates above 94%, compared to roughly 40–50% recovery under conventional solar evaporation methods, underscoring the step-change efficiency that makes DLE central to Chile’s post-2031 volume strategy.
For diversified majors — BHP, Rio Tinto, Anglo American, Glencore, Teck, Lundin, and Albemarle — Chilean assets must be valued as a fraction of a broader portfolio. For Chile-centric operators — Codelco, Antofagasta plc, and SQM — the country risk and regulatory evolution are core to the equity story.
Readers building project-level financial models for the Mining Industry can find templates that translate the demand, price, cost, royalty, and scenario assumptions in this study into project cash flows. For broader market context, the EFM Market Studies library covers comparable critical-minerals markets across multiple geographies.
Frequently Asked Questions
Why does Chile’s copper output stagnate even as prices hit record highs?
Chile’s copper output stagnates because the binding constraints are physical and institutional, not financial. Ore grades at mature mines are falling, forcing more material to be moved per tonne of copper produced. Codelco’s four structural projects are mid-execution and subject to delays — the El Teniente seismic collapse in July 2025 is one example. Permitting timelines remain multi-year despite Law 21.770. The result is that new tonnes from sanctioned expansions roughly offset grade-driven declines at existing operations, keeping national output in a 5.4–6.0 Mt band through 2031. Record prices improve project economics and reopen expansion decisions, but they cannot accelerate the physical and regulatory timelines that govern when new capacity actually produces copper.
What is the NovaAndino discontinuity and why does it matter for lithium valuations?
NovaAndino Litio SpA is the Codelco–SQM joint venture sealed on 27 December 2025 that governs Salar de Atacama lithium production to 2060. Through 2030, SQM operates under roughly 50/50 economics with the state capturing about 70% of operating margin. From 2031, Codelco takes the majority and the state’s share rises to up to 85% of Atacama operating margin. This is a hard economic discontinuity: a model that extrapolates 2025–2030 Atacama economics past 2031 will materially overstate private-equity returns. Modellers must build a break at 2031, apply the new margin split explicitly, and treat the Salar Futuro DLE project and pipeline salars as post-2031 optionality rather than base-case volume.
How should I apply Chile’s Mining Royalty Law in a copper financial model?
Ley 21.591 (the 2024 Mining Royalty Law) imposes a 1% ad-valorem charge plus an 8–26% margin component on large copper producers, with a maximum effective tax burden capped at 46.5%. The cap is binding at the margin for large, profitable operations. In practice, you should calculate the total effective tax burden (corporate income tax plus royalty) and apply the 46.5% cap as a ceiling. Do not add the royalty as a simple additive line on top of corporate income tax without checking whether the combined burden exceeds the cap. For a project generating US$671.7M in pre-tax EBITDA, the after-tax cash flow at the 46.5% cap is US$358.9M — as shown in the worked example above.
What is DLE and why does it matter for Chilean lithium?
DLE, or Direct Lithium Extraction, is a technology that recovers lithium from brine without large evaporation ponds. Conventional Atacama brine processing uses solar evaporation ponds that take 12–18 months to concentrate lithium and consume significant land and water. DLE uses sorbent, solvent, or membrane-based processes to extract lithium directly from the brine in hours, with a much smaller physical footprint and the potential to return the depleted brine to the aquifer. Albemarle has piloted DLE at Atacama with recovery rates above 94%. The Salar Futuro project, budgeted near US$3 billion and targeting 280,000–300,000 tonnes LCE per year, is the flagship DLE application — but its final investment decision was still pending in mid-2026, making it a post-2031 production engine rather than a near-term volume source.
How does water scarcity affect the cost model for Chilean copper?
Water scarcity is the single most critical structural risk for Chilean copper operations. Freshwater availability in the Atacama and northern Chile is severely constrained, forcing a sector-wide shift to desalinated seawater. Desalination is projected to supply roughly two-thirds of Chilean mining water by 2034 at an all-in cost near US$4.45 per cubic meter, according to AX Legal water analysis cited in the study. This cost is now a material and rising component of Chilean copper operating cost. Coastal operations with direct seawater access carry a lower logistics cost than inland operations that must pump desalinated water uphill. Modellers should add a water-cost line item scaled to each operation’s supply route and elevation profile, and note that permitting for desalination plants carries its own risk — as the May 2026 revocation of Collahuasi’s desalination permit demonstrated.
What are the three scenario outputs for Chile at 2031?
The Base Case (55% probability) projects 5.72 Mt of copper and 416 kt LCE of lithium at a copper price of US$12,500–14,000 per tonne and a lithium carbonate price of US$18,000–28,000 per tonne. The Bear Case (25% probability) projects 5.25 Mt copper and 330 kt lithium at a copper price near US$10,000 and lithium near US$13,000. The Bull Case (20% probability) projects 6.25 Mt copper and 520 kt lithium at copper above US$15,000 and lithium near US$45,000. The Base Case assumes Codelco’s structural projects deliver on a delayed but credible schedule, Law 21.770 shaves permitting timelines, and the NovaAndino transition proceeds without disruption. The Bear Case reflects slower Codelco recovery, water and permitting setbacks, and DLE delays.
How does the Kast government’s pro-investment stance change the risk profile?
President José Antonio Kast took office on 11 March 2026, merged the Economy and Mining ministries under a single minister, and signalled a more investment-friendly, lower-permitting-friction posture. He pledged to make lithium more ‘concessionable’ while respecting signed agreements such as NovaAndino. The United States and Chile signed critical-minerals and security agreements in March–April 2026, reinforcing a Western-alignment pivot. For modellers, the Kast government is a moderate tailwind on permitting timelines and a potential upside on new salar concessions — but the state-centric lithium architecture is entrenched and signed agreements are being honoured rather than unwound. The political risk is therefore asymmetric: the upside from pro-investment policy is real but bounded; the downside from policy reversal is constrained by the durability of signed contracts.
Conclusion
Chile’s copper and lithium sectors offer two distinct investment propositions through 2031. Copper is a price-levered, grade-eroding, cost-rising story where equity returns depend overwhelmingly on where the LME price sits relative to a steepening cost curve and a 46.5% tax cap. Lithium is a state-reorganised, price-volatile story with a hard economic discontinuity at 2031 that compresses private-equity returns from Atacama even as the structural deficit arrives. Water strategy, permitting timelines, and indigenous social license are first-order NPV inputs for both metals.
I recommend downloading the Chile Mining Market Study 2026-2031 to access the full scenario analysis, pricing model assumptions, operator competitive landscape, and the quick-reference action checklist — everything you need to build a defensible project-level financial model for Chilean copper or Atacama lithium assets.























































