
0 ITEMS

Canada Mining 2026-2031: Gold at $5,000, Uranium Surges

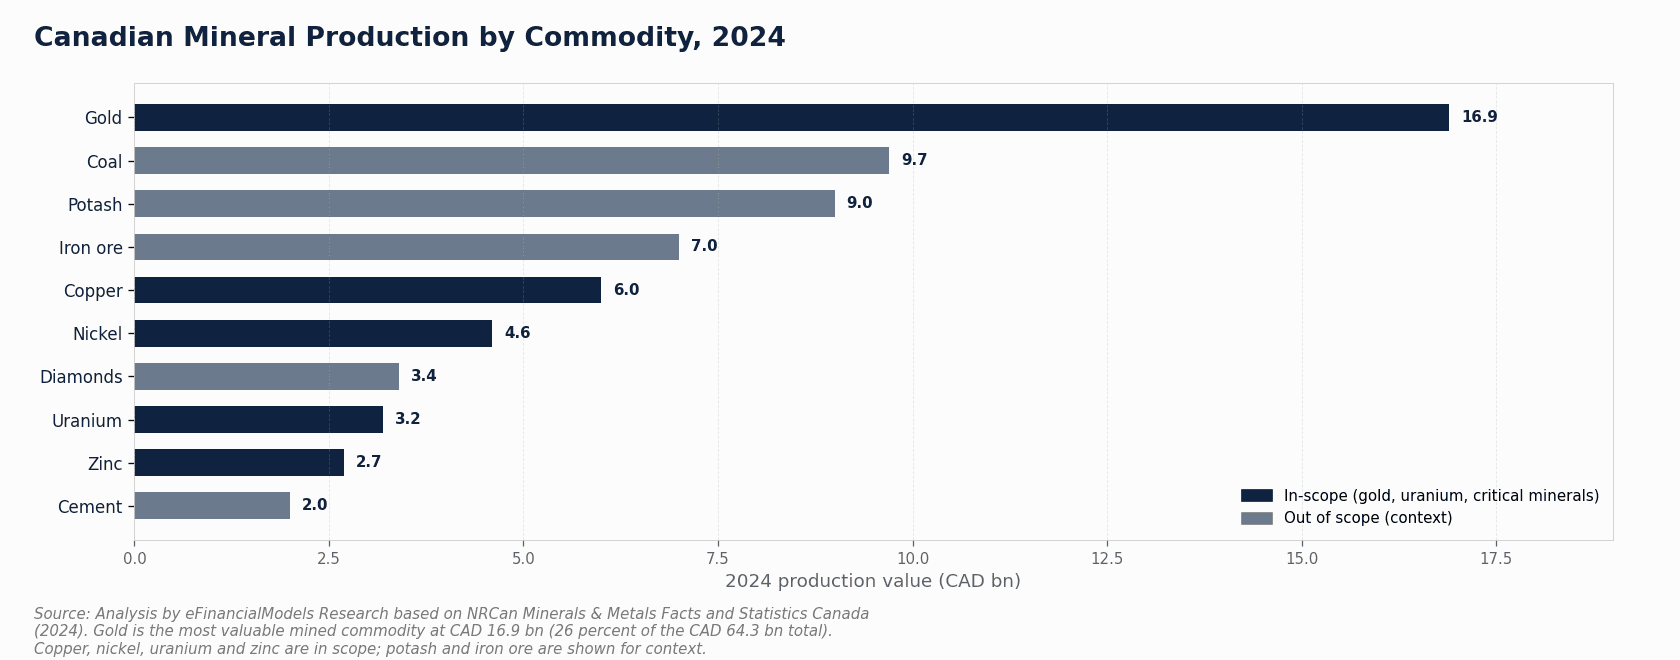
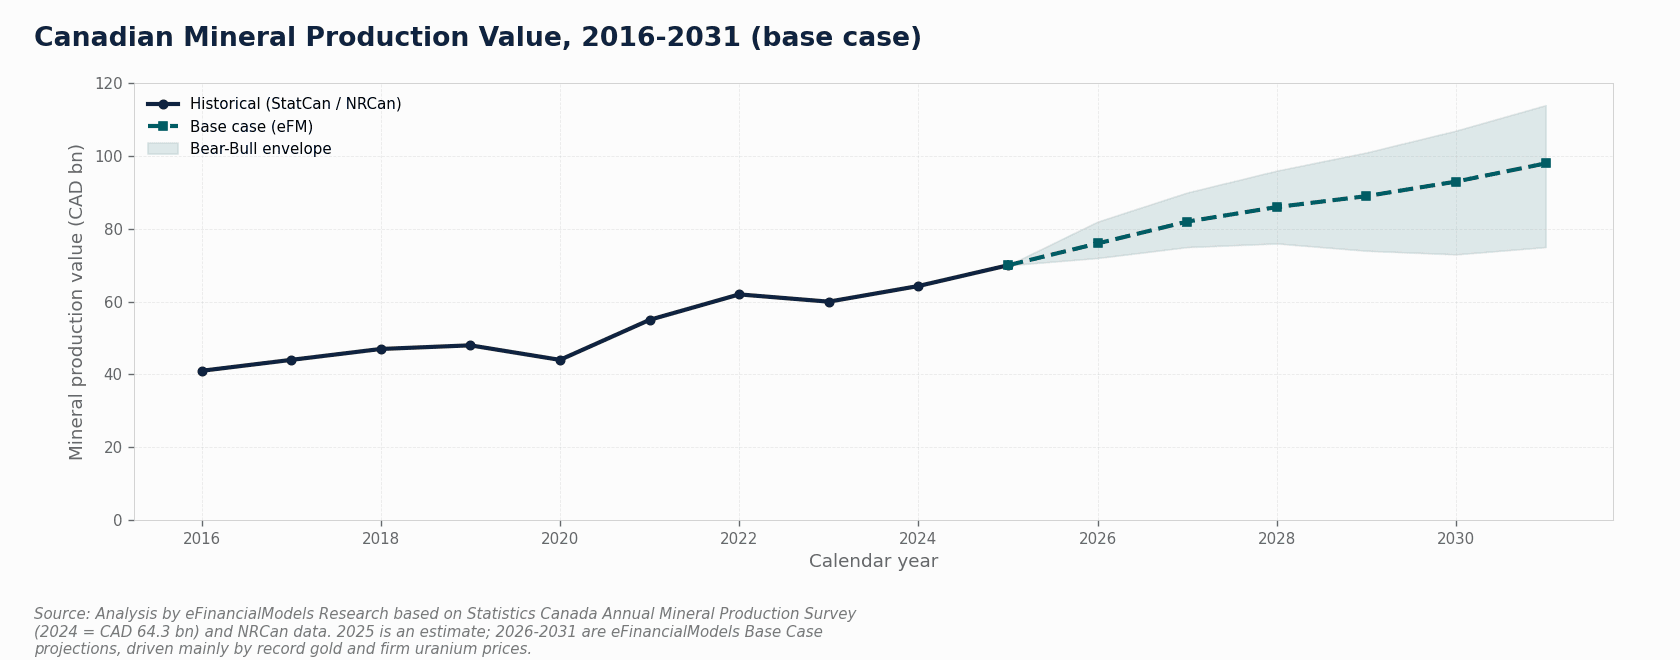
Canada’s mining sector is not one market — it is three distinct cash-flow regimes running simultaneously, and blending them into a single assumption set will misprice all three. Across the Canada mining 2026-2031 window, gold is a price-levered story trading above USD 5,000 per ounce, uranium is a structurally short market that opened 2026 above USD 80 per pound, and critical minerals are a policy-funded build-out spanning 34 listed minerals. Canada produced about CAD 64.3 billion of minerals and metals in 2024, according to Natural Resources Canada’s Minerals and Metals Facts, but that single headline hides three sub-segments with different demand drivers, price dynamics, and fiscal treatment. This article sets out the price assumptions, scenarios, and modeling architecture each of the three requires.
Key Takeaways
- Canada produced about CAD 64.3 billion of minerals and metals in 2024, with the broader sector contributing CAD 117 billion directly to GDP in 2023.
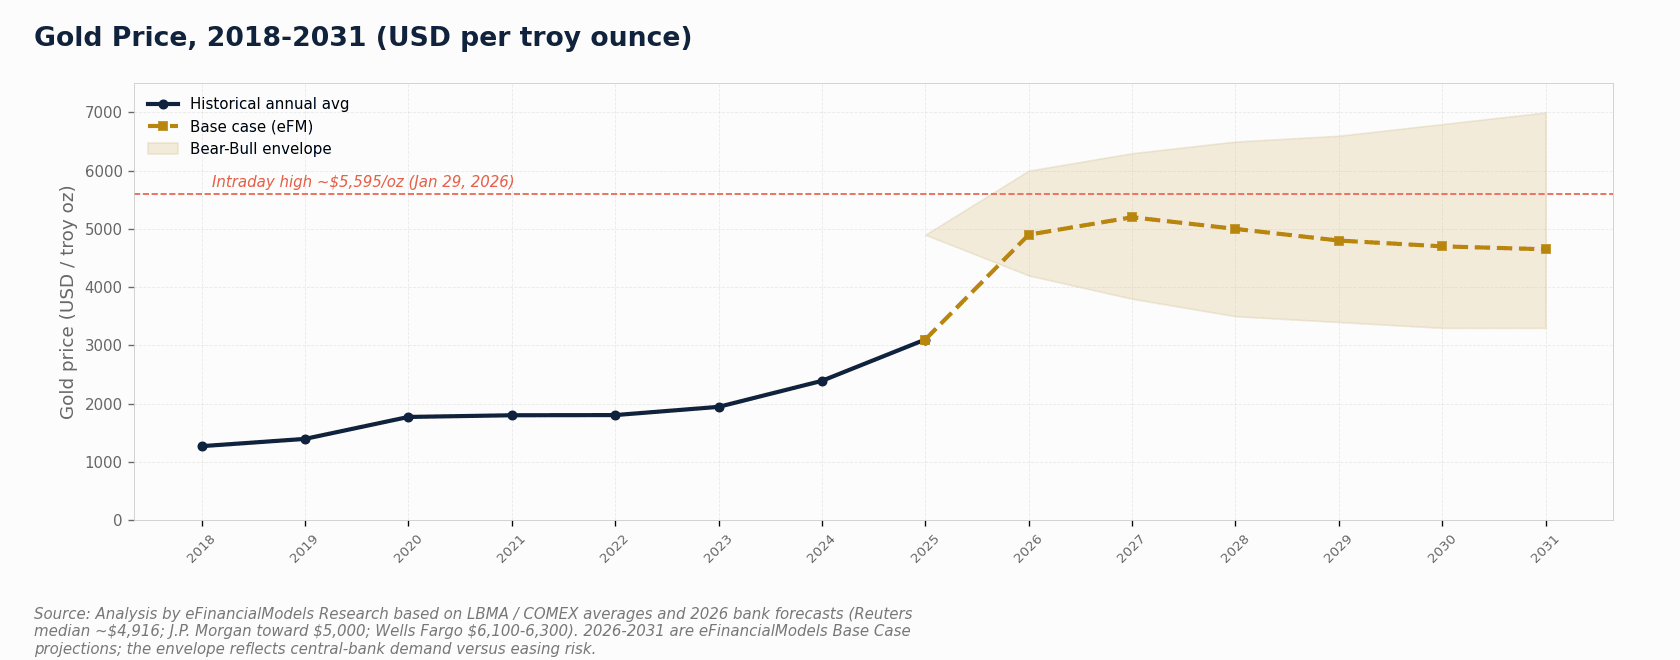
- Gold hit an intraday high near USD 5,595 per ounce on 29 January 2026, making Canadian gold assets price-levered rather than volume-growth stories.
- Uranium spot opened 2026 above USD 80 per pound and spiked to USD 101.41 on 29 January 2026, driven by reactor restarts and structural supply deficits.
- Canada’s Critical Minerals List now covers 34 minerals, and exploration spending on critical minerals reached CAD 2.1 billion in 2025 — 47% of all Canadian exploration, up from 25% in 2020.
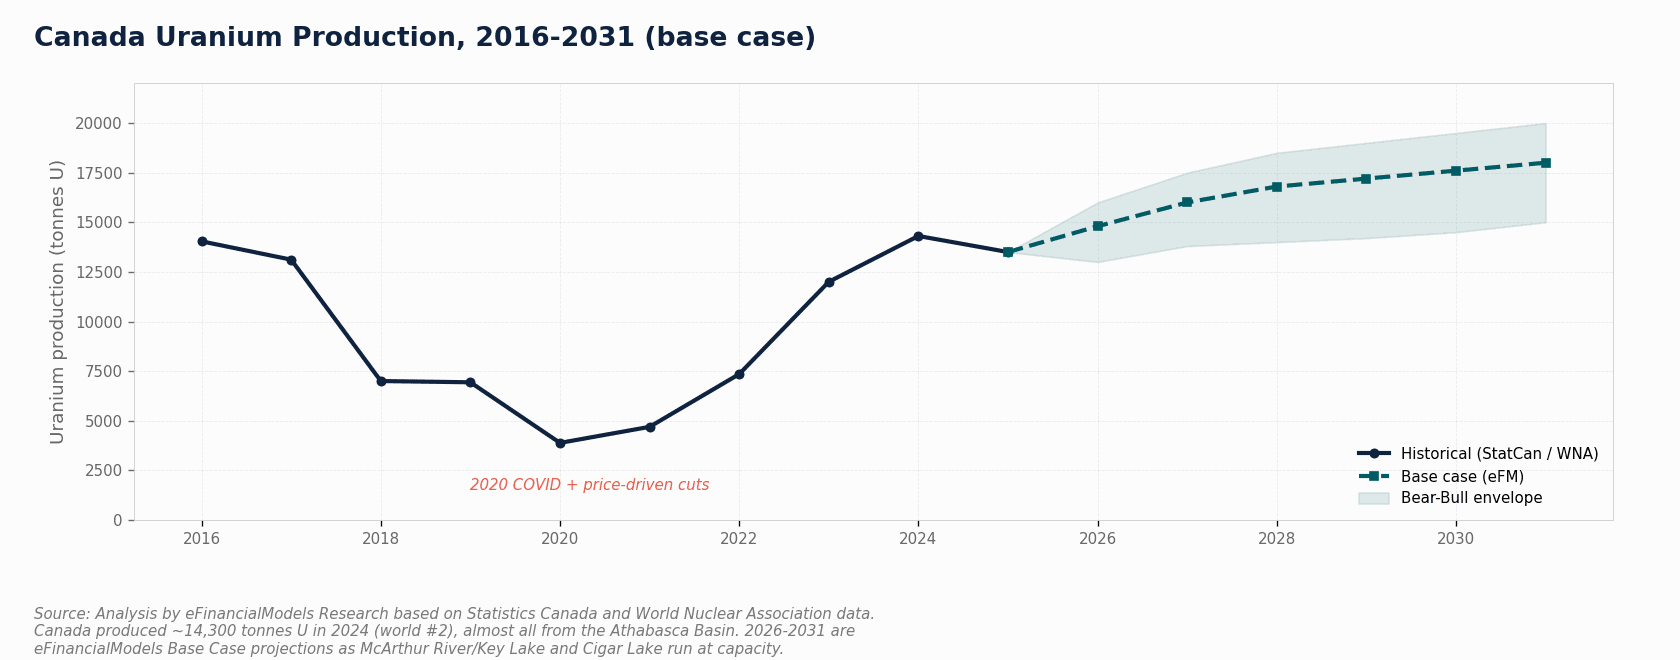
- Three scenarios for 2031: Base Case (55% probability) projects 230 tonnes of gold and 18,000 tonnes of uranium; Bear Case (25%) projects 202 tonnes and 15,000 tonnes; Bull Case (20%) projects 255 tonnes and 20,000 tonnes.
- The 30% Critical Mineral Exploration Tax Credit runs to March 2027, while permitting timelines, Indigenous consultation, and remote infrastructure are first-order NPV inputs — not footnotes — for every Canadian mining project.
Why Canada’s Mining Sector Demands Three Separate Models
Canada enters the 2026-2031 window as one of the few jurisdictions that combines globally significant scale across three distinct strategic categories: critical minerals for the energy transition, gold as the world’s pre-eminent monetary metal, and uranium as the fuel of a nuclear renaissance. The Canada Mining Market Study 2026-2031 by eFinancialModels maps all three sub-segments with separate demand drivers, price dynamics, and risk profiles.

The mining and minerals sector contributed roughly CAD 117 billion directly to gross domestic product in 2023, plus a further CAD 42 billion indirectly, according to Natural Resources Canada’s Minerals and the Economy data. That scale makes Canada a top-tier mining jurisdiction globally, but the three sub-segments behave nothing alike. Gold is a monetary-demand story at record highs. Uranium is a supply-security story commanding its strongest prices since the 2007 cycle. Critical minerals are a policy-and-industrial-strategy story whose economics still depend heavily on volatile battery metal prices and federal capital deployment.
Gold: A Price-Levered Story, Not a Volume Story
Canadian gold output is broadly flat near 200 tonnes per year, so equity returns are overwhelmingly a function of the realized gold price and each asset’s all-in sustaining cost (AISC — the full cost of producing one ounce, including sustaining capital and overhead).
Gold surpassed USD 4,000 per ounce for the first time in October 2025 and traded above USD 5,000 in early 2026, with an intraday high near USD 5,595 on 29 January 2026, driven by central-bank accumulation, monetary-easing expectations, and safe-haven demand. Canada ranks fourth among global gold producers at roughly 200 tonnes per year, with gold the single largest contributor to national production value according to Natural Resources Canada’s Minerals and Metals Facts, and production concentrated in the Abitibi greenstone belt of Ontario and Quebec, the Red Lake district, and Nunavut.
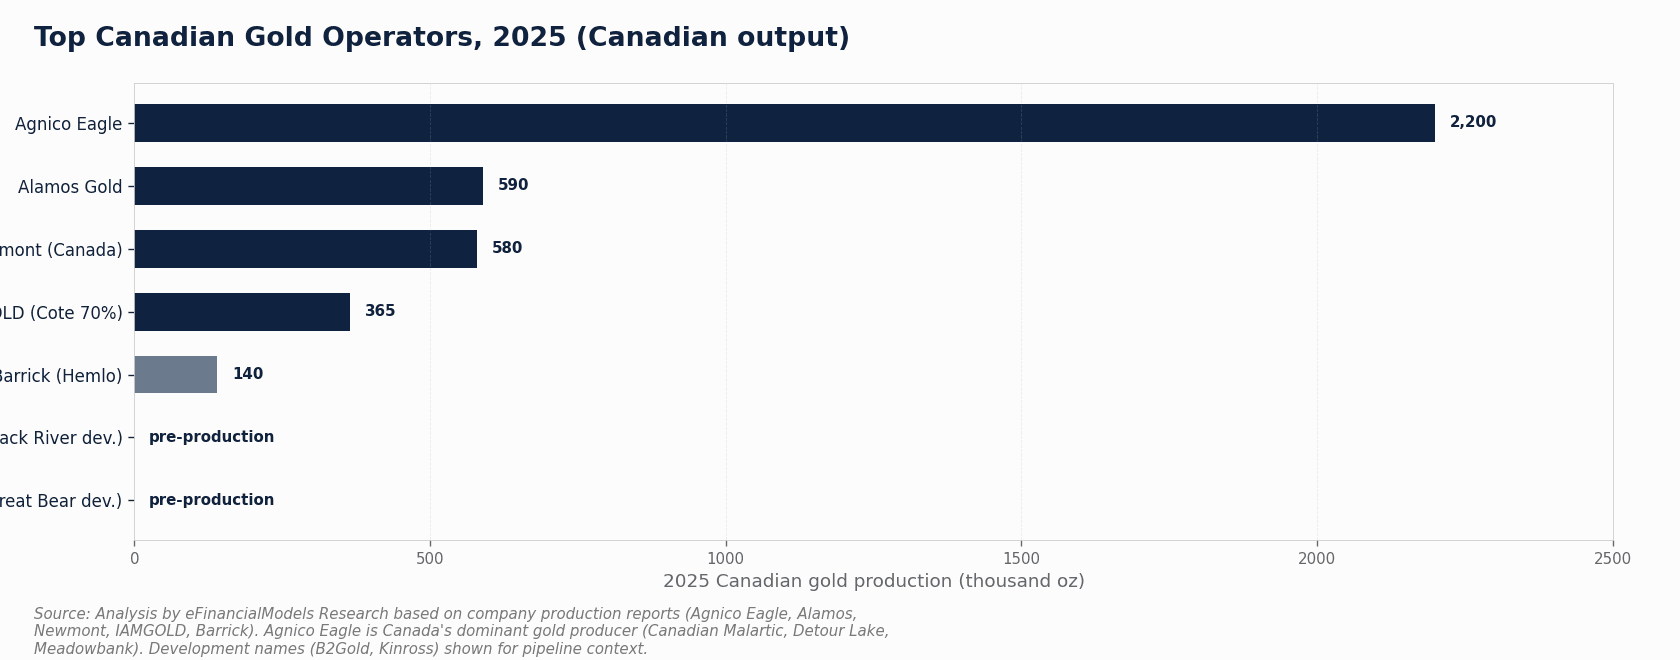
Agnico Eagle dominates Canadian gold production with approximately 2,200 thousand ounces of Canadian-attributable output in 2025, operating Canadian Malartic (the country’s largest gold mine), Detour Lake, Macassa, and Meadowbank. Alamos Gold follows at roughly 590 thousand ounces from Young-Davidson and Island Gold in Ontario. The new-mine wave of 2024-2026 — IAMGOLD’s Côté Gold (70% share, approximately 365 thousand ounces), Equinox Gold’s Greenstone, and Argonaut’s Magino — adds incremental volume, while record prices justify life extensions and lower-grade pushbacks across mature belts.
Worked Example: Gold Project IRR at Current Prices
Here’s the math for a mid-tier Canadian gold asset:
- Assumed gold price: USD 4,800 per ounce (base case midpoint)
- AISC: USD 1,600 per ounce (mid-range for an Abitibi operation)
- Operating margin per ounce: USD 4,800 minus USD 1,600 = USD 3,200
- Annual production: 200,000 ounces
- Annual operating cash flow: 200,000 × USD 3,200 = USD 640 million
- Initial capital cost: USD 1.2 billion
- Simple payback period: USD 1.2 billion divided by USD 640 million = approximately 1.9 years
Even a high-cost asset with AISC near USD 2,100 per ounce generates a margin of USD 2,700 per ounce at USD 4,800 gold — which is why marginal ounces, tailings retreatment, and stalled development projects are all back in the money. The eFinancialModels study illustrates that the elevated 2026 price regime lifts even high-cost assets well above a 15% equity hurdle rate. Central banks globally added a net 1,045 tonnes of gold to their reserves in 2024, a third consecutive year above 1,000 tonnes on the World Gold Council’s Gold Demand Trends: Full Year 2024, underscoring the structural monetary demand that underpins elevated gold prices for Canadian producers.
Uranium: The Athabasca Basin’s Structural Advantage
Canadian uranium is the tightest market and the cleanest supply story of the three sub-segments, anchored by the world’s highest-grade uranium district.
Canada is the world’s second-largest uranium producer at roughly 14,300 tonnes in 2024, essentially all from the Athabasca Basin in northern Saskatchewan — where ore grades run one to two orders of magnitude higher than the global average. World uranium demand is rising with reactor restarts, life extensions, new builds in Asia and the Middle East, and the emerging small modular reactor (SMR) pipeline. An SMR is a smaller, factory-built nuclear reactor; Canada’s Ontario Power Generation Darlington project is among the most advanced in the Western world. There are about 440 operable reactors worldwide according to the World Nuclear Association’s Nuclear Power in the World Today, a substantial and growing base of uranium demand that underpins the structural deficit facing Canadian and global producers.
Cameco is the dominant operator. Its McArthur River/Key Lake operation and Cigar Lake mine anchor a consolidated 2026 production outlook of 19.5 to 21.5 million pounds U₃O₈ on Cameco’s share basis, according to Cameco’s 2025-2026 production reports filed with the SEC. U₃O₈ (triuranium octoxide, or “yellowcake”) is the traded form of uranium, priced in USD per pound. The uranium spot price opened 2026 above USD 80 per pound and spiked to USD 101.41 on 29 January 2026, before settling near USD 83 in June 2026.
The development pipeline provides the principal supply optionality through 2031. NexGen Energy’s Rook I (Arrow deposit) is the largest undeveloped high-grade project, advancing through Canadian Nuclear Safety Commission (CNSC) licensing. Denison Mines’ Wheeler River targets in-situ recovery at the Phoenix deposit. Both represent licensing-gated optionality rather than committed base-case volume.
Critical Minerals: Policy-Rich, Price-Exposed
Critical minerals are the policy center of gravity and the growth option for Canada’s mining sector, but their economics depend heavily on volatile commodity prices and federal capital deployment.
Canada’s Critical Minerals List now spans 34 minerals, expanded in 2024 to add high-purity iron ore, phosphorus, and silicon metal. A “critical mineral” is one deemed essential to economic security and the energy transition. Exploration spending on critical minerals reached CAD 2.1 billion in 2025, representing 47% of all Canadian exploration — up from 25% in 2020, on exploration data published in Natural Resources Canada’s Minerals and Metals Facts. There were 56 active critical-mineral projects in 2024, with commercial milestones including Sayona’s North American Lithium mine in Quebec and Vale’s Voisey’s Bay nickel expansion in Newfoundland and Labrador.
Federal capital is being deployed at scale to bridge the gap between strategic value and project-level returns. The Critical Minerals Sovereign Fund provides CAD 2 billion over five years through equity, debt, and offtake. The First and Last Mile Fund offers up to CAD 1.5 billion through 2029-2030 for enabling infrastructure. An October 2025 package aimed to unlock CAD 6.4 billion of projects, and a March 2026 announcement committed CAD 165 million to 22 projects across 8 provinces. Metal-ore mining capital expenditure is forecast at about CAD 13.5 billion in 2026, up 13.5% on 2025, on Statistics Canada’s Capital and repair expenditures, non-residential tangible assets, by industry and geography table. The IEA World Energy Outlook 2024 frames the scale of the structural tailwind behind that build-out, with clean-energy demand for critical minerals rising several times over by 2040.
The decisive theme for the horizon is midstream: Canada’s ambition is to move from mining concentrate to refining and producing battery-grade material and uranium conversion domestically, reducing reliance on Chinese processing.
Three Scenarios to 2031: Base, Bear, and Bull
The three scenarios below reflect different assumptions about mine delivery, permitting pace, and commodity prices. Each scenario assigns a probability and projects output for gold and uranium alongside headline price assumptions.
| Metric | Bear (25%) | Base (55%) | Bull (20%) |
|---|---|---|---|
| Gold output 2031 (tonnes) | 202 | 230 | 255 |
| Uranium output 2031 (tonnes U) | 15,000 | 18,000 | 20,000 |
| Gold price 2031 (USD/oz) | 3,400-4,200 | 4,600-5,200 | ≥6,000 |
| Uranium spot 2031 (USD/lb) | 65-75 | 85-96 | ≥110 |
| Cameco output (Mlbs, share) | ~18 | 20-21 | ≥22 |
The Bear Case assumes slower mine ramps, permitting friction, and a price correction. The Base Case holds the elevated price regime and steady project delivery. The Bull Case assumes faster delivery and sustained high prices driven by continued central-bank gold buying and accelerated nuclear build-out.
Demand Drivers by Sub-Segment
Canadian supply is sold into global markets, so the demand analysis that matters for asset valuation is global — and it differs sharply across the three sub-segments.
Gold demand is monetary and investment-led. Central banks bought roughly 755 tonnes in 2026 on some estimates, with emerging-market buyers (China, India, Turkey) prominent, extending the run of 1,000-tonne-plus years recorded in the World Gold Council’s Gold Demand Trends: Full Year 2024. This demand base responds to real interest rates, central bank policy, and risk sentiment rather than industrial activity.
Uranium demand is the cleanest structural story. The market has moved into a structural deficit between primary mine supply and reactor requirements, drawing down secondary inventories. The IEA’s Global Critical Minerals Outlook 2025 projects steeply rising demand for lithium, graphite, nickel, copper, and rare earths to 2030 on electric-vehicle batteries, grid-scale storage, and power-grid investment — lithium and graphite demand could roughly double or more.
| Sub-Segment | Primary Driver | Near-Term Balance | 2031 Outlook |
|---|---|---|---|
| Gold | Central-bank + investment demand | Tight; record prices | Elevated; price-driven |
| Uranium | Reactor restarts, life extensions, SMRs | Structural deficit | Deficit persists |
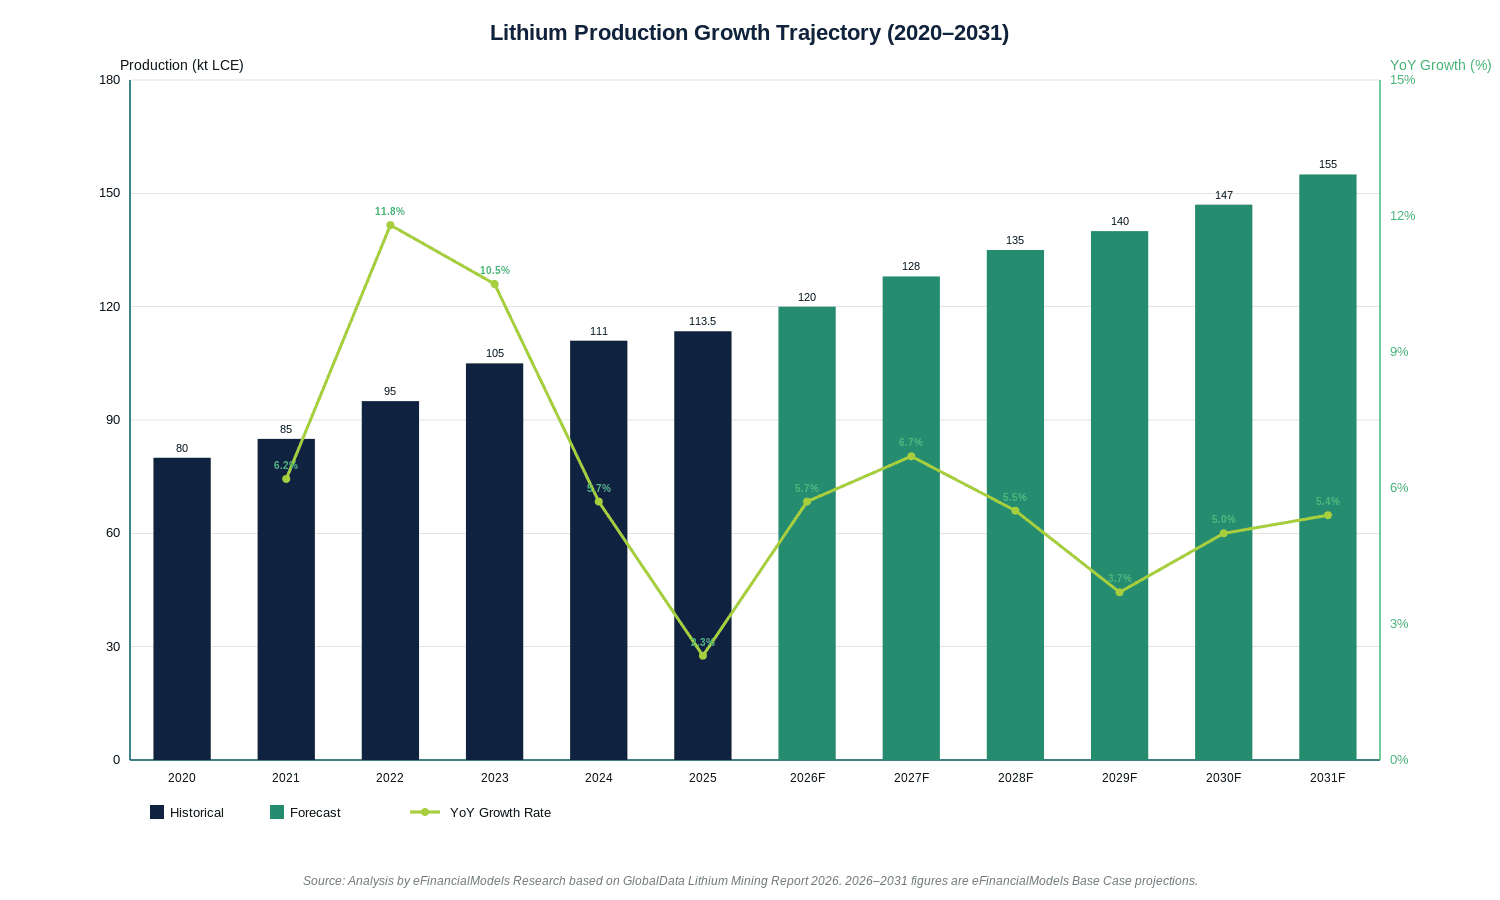
| Lithium / Graphite | EV batteries, grid storage | Recovering from surplus | Deficit onset late-decade |
| Copper | Electrification, grids, data centers | Tightening to deficit | Structural deficit |
| Nickel | Batteries + stainless | Surplus / soft prices | Rebalancing |
Regulatory and Policy Context
Canada’s regulatory environment is undergoing its most significant reform in a generation, with permitting timelines and Indigenous consultation as the binding constraints on project delivery.
Bill C-5 (the Building Canada Act) allows the federal cabinet to designate projects in the national interest and streamline or supersede the standard sequence of federal approvals, compressing multi-year timelines for nation-building projects. Ontario’s parallel Bill 5 (the Protect Ontario by Unleashing our Economy Act) creates “special economic zones,” with the Ring of Fire as the flagship, backed by CAD 1 billion in provincial infrastructure commitment.
The 30% Critical Mineral Exploration Tax Credit (CMETC) is a non-refundable federal credit on eligible flow-through share exploration, running to March 2027. A flow-through share is one whose issuer renounces exploration expenses to the investor, who claims the deduction and CMETC where eligible. This is the single most powerful incentive available to junior explorers and their investors for early-stage critical-minerals exposure.
Cross-cutting all policy is the constitutional duty to consult Indigenous peoples — the legal obligation to consult, and where appropriate accommodate, Indigenous peoples on decisions affecting their rights. Indigenous equity participation and impact-benefit agreements are increasingly a commercial best practice that de-risks projects and is now as decisive to project net present value as the orebody itself.
Common Modeling Mistakes to Avoid
Financial modellers working on Canadian mining assets consistently make five errors that distort valuations.
Mistake 1: Blending all three sub-segments into one assumption set. Gold, uranium, and critical minerals have different demand drivers, price dynamics, and risk profiles. A single “mining” WACC or price deck will misprice all three. Fix: build separate assumption architectures for each sub-segment.
Mistake 2: Applying spot uranium prices to all volumes. Cameco and other producers blend a multi-year contract book against spot. Applying spot to 100% of volumes overstates revenue volatility and misrepresents realized prices. Fix: model a contract-and-spot blend, reflecting Cameco’s actual commercial structure.
Mistake 3: Treating permitting timelines as fixed or footnotes. Canadian projects in remote regions face multi-year environmental assessments and Indigenous consultation processes. A project’s risk-adjusted NPV (net present value — the present value of future cash flows minus initial investment) is as sensitive to its permitting pathway as to its grade. Fix: build scenario-based timelines with explicit permitting risk.
Mistake 4: Ignoring province-specific mining taxes. Saskatchewan applies a uranium royalty, Ontario and Quebec apply different gold mining taxes, and Quebec applies a lithium-specific regime. Using a national blended rate produces material errors. Fix: apply province-specific fiscal regimes to each asset.
Mistake 5: Treating Athabasca developers as base-case volume. NexGen’s Rook I and Denison’s Wheeler River are licensing-gated. Their first-production timing depends on CNSC licensing and final investment decisions not yet settled as of mid-2026. Fix: model these as optionality with probability-weighted timelines, not committed production.
Tools and Templates for Canadian Mining Analysis
Translating the demand, price, cost, fiscal, and scenario assumptions in this study into project cash flows requires purpose-built financial models. Generic DCF templates miss the province-specific royalties, the CMETC flow-through mechanics, and the scenario architecture needed for Canadian mining.
For investors and modellers focused on the broader mining sector, EFM’s mining financial model templates provide structured frameworks for project-level cash flow analysis. For those tracking the broader market context, EFM’s industry market study templates cover comparable sector analyses across geographies and industries.
The key modeling inputs for Canadian mining assets are:
- Gold: Price deck (USD 4,600-5,200 base), AISC by asset (USD 1,100-1,800), 60/40 debt-equity, WACC approximately 8% real, province-specific mining tax.
- Uranium: Spot USD 85-96 per pound base, blended against contract book, Saskatchewan royalty, Athabasca operating cost advantage from high grade.
- Critical minerals: Commodity-specific price decks, 30% CMETC on eligible flow-through exploration, federal capital and offtake modeled where applicable.
Frequently Asked Questions
What makes Canada’s uranium sector different from other global uranium producers?
Canada’s Athabasca Basin in northern Saskatchewan hosts ore grades one to two orders of magnitude higher than the global average, giving Canadian operations a structural cost advantage over Kazakhstan’s in-situ-leach operations or Australia’s by-product output. Cameco’s McArthur River/Key Lake and Cigar Lake mines anchor a 2026 production outlook of 19.5 to 21.5 million pounds U₃O₈ on Cameco’s share basis. Beyond geology, Canadian uranium benefits from Western governance, a transparent contract book, and proximity to allied fuel-cycle infrastructure. The uranium spot price opened 2026 above USD 80 per pound, and the structural deficit between primary mine supply and reactor requirements is expected to persist through 2031 in the base case.
How does the 30% CMETC work for junior mining investors?
The Critical Mineral Exploration Tax Credit (CMETC) is a 30% non-refundable federal tax credit on eligible exploration expenses renounced through flow-through shares. A flow-through share is one whose issuer (the mining company) renounces exploration expenses to the investor, who claims the deduction on their own tax return. The investor then also claims the 30% CMETC on top of the deduction. For example, a CAD 100,000 investment in eligible flow-through shares generates a CAD 100,000 deduction plus a CAD 30,000 tax credit, significantly reducing the after-tax cost of the investment. The CMETC runs to 31 March 2027 and covers minerals on Canada’s Critical Minerals List of 34 minerals.
What is the base-case gold price assumption for 2031 modeling?
The eFinancialModels base case holds gold in a USD 4,600 to 5,200 per ounce band through the 2026-2031 horizon, easing modestly as monetary tailwinds mature. This reflects a Reuters analyst survey median near USD 4,916 per ounce, J.P. Morgan’s view of prices pushing toward USD 5,000 by Q4 2026, and Wells Fargo’s year-end target of USD 6,100 to 6,300. The bear-case stress test runs to USD 3,400 per ounce, which is the level at which high-cost Abitibi operations (AISC near USD 2,100) would still generate positive margins but would fall below a 15% equity hurdle. Modellers should run both scenarios explicitly rather than relying on a single point estimate.
Why are permitting timelines treated as NPV inputs rather than assumptions?
A Canadian mining project’s risk-adjusted net present value is as sensitive to its permitting-and-infrastructure pathway as to its grade and commodity price. Multi-year environmental assessments, the constitutional duty to consult Indigenous peoples, and remote infrastructure gaps (particularly in the Athabasca Basin, Nunavut, and the Ring of Fire) can add years to project timelines. A one-year delay on a project with USD 500 million in annual cash flow at an 8% discount rate reduces NPV by approximately USD 463 million in present value terms. Bill C-5 aims to compress these timelines, but its implementation is untested and subject to legal challenge. Modellers should build scenario-based timelines with explicit probability weights.
How should modellers treat Agnico Eagle versus diversified majors like Barrick or Newmont?
Agnico Eagle and Cameco are Canada-centric and provide the cleanest pure-play exposures to Canadian gold and uranium respectively. Agnico Eagle’s Canadian output exceeded 2 million ounces in 2025, making it Canada’s largest gold producer by a wide margin. Barrick’s Canadian exposure is limited to the Hemlo operation in Ontario (approximately 140 thousand ounces), and Newmont’s Canadian portfolio has been rationalised after selling Red Lake. For diversified majors, Canadian assets must be valued as a fraction of a broader global portfolio using a sum-of-the-parts approach, applying Canadian-specific fiscal regimes and permitting risk to the Canadian segment only, not to the consolidated entity.
What is the Ring of Fire and why does it matter for critical minerals?
The Ring of Fire is a mineral-rich region in northern Ontario containing significant deposits of nickel, chromite, copper, and other critical minerals. Ontario’s Bill 5 designates it as a special economic zone, and the province has committed CAD 1 billion to Ring of Fire infrastructure. The region represents one of Canada’s largest undeveloped critical-mineral opportunities, but it faces significant infrastructure challenges: there are no roads or rail connections to the remote area, and meaningful Indigenous consultation is required with multiple First Nations communities. The federal First and Last Mile Fund (up to CAD 1.5 billion through 2029-2030) is specifically designed to address enabling infrastructure gaps like those in the Ring of Fire.
What is the difference between uranium spot price and realized price for modeling?
The uranium spot price is the price for immediate delivery, which opened 2026 above USD 80 per pound and spiked to USD 101.41 on 29 January 2026. However, major producers like Cameco sell a significant portion of their output under multi-year long-term contracts negotiated at different price levels, often with floor prices and escalation clauses. The realized price — what the company actually receives — is a blend of spot and contract prices. Applying spot to 100% of volumes overstates revenue in a rising market and understates it in a falling one. Modellers should request or estimate the contract-versus-spot split for each producer and apply the appropriate blended price to each tranche of volume.
How do I build a financial model for a Canadian gold project?
A Canadian gold project model should include: (1) a commodity price deck (base case USD 4,600-5,200 per ounce through 2031); (2) asset-specific AISC (all-in sustaining cost) ranging from USD 1,100-1,800 per ounce depending on location and mine type; (3) province-specific mining tax rates (Ontario, Quebec, and other provinces have different regimes); (4) a capital expenditure schedule with explicit permitting risk and timeline scenarios; (5) a debt-equity structure (typically 40% debt, 60% equity for mid-tier producers); (6) a WACC of approximately 8% real; and (7) sensitivity analysis on gold price, AISC, and permitting timeline. The worked example in this article shows that a 200,000 oz/year operation at USD 4,800 gold and USD 1,600 AISC generates USD 640 million in annual operating cash flow and a ~1.9-year payback on USD 1.2 billion capex.
Conclusion
Canada’s mining sector through 2031 offers three distinct investment theses: a price-levered gold story at record highs, a structurally tight uranium market with tier-one geology, and a policy-propelled critical-minerals build-out that requires federal capital to bridge weak spot prices. The modeling discipline required is to keep these three sub-segments separate, apply province-specific fiscal regimes, and treat permitting timelines and Indigenous partnership as first-order NPV inputs.
I recommend downloading the Canada Mining Market Study 2026-2031 from eFinancialModels, which provides the full scenario architecture, pricing assumptions, operator analysis, and risk matrix needed to build rigorous project-level financial models for Canadian gold, uranium, and critical-mineral assets.
























































