0 ITEMS

The Comprehensive Guide to Projected Profit and Loss
A projected profit and loss (P&L) statement is a forward-looking income statement that turns assumptions about volume, price, costs, financing and tax into profit for future periods, and a chief financial officer (CFO) builds it in five steps: set the base year, forecast revenue, project costs, add depreciation, interest and tax, then stress-test the drivers. In the worked example below, an illustrative USD 20 million company grows net income from USD 815,625 in fiscal year 2026 (FY2026) to USD 1,560,151 in FY2029 in the base case, but reaches only USD 417,553 in a downside case.
Key Takeaways
- A projected P&L extends the income statement to future periods and rests on explicit assumptions for volume, price, margins, costs, interest and tax.
- Build it in five steps: base year, revenue, costs, depreciation, interest and tax, then scenarios, with every assumption held in one labelled input cell.
- In the worked example, base-case net income rises from USD 815,625 in FY2026 to USD 1,560,151 in FY2029, lifting net margin from 4.08% to 6.35%.
- The downside case cuts cumulative FY2027 to FY2029 net income by USD 2,685,229, so scenario testing shows how far profit can fall.
- SEC pro forma statements adjust past results for a transaction, while a projected P&L looks forward, so each version needs a clear label.
A projected P&L forecasts revenue, costs and net income for future periods
A profit and loss (P&L) statement, also called an income statement, reports revenue, expenses and net income for a period, and a projected version fills the same layout with future figures. Cornell Law School’s Legal Information Institute describes the income statement as the “accountant’s primary measure of performance of a business”, in which revenue less expenses, including income tax expense, gives net income (Cornell Legal Information Institute, income statement).
The label “pro forma” causes confusion. Under US Securities and Exchange Commission (SEC) rule 210.11-02 in Title 17 of the Code of Federal Regulations (CFR), pro forma statements of comprehensive income reflect adjustments “assuming those adjustments were made as of the beginning of the fiscal year presented” (17 CFR 210.11-02). That adjusts a past period for a transaction, while a projected P&L estimates periods that have not happened, so the two should never share a label.
International Financial Reporting Standards (IFRS) 18, effective for annual periods beginning on or after 1 January 2027, requires two new defined subtotals in the statement of profit or loss, operating profit and profit before financing and income taxes (IFRS Foundation, IFRS 18). The worked example has no investment income, so its EBIT (earnings before interest and taxes) equals both subtotals.
Build a projected P&L in five steps
Five steps take a base year to a tested net income figure, each drawing on labelled inputs, as in the eFinancialModels financial projections templates.
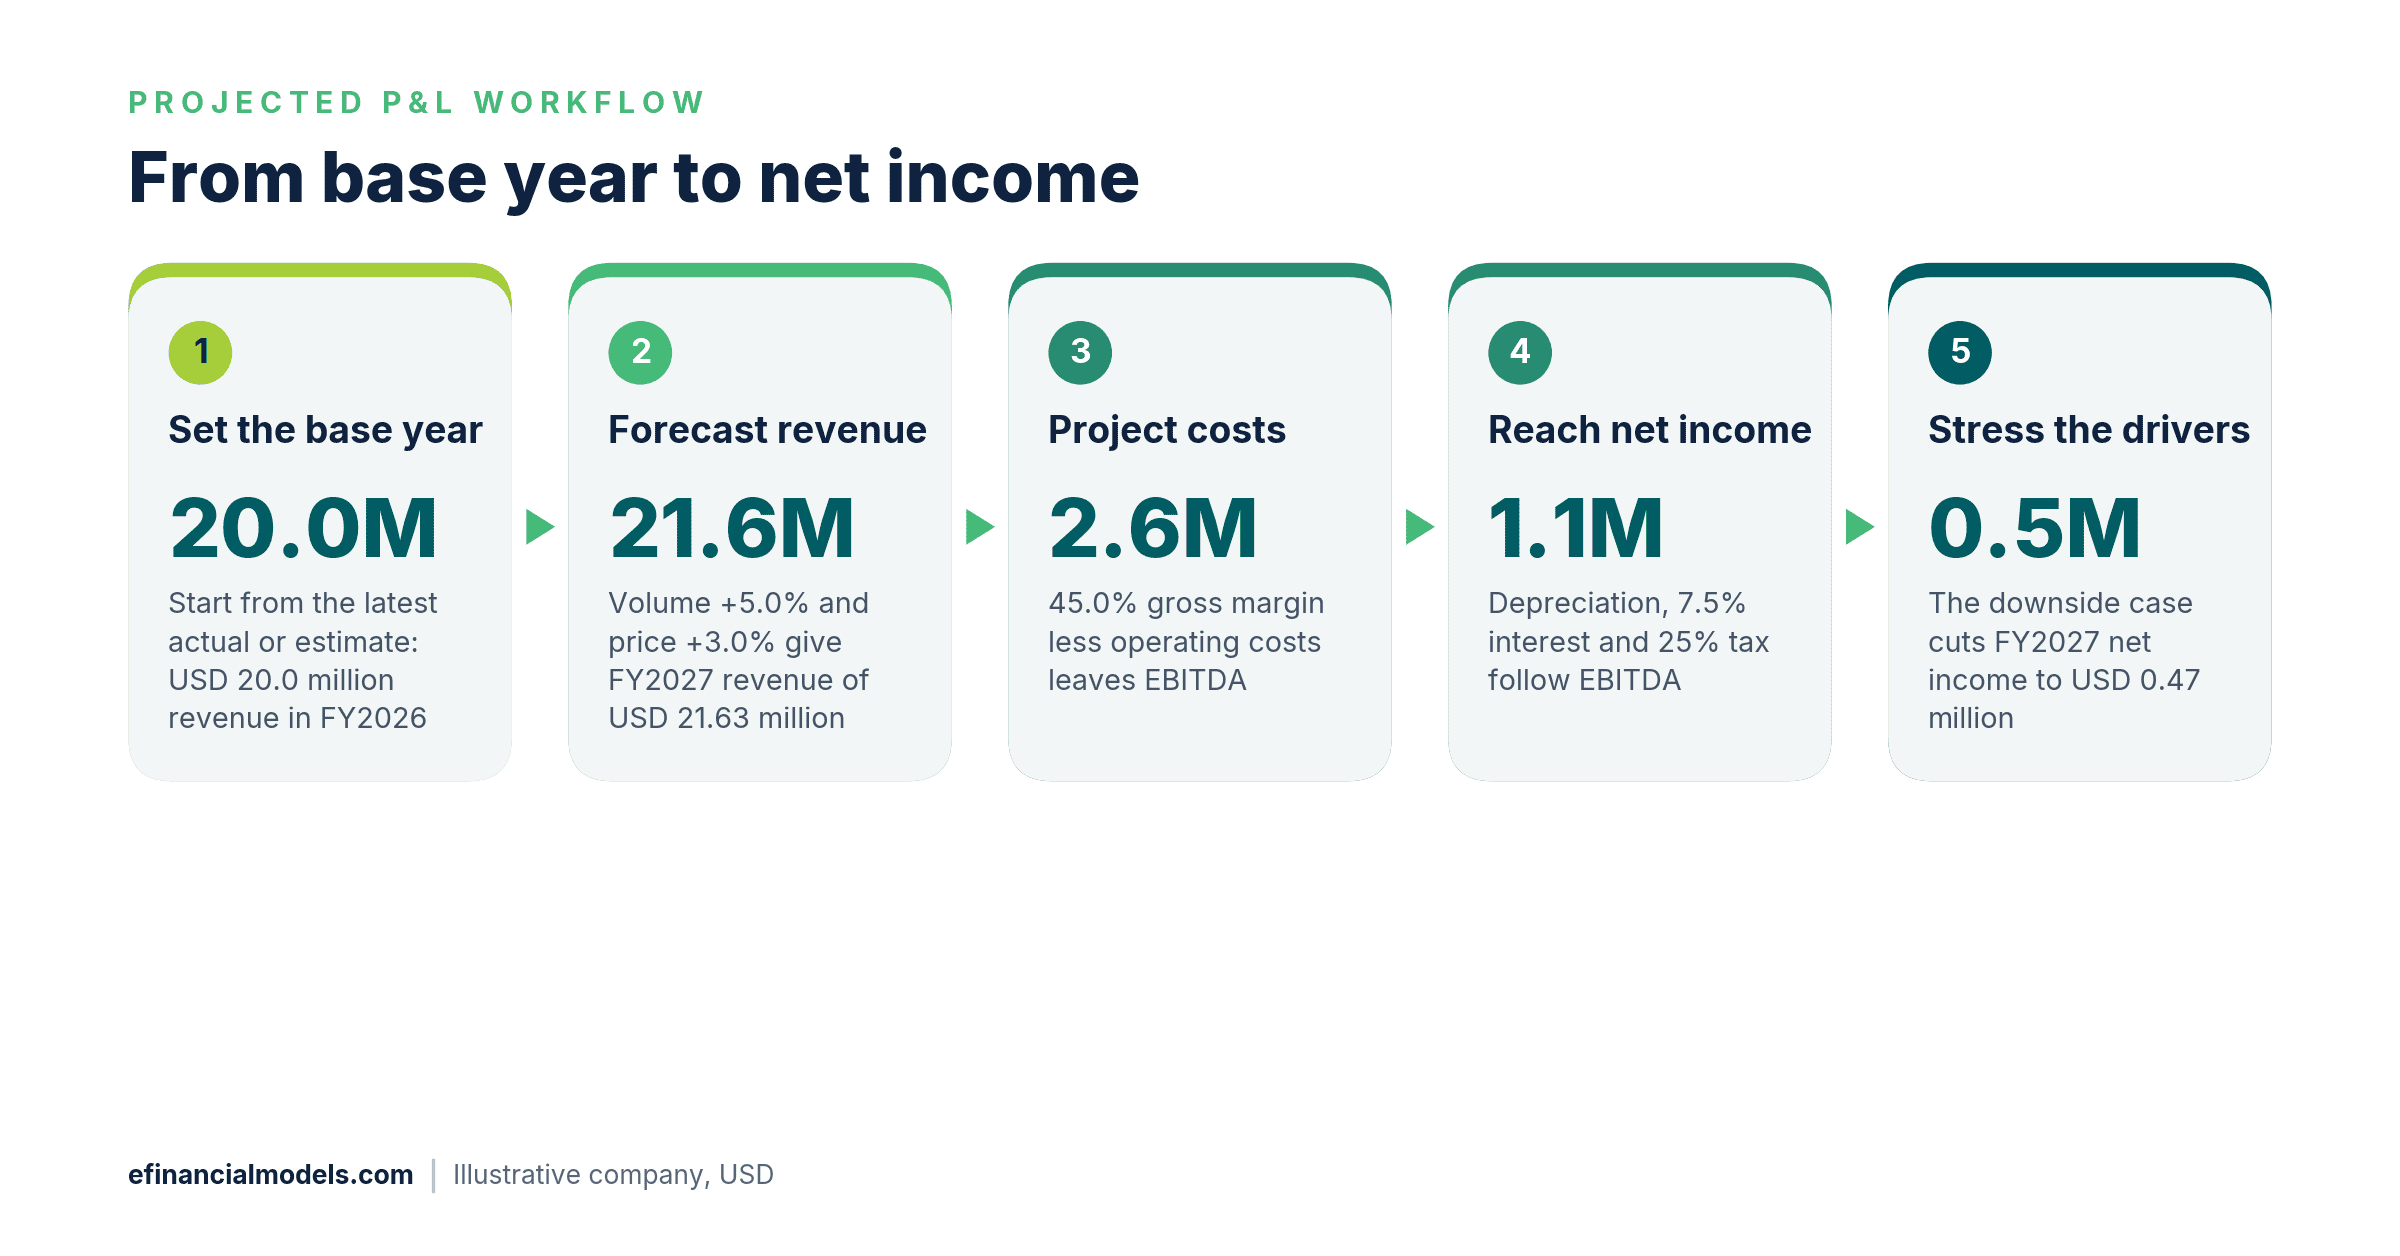
Each step feeds the next, and the final step tests how fragile the result is.
- Set the base year. Use the latest actual or estimated P&L and reconcile it to the ledger, because every projected line grows from it.
- Forecast revenue. Multiply the prior year by one plus volume growth and one plus price growth, so price and volume stay visible. Subscription, project and service businesses swap in customers and churn, or backlog and conversion, as the driver.
- Project costs. Cost of goods sold (COGS) follows gross margin, marketing follows revenue, and people and overheads follow headcount and inflation. EBITDA (earnings before interest, taxes, depreciation and amortization) is gross profit less these operating costs.
- Add depreciation, interest and tax. Depreciation and amortization (D&A) come from the asset schedule, interest from the debt schedule, and tax from the tax rate applied to pre-tax profit.
- Stress the drivers. Re-run the statement with weaker volume, price and margin, and record the gap to the base case.
Choose drivers that match how each cost behaves
Personnel and overheads behave as fixed costs that move with headcount and inflation, while cost of goods sold and marketing vary with revenue, so each line needs a driver that explains it. Outside inputs help only when their definition matches the line they feed.
The Federal Open Market Committee held the federal funds target range at 3-3/4 to 4 percent on 28 October 2026 (Federal Reserve, 28 October 2026). That is a policy rate, not a corporate borrowing cost, so the interest line should follow the company’s own debt schedule.
US federal corporate income tax is 21 percent of taxable income (26 U.S.C. 11, current text in 2026). Companies with state or foreign taxes need a blended rate confirmed by a tax adviser.
Across 5,994 US companies in Aswath Damodaran’s “Margins by Sector (US)” table, data as of January 2026, the total-market gross margin is 37.76% and the net margin 9.74% (Aswath Damodaran, margins by sector, January 2026). These averages differ widely by industry, so they are a sanity check, not a target.
Worked example: a three-year projected P&L for a USD 20 million company
In this example, an illustrative company with USD 20,000,000 of estimated revenue in fiscal year 2026 (FY2026) projects FY2027 to FY2029 in a base case and a downside case. Base-case volume grows 5.0%, 4.0% and 3.5% with price up 3.0%, 3.0% and 2.5%, and gross margin is 45.0%, 45.5% and 46.0%. Headcount grows 3.0%, 2.0% and 2.0% with wages up 4.0%, 3.5% and 3.5%. Marketing is 6.0% of revenue, other overheads rise 3.0% a year, and tax is an assumed blended 25% of pre-tax profit.
The FY2026 base year has a 44.5% gross margin, USD 4,000,000 of personnel cost and USD 1,500,000 of other overheads. Depreciation is USD 700,000 on existing assets plus straight-line depreciation over eight years of USD 900,000 of capital spending a year. Debt is USD 5,500,000 at the start of FY2026 and USD 5,000,000 at the start of FY2027, repaid USD 500,000 a year, with interest of 7.5% on the opening balance.
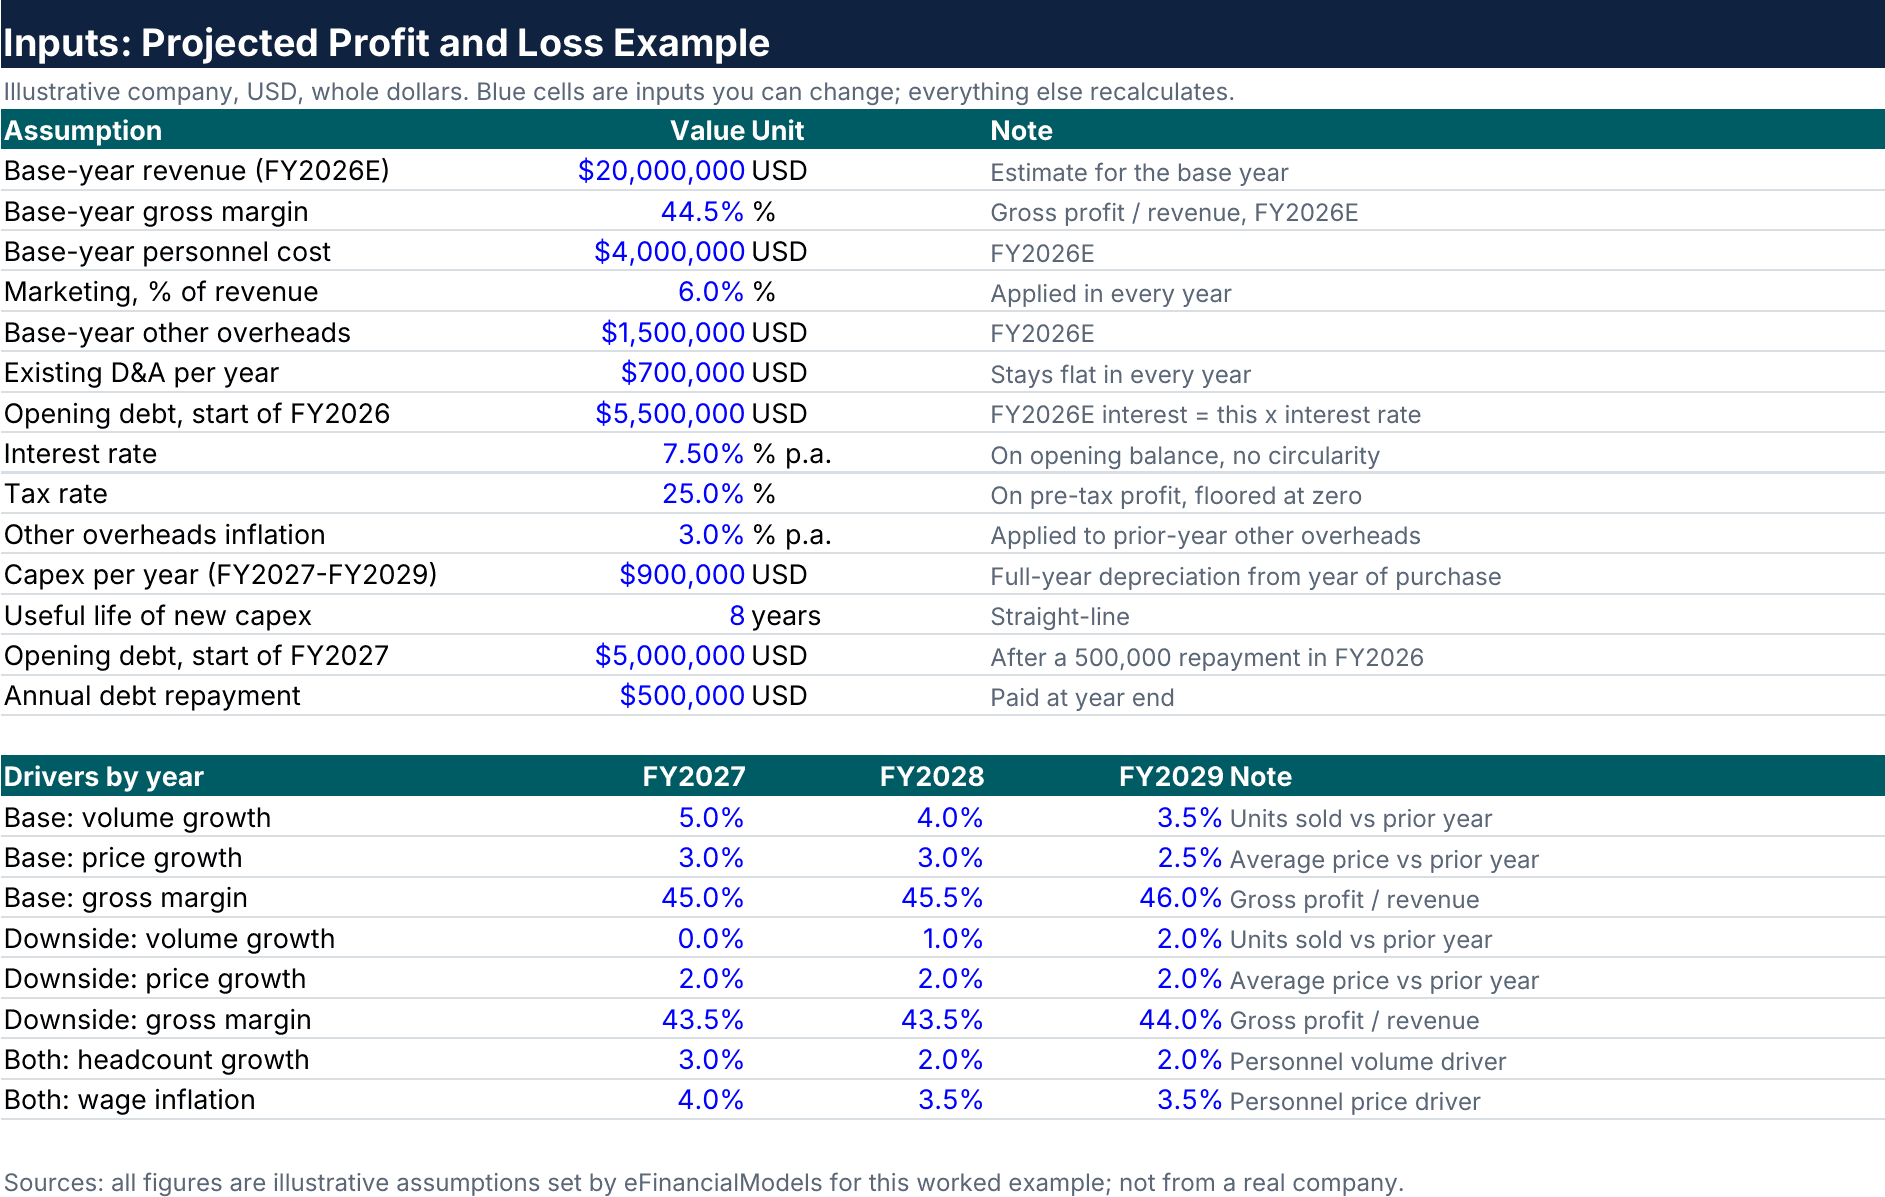
Inputs sheet of the worked example: every blue cell is an assumption the finance team can change. Source: eFinancialModels Analysis
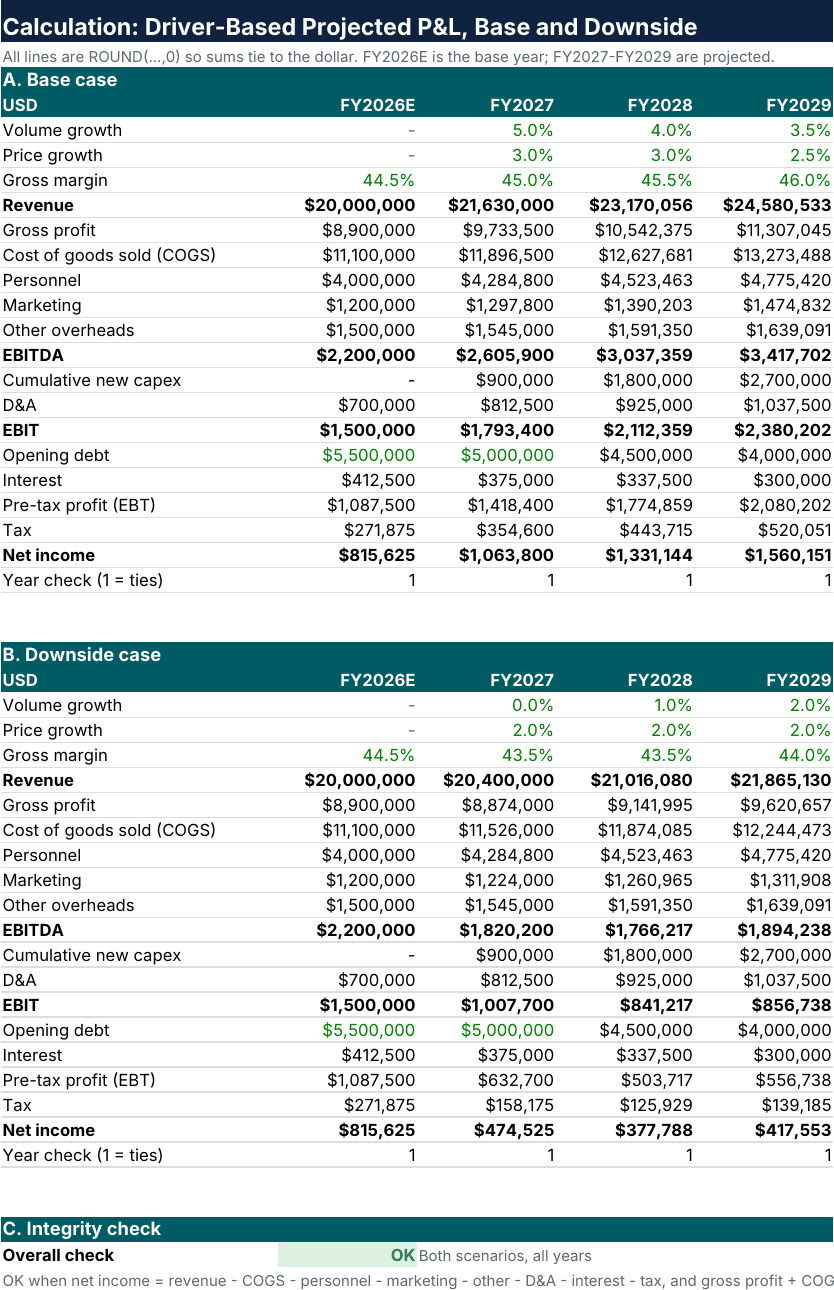
Calculation sheet: each line of the projected income statement follows from the inputs, in base and downside cases. Source: eFinancialModels Analysis
| Base case, USD | FY2026 | FY2027 | FY2028 | FY2029 |
|---|---|---|---|---|
| Revenue | 20,000,000 | 21,630,000 | 23,170,056 | 24,580,533 |
| Gross profit | 8,900,000 | 9,733,500 | 10,542,375 | 11,307,045 |
| Personnel | 4,000,000 | 4,284,800 | 4,523,463 | 4,775,420 |
| Marketing | 1,200,000 | 1,297,800 | 1,390,203 | 1,474,832 |
| Other overheads | 1,500,000 | 1,545,000 | 1,591,350 | 1,639,091 |
| EBITDA | 2,200,000 | 2,605,900 | 3,037,359 | 3,417,702 |
| D&A | 700,000 | 812,500 | 925,000 | 1,037,500 |
| EBIT (earnings before interest and taxes) | 1,500,000 | 1,793,400 | 2,112,359 | 2,380,202 |
| Interest | 412,500 | 375,000 | 337,500 | 300,000 |
| Pre-tax profit | 1,087,500 | 1,418,400 | 1,774,859 | 2,080,202 |
| Tax at 25% | 271,875 | 354,600 | 443,715 | 520,051 |
| Net income | 815,625 | 1,063,800 | 1,331,144 | 1,560,151 |
Each line is rounded to the nearest dollar. FY2027 EBITDA is 9,733,500 less 4,284,800, 1,297,800 and 1,545,000, which is USD 2,605,900, a 12.05% margin. The FY2026 net margin is 4.08%, FY2027 net income of USD 1,063,800 is a 4.92% margin, and FY2029 net income of USD 1,560,151 is a 6.35% margin. Net income here is an accounting profit, not cash flow, because capital spending and debt repayment sit outside the P&L, which is why a cash flow projection is still needed in a three statement model.
Stress the projection with a downside scenario
In this example, the downside volume is flat in FY2027 and grows 1.0% and 2.0% afterward, price rises 2.0% a year, and gross margin falls to 43.5%, 43.5% and 44.0%. Cost drivers match the base case.
FY2027 revenue falls to USD 20,400,000 and EBITDA to USD 1,820,200, so net income is USD 474,525, a 2.33% net margin. FY2028 net income falls to USD 377,788, the lowest year. By FY2029 downside net income is USD 417,553, a 1.91% margin, against USD 1,560,151 in the base case, a gap of USD 1,142,598. Cumulative net income for FY2027 to FY2029 is USD 3,955,095 in the base case and USD 1,269,866 in the downside case, a shortfall of USD 2,685,229.
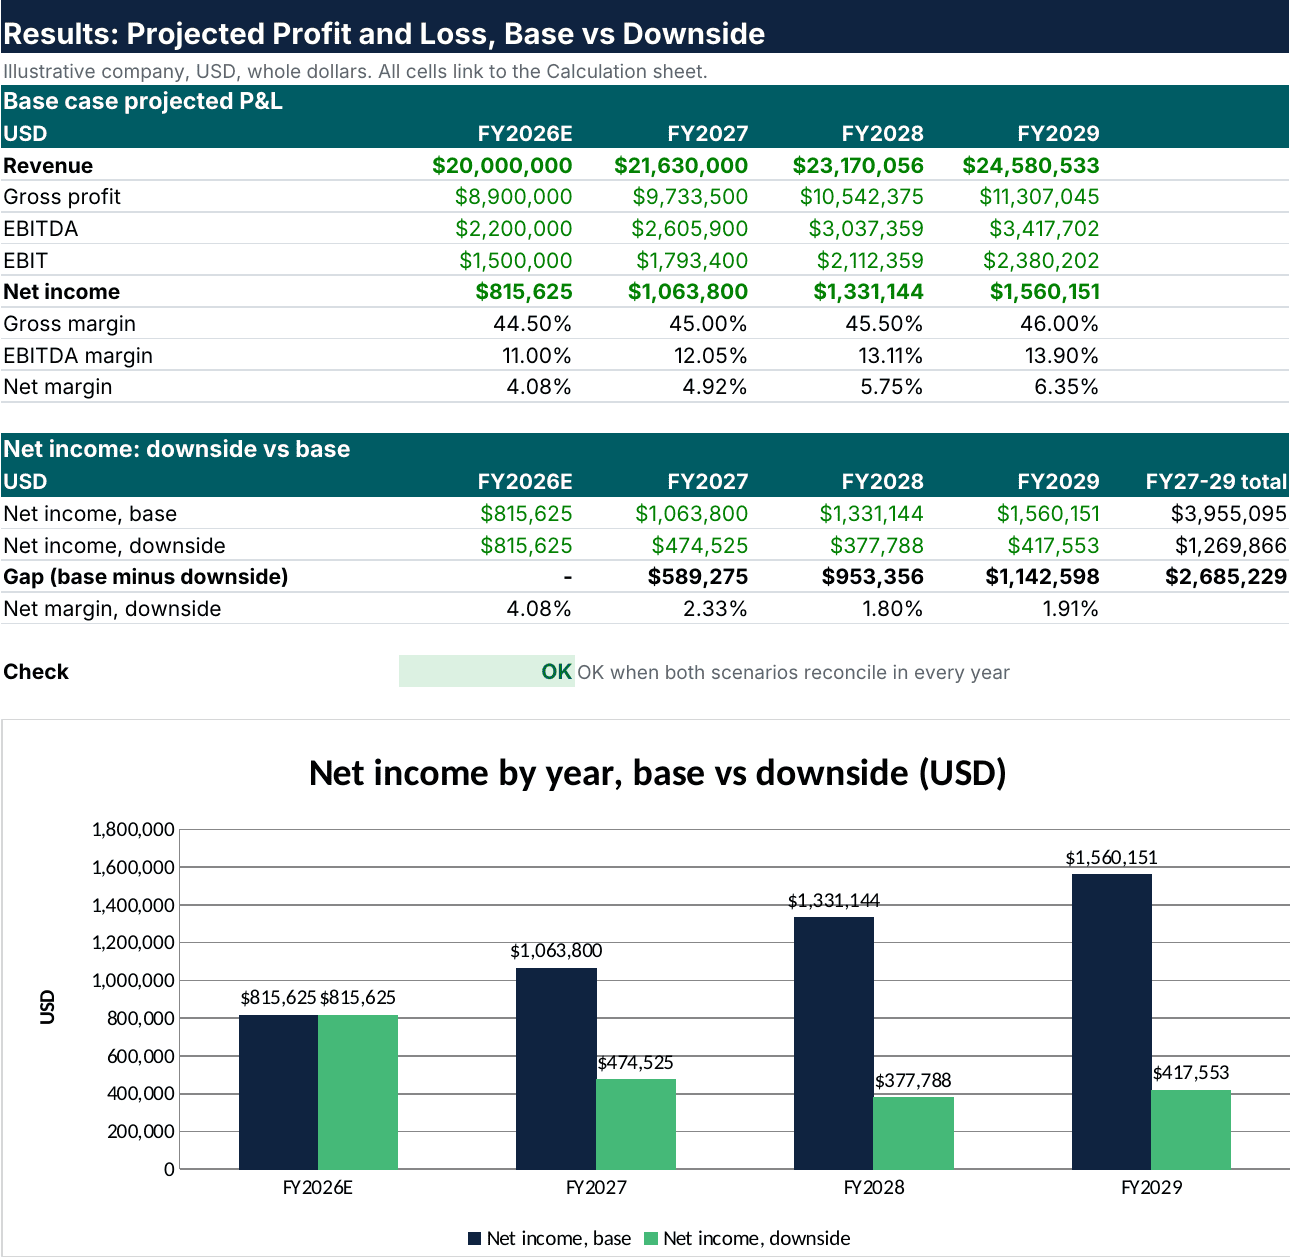
Results sheet: the summary statement, the downside gap and the model check. Source: eFinancialModels Analysis
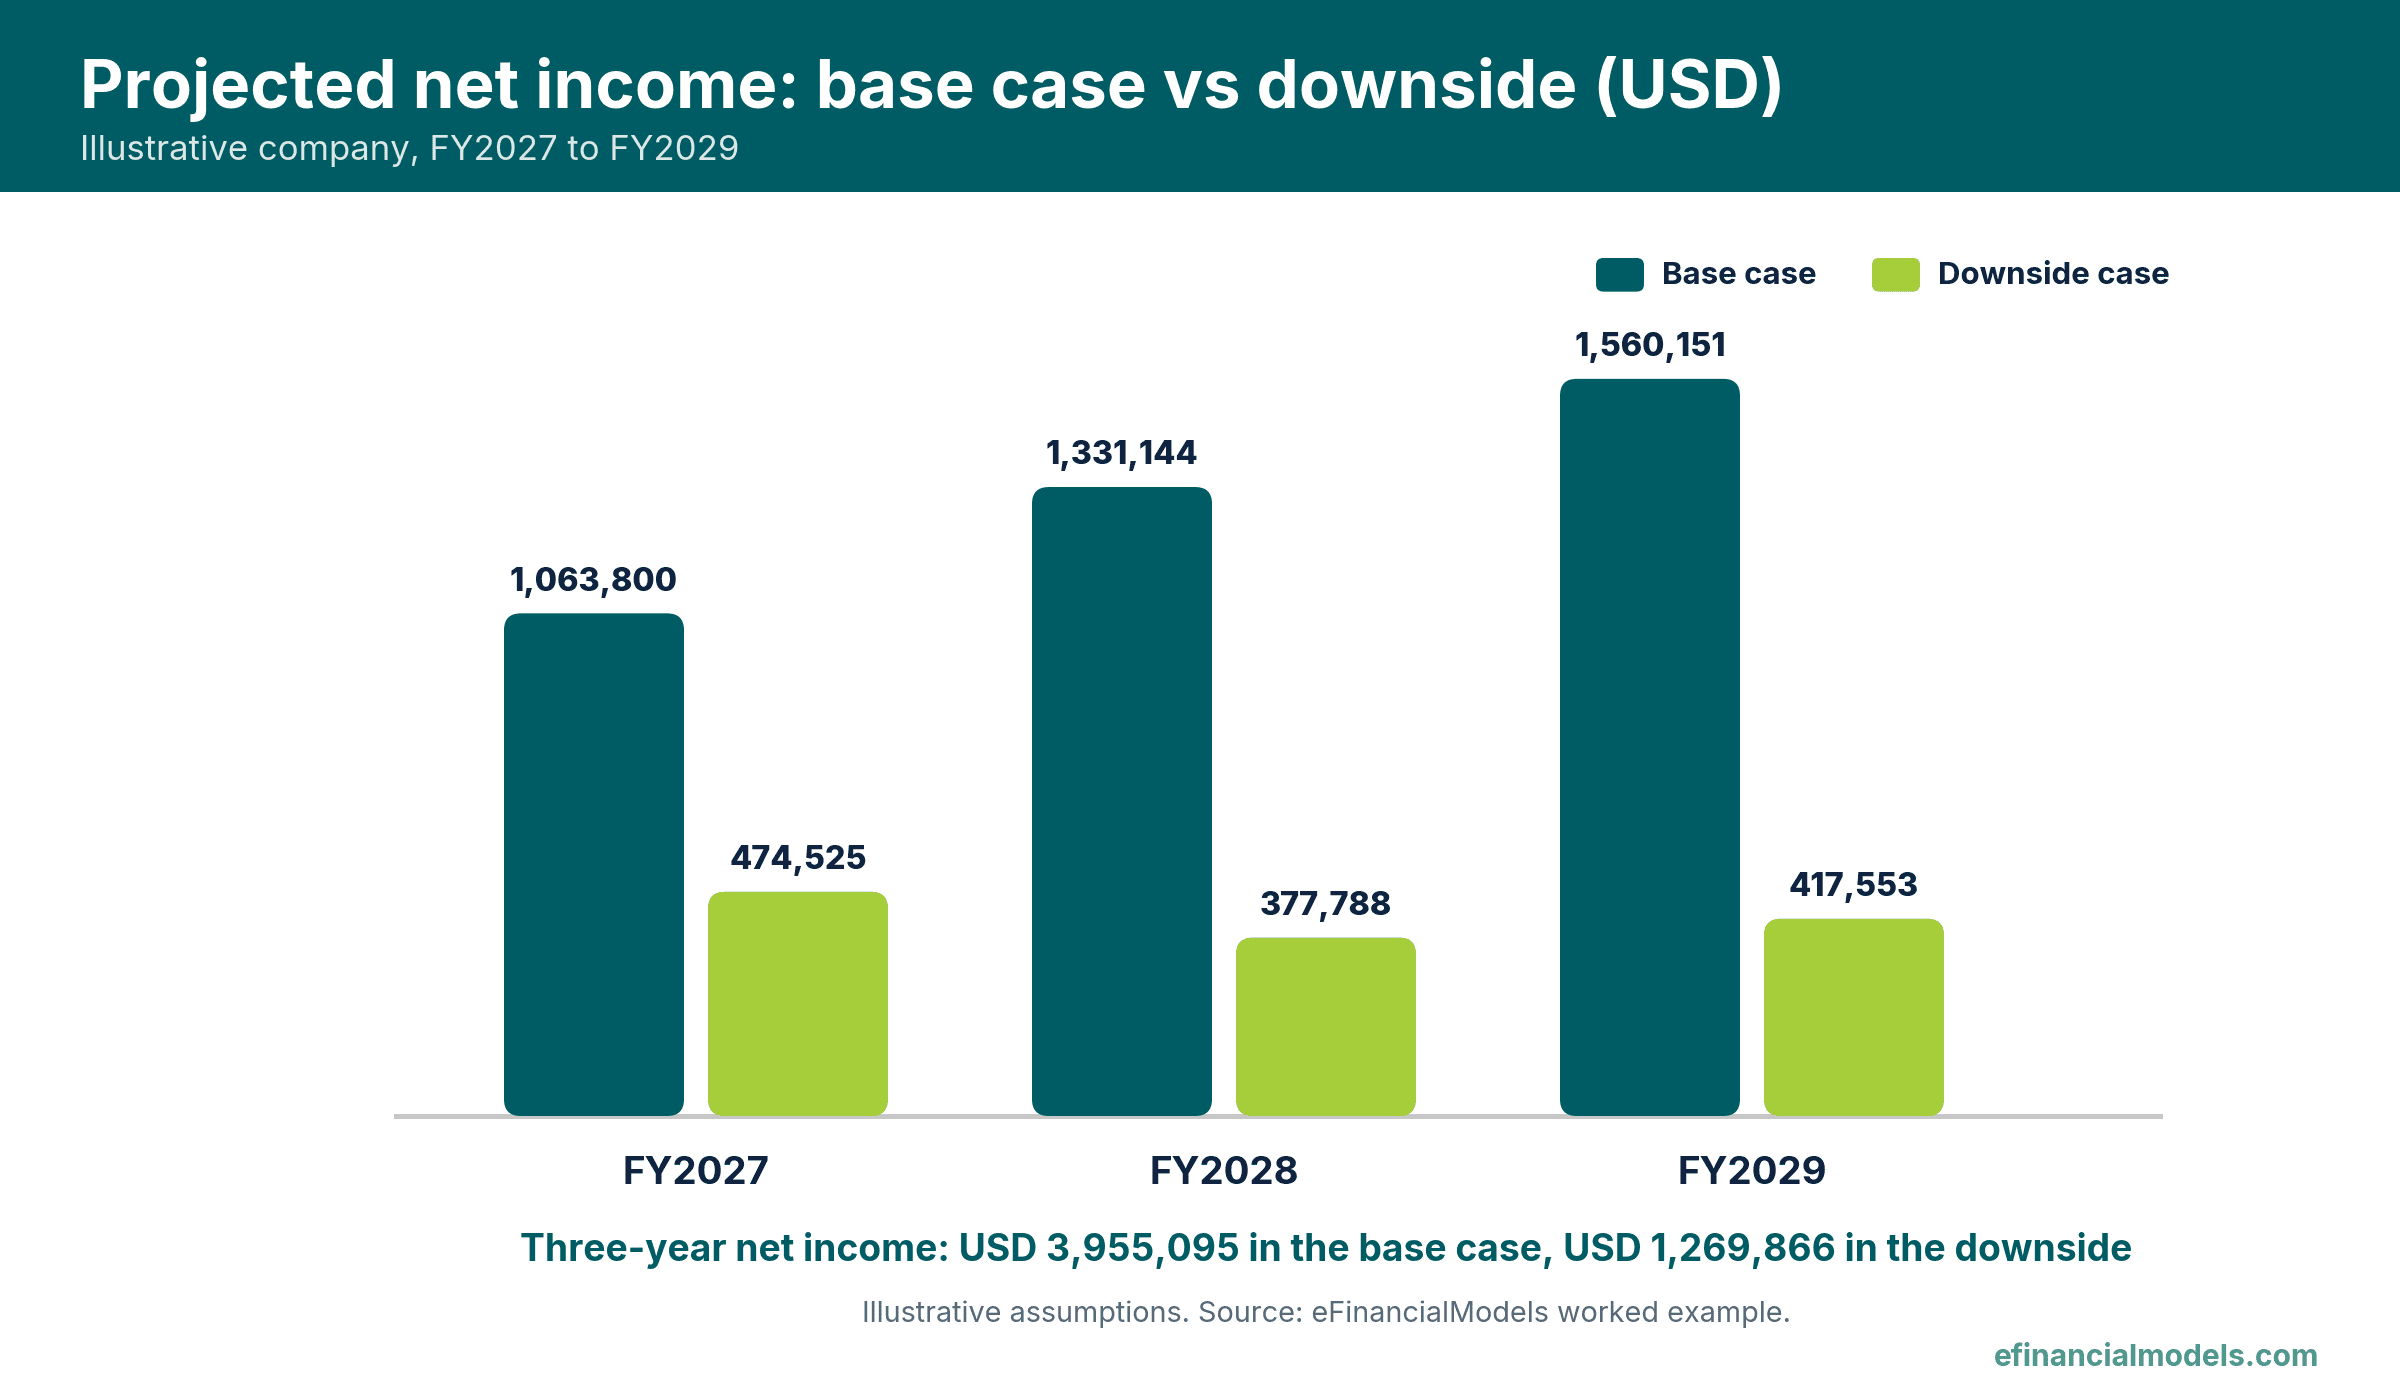
Downside net income stays near USD 0.4 million while the base case climbs.
The 2026 Association for Financial Professionals (AFP) financial planning and analysis (FP&A) Benchmarking Survey of 332 corporate finance practitioners, fielded in August and September 2025, found that only 43% of organizations use rolling forecasts and only 38% use structured scenario planning (AFP, 2026 FP&A Benchmarking Survey release, January 2026).
Match the projection to its readers: board, lender, auditor and tax adviser
A CFO shows one projected P&L to several readers. The board tests the drivers. A lender reads the interest line and debt repayment, and the credit agreement defines which covenant ratios apply. An auditor decides whether any assurance applies to prospective statements, and a tax adviser confirms the effective tax rate. This guide settles none of those three judgments (covenant ratios, audit assurance and the effective tax rate), so each adviser should review the projection first.
Frequently Asked Questions
What is the difference between a projected P&L, a budget and a rolling forecast?
A budget is a target the organization commits to for a fixed period, usually the next financial year, and managers are measured against it. A projected P&L is the statement format that holds any set of future assumptions, so a budget, a forecast or a scenario can each be expressed as one. A rolling forecast adds a new future period as each one closes, keeping the horizon constant instead of letting it shrink.
How many years should a projected profit and loss cover?
The horizon depends on the decision. Operating control usually needs the current year by month, while a lender, investor or strategic plan often needs three to five annual periods. Longer horizons add uncertainty without adding precision, so monthly detail for the first year and annual columns afterward is a common compromise. The example above uses three annual columns because the question was whether profit holds up under a weaker market.
Does a projected profit and loss replace the balance sheet and cash flow projections?
No. The P&L shows accounting profit, and it ignores capital spending, loan repayment, tax timing and the cash tied up in stock and receivables. A company can show rising net income while cash falls. A full model links the P&L to a projected balance sheet and cash flow statement so that financing needs show up before a lender or the bank balance reveals them.
How can a CFO check that a projected P&L is correct?
Start with structural tests: the base year must tie to the ledger, every projected line must be a formula, and a reconciliation cell must confirm that revenue less every cost equals net income. Next, compare margins with history and with an outside benchmark, and ask why any gap exists. Finally, flip each driver by a small amount and confirm that profit moves in the expected direction and size.
Conclusion
A projected P&L is only as reliable as its drivers, and the downside case in the worked example shows how far profit can move when volume, price and margin weaken together. Finance teams that want the projected P&L linked to a balance sheet and cash flow statement can start from the eFinancialModels Free Three Statement Financial Model, a free three statement template.