
0 ITEMS

Food And Drink Marketplace Financial Model Excel Template
The Food and Drink Marketplace Financial Model helps founders, entrepreneurs, consultants, analysts, and business planners turn a marketplace concept into a structured five-year financial forecast. Built for a multi-vendor food and beverage platform, it gives users a ready-to-use framework for estimating revenue potential, startup costs, operating expenses, payroll, cash flow, profitability, and funding needs. Instead of starting with a blank spreadsheet, users can work from a model designed around marketplace economics, including transaction commissions, subscriptions, seller services, customer acquisition, payment processing, and platform operating costs. This template is useful for anyone preparing a business plan, investor deck, loan application, internal budget, or strategic growth plan for a food and drink marketplace. It allows users to document their assumptions clearly, test different revenue assumptions, adjust seller and buyer acquisition plans, update pricing, estimate staffing needs, and evaluate how operational decisions affect financial results. The model connects the main drivers of the business, such as order volume, take rates, subscription pricing, seller mix, buyer growth, marketing spend, and overhead, so users can understand the financial impact of their strategy before committing capital. The Food and Drink Marketplace Financial Model includes integrated projections for income, cash flow, balance sheet movement, break-even analysis, payback period, IRR, and return metrics. It helps users identify how much capital may be required at launch, when the business may become profitable, how long negative cash flow may continue, and what financial milestones need to be reached to support sustainable growth. This makes it especially valuable for fundraising conversations, lender presentations, board discussions, and practical decision-making during launch or expansion. Fully editable and compatible with Microsoft Excel and Google Sheets, the template is designed for customization. Users can replace the pre-filled assumptions with their own marketplace data, local pricing, staffing plans, marketing budgets, and cost structure. Whether you are launching a local food marketplace, a specialty beverage platform, a restaurant vendor network, a home baker marketplace, or a broader food tech venture, this model provides a professional planning tool for building a credible forecast, reviewing profitability, managing cash flow, and presenting your financial story with confidence.
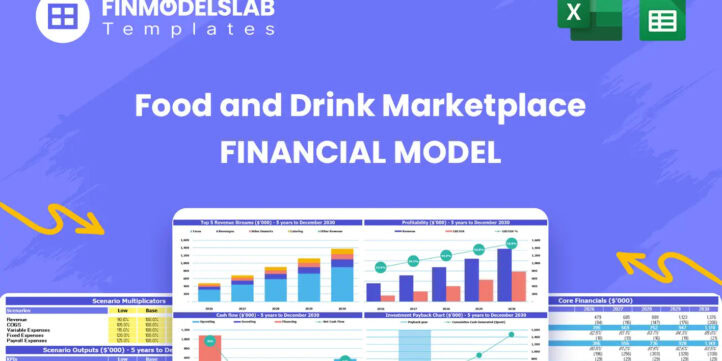


Financial Model Overview
The Food and Drink Marketplace Financial Model is a ready-to-use financial model template designed to help entrepreneurs, founders, analysts, consultants, and business owners plan the launch or growth of a multi-vendor food and beverage marketplace. A food and drink marketplace typically depends on several connected revenue streams, including transaction commissions, seller subscriptions, buyer subscriptions, promoted listings, premium seller tools, and other platform services. At the same time, it must manage customer acquisition costs, seller onboarding costs, payment processing fees, platform development, technology infrastructure, staffing, marketing, and ongoing operating expenses. This template brings those moving parts into one structured forecast so users can estimate revenue, costs, cash flow, profitability, startup investment, break-even timing, and investor returns over a five-year period. It is built to support business planning, funding preparation, loan applications, internal budgeting, and investor presentations, while remaining fully editable so users can adapt the assumptions to their own marketplace concept, geography, pricing strategy, and growth plan.
All-in-One Dashboard
The all-in-one dashboard gives users a centralized view of the most important inputs and outputs in the Food and Drink Marketplace Financial Model. Instead of moving through multiple tabs to understand the forecast, users can review key assumptions and high-level financial results in one place, including revenue growth, profitability, cash flow, funding needs, break-even timing, payback period, IRR, and major operating metrics. The dashboard is especially useful for founders and decision-makers because it connects the core assumptions of the marketplace, such as seller growth, buyer growth, order volume, commission rates, subscription pricing, marketing spend, payroll, and operating costs, with the resulting financial outcomes. By adjusting inputs and reviewing the dashboard, users can quickly see how a change in pricing, customer acquisition cost, order frequency, or staffing affects the overall financial plan. This makes the dashboard practical for monthly review meetings, investor discussions, internal planning sessions, and strategic decision-making because it summarizes the financial health of the food and drink marketplace in a format that is easy to understand and present.
Low, Base, and High Scenario Analysis
The low, base, and high scenario analysis component helps users test how the food and drink marketplace may perform under different business conditions. A marketplace forecast can change significantly depending on buyer adoption, seller acquisition, marketing efficiency, order frequency, average order value, subscription conversion, and platform service revenue. This section allows users to compare conservative, expected, and optimistic outcomes without rebuilding the financial model from scratch. Inputs may include different growth rates, customer acquisition costs, commission take rates, subscription pricing, transaction volume, operating expenses, staffing plans, and launch timelines. The outputs help show how each scenario affects revenue, EBITDA, net income, cash balance, funding requirements, return metrics, and break-even timing. This is useful for planning because it helps users understand the range of possible outcomes rather than relying on a single forecast. It also supports funding conversations by showing investors and lenders that the business owner has considered downside risk, expected performance, and upside potential. For a food and drink marketplace, where network effects and marketing efficiency can strongly influence results, scenario analysis is an important tool for making more resilient plans.
Professional Charts
The professional charts component converts the financial forecast into clear visual outputs that are useful for presentations, planning documents, and stakeholder updates. A food and drink marketplace can involve complex assumptions across sellers, buyers, transactions, subscriptions, platform fees, payroll, marketing, and operating expenses, and charts help simplify those details into a more digestible story. This component may include visual summaries of revenue growth, gross profit, EBITDA, net profit, cash balance, monthly cash flow, revenue mix, customer acquisition trends, and key performance indicators. The inputs come from the underlying financial model, so when the user updates assumptions such as order volume, take rate, seller subscriptions, marketing spend, or payroll, the related charts update automatically. These outputs are valuable for investor decks, lender discussions, board reports, and internal meetings because they help communicate trends and financial milestones more effectively than raw spreadsheet numbers alone. For users preparing a business plan or funding document, the chart section provides a polished way to demonstrate how the marketplace is expected to scale, when profitability improves, and how cash flow develops over time.
ROE Components and DuPont Analysis
The ROE components and DuPont analysis section helps users understand the drivers behind return on equity and overall financial performance. Rather than showing only a final return figure, this component breaks performance into underlying elements such as profitability, asset efficiency, and leverage, helping users see why the business generates a certain level of return. For a food and drink marketplace, this can be valuable because the company may have significant early investment in platform development, marketing, seller onboarding, compliance, infrastructure, and team building before reaching scale. Inputs may include projected net income, revenue, assets, equity, liabilities, working capital, and balance sheet assumptions. The outputs can help users evaluate how changes in margins, operating leverage, cash requirements, funding structure, or asset utilization influence return on equity over time. This section is useful for founders, financial analysts, and investors because it goes beyond basic revenue and profit forecasting to show the quality of financial performance. It also supports strategic planning by helping users identify whether return improvements are coming from stronger margins, better capital efficiency, or increased leverage, which can lead to more informed decisions about pricing, cost control, investment, and financing.
Revenue Inputs
The revenue inputs section is where users define the main commercial assumptions that drive the Food and Drink Marketplace Financial Model. A food and drink marketplace may generate income from commissions on transactions, fixed fees per order, seller subscriptions, buyer subscriptions, promoted listings, advertising, premium analytics, delivery tools, or other seller services. This component allows users to enter assumptions such as commission rate, fixed transaction fee, average order value, number of sellers, number of buyers, order frequency, seller category mix, subscription pricing, conversion rates, churn, and the adoption of paid features. Because marketplace revenue depends heavily on both sides of the platform, the revenue input section is designed to help users model how sellers and buyers grow together over time. The outputs from these assumptions flow into revenue forecasts, gross profit calculations, cash flow projections, profitability analysis, and valuation-related metrics. This section is especially useful because it lets users test whether the marketplace can generate enough revenue to support customer acquisition, platform costs, payroll, and growth investment. It also helps users explain their business model clearly when preparing a plan for investors, lenders, or internal stakeholders.
Bank-Ready Reports
The bank-ready reports component organizes the financial outputs in a format that can support loan applications, lender conversations, and formal business planning. Lenders typically want to see clear financial statements, transparent assumptions, cash flow coverage, startup funding needs, profitability expectations, and the ability of the business to manage debt or operating obligations. This section may include projected income statements, cash flow statements, balance sheets, annual summaries, monthly forecasts, funding requirements, repayment capacity indicators, and key financial metrics. Inputs come from the full model, including revenue assumptions, payroll, operating expenses, startup costs, debt or equity funding, tax assumptions, and working capital movements. The outputs help present the food and drink marketplace as a structured financial plan rather than an informal idea. For a business seeking bank financing, this section is useful because it demonstrates how the requested capital may be used, when revenue is expected to grow, how expenses are managed, and whether cash flow can support the business during the launch and scaling period. It also helps founders prepare for lender questions with organized, consistent financial information.
Revenue Breakdown
The revenue breakdown component provides a detailed view of how different income streams contribute to total marketplace revenue. In a food and drink marketplace, it is rarely enough to forecast a single revenue line because commissions, seller subscriptions, buyer memberships, advertising, promoted listings, and value-added seller services may grow at different rates and produce different margins. This section helps users separate each revenue stream so they can understand which channels drive the business model and which assumptions have the greatest financial impact. Inputs may include the number of active sellers by category, buyer segments, subscription prices, order volume, take rates, fixed transaction fees, adoption rates for seller extras, and monthly usage levels. The outputs may show revenue by stream, percentage contribution, growth over time, and total income across monthly and annual periods. This is useful for decision-making because it helps users determine whether the marketplace is overly dependent on one revenue source or whether it has a balanced mix of transaction income and recurring subscription income. It also helps users refine pricing, improve monetization strategy, and communicate the business model more clearly in funding documents.
KPI Dashboard
The KPI dashboard component helps users track operational and financial performance indicators that are especially important for a food and drink marketplace. While financial statements show revenue, expenses, profit, and cash flow, marketplace businesses also need operational metrics to explain how those results are produced. This section may include KPIs such as gross merchandise value, order volume, active sellers, active buyers, average order value, take rate, seller acquisition cost, buyer acquisition cost, subscription conversion, revenue per seller, revenue per buyer, gross margin, EBITDA margin, burn rate, cash runway, and break-even timing. Inputs come from the model’s assumptions and operating forecasts, including pricing, customer acquisition, transaction behavior, seller mix, marketing spend, and cost structure. The outputs help users monitor whether the business is scaling efficiently, whether customer acquisition is improving, whether the platform is gaining enough transaction volume, and whether profitability is moving in the right direction. This component is useful for founders, management teams, and investors because it connects day-to-day marketplace performance with financial outcomes. It also supports ongoing decision-making after launch by giving users a repeatable framework for reviewing monthly progress against the forecast.
Startup Cost Breakdown
The startup cost breakdown component helps users estimate the initial investment required before the food and drink marketplace can operate effectively. Marketplace businesses often require upfront spending on platform development, user interface design, vendor onboarding, payment system integration, hosting infrastructure, security audits, compliance, legal setup, branding, launch marketing, office setup, initial staffing, and working capital reserves. This section allows users to enter one-time launch costs separately from recurring operating expenses, which is important for understanding how much funding is needed before meaningful revenue begins. The outputs may include total startup capital required, category-level cost summaries, pre-opening cash needs, and the funding gap that must be covered by equity, loans, grants, or founder investment. This component is useful for budgeting because it prevents early expenses from being hidden inside monthly operating costs and gives founders a clearer picture of the cash required to reach launch. It also supports investor and lender discussions by showing exactly how initial capital will be allocated. For a food and drink marketplace, where technology, compliance, trust, seller onboarding, and customer acquisition all matter from the beginning, a detailed startup cost plan helps reduce the risk of underfunding the business.
Break-Even Analysis
The break-even analysis component helps users estimate when the Food and Drink Marketplace Financial Model reaches the point where revenue can cover operating costs. This is one of the most important planning outputs for a marketplace because early growth often requires heavy investment in technology, marketing, customer support, seller acquisition, buyer acquisition, and operations before the platform produces positive earnings. Inputs may include fixed costs, variable costs, payment processing fees, commission rates, subscription income, order volume, average order value, gross margin, payroll, marketing expense, and other operating costs. The outputs may show the break-even month, required revenue level, required order volume, cash burn before break-even, and the relationship between scale and profitability. This section is useful for decision-making because it helps users understand what milestones must be achieved to move from launch-stage losses to sustainable operations. It can also help users evaluate whether their pricing strategy, take rate, subscription plan, and cost structure are realistic. For investors and lenders, the break-even analysis provides a clear answer to when the business may become self-sustaining and how much capital may be needed to support operations until that point.
File types:
Excel – Single-User: .xlsx
Excel – Multi-User: .xlsx
Similar ProductsOther customers were also interested in...


 HenrySheykin
Coffee Truck Financial Model Excel Template
The Coffee Truck Financial Model Template helps entrepreneurs, founders, consultants, and business p... Read more
Coffeehouse Financial Model Excel Template
The Coffee Shop Financial Model helps entrepreneurs, founders, business owners, consultants, and ana... Read more

 David
Vending Machine Business 5-Year 3 Statement Financ...
5 year rolling financial projection Excel model for a vending machine business generating revenue by... Read more

 Giorgos
Pizzeria Financial Model – 5 Year Financial Fore...
Financial Model providing advanced financial planning & analysis for a Pizzeria business. Suitab... Read more
 ECF Consultancy
Market Entry Feasibility Study for Coffee Shops In...
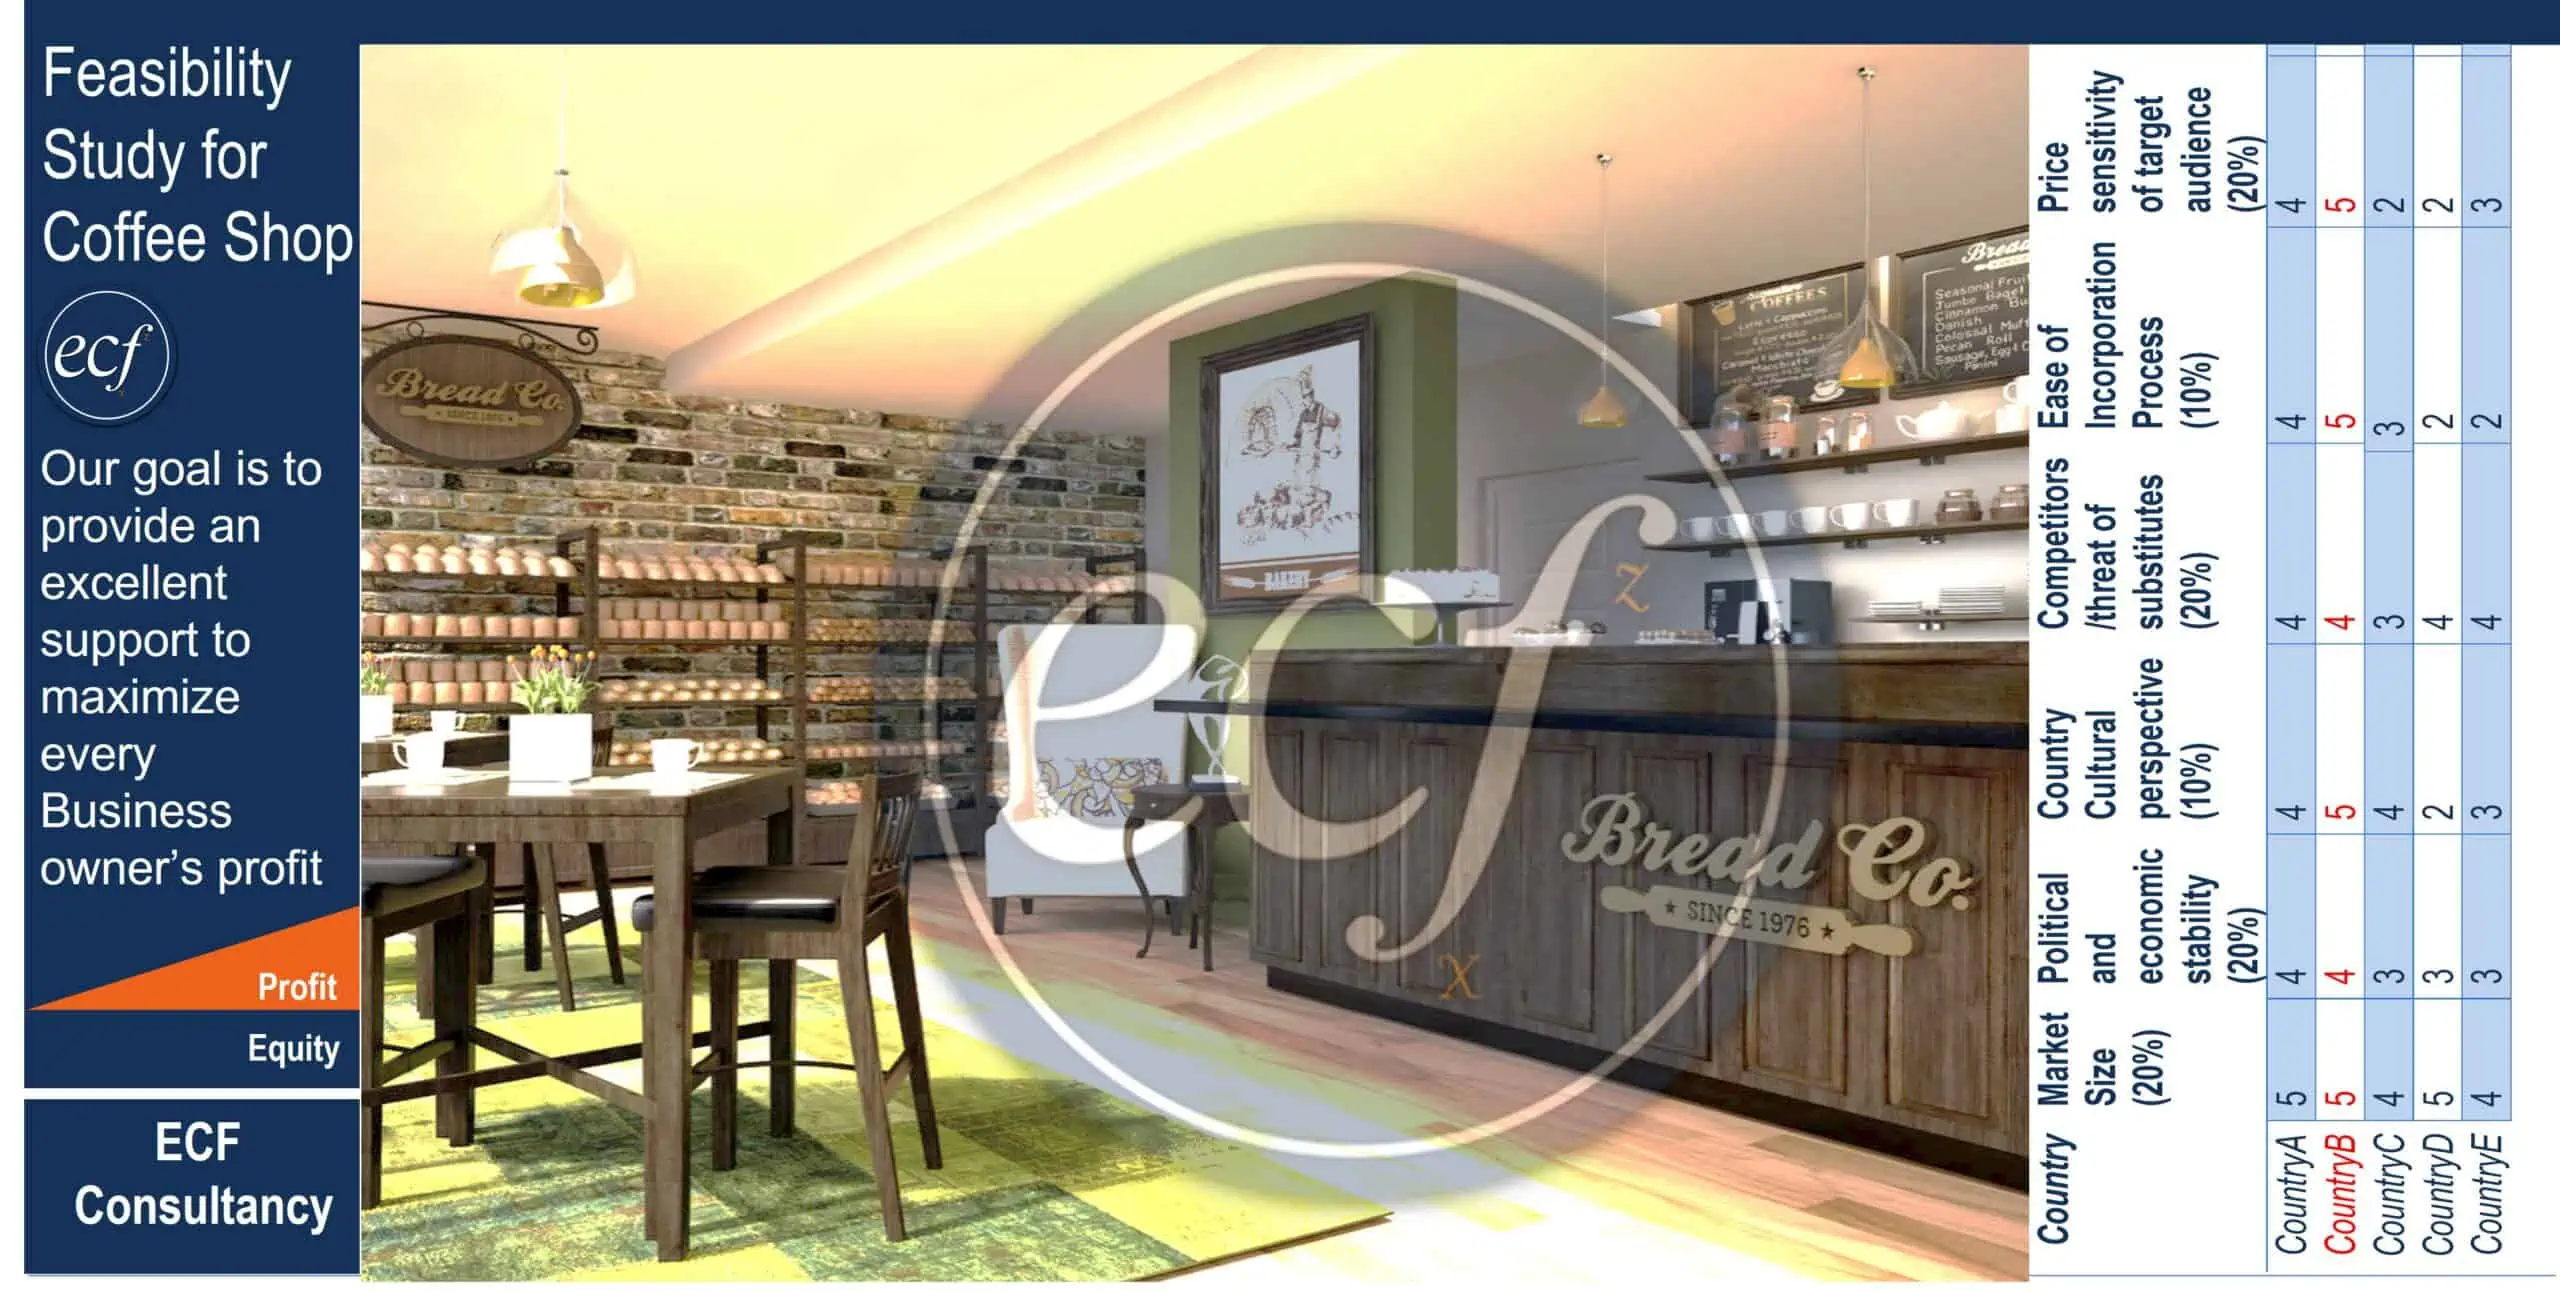
This model include market entry feasibility study in word format and business plan to convert the li... Read more
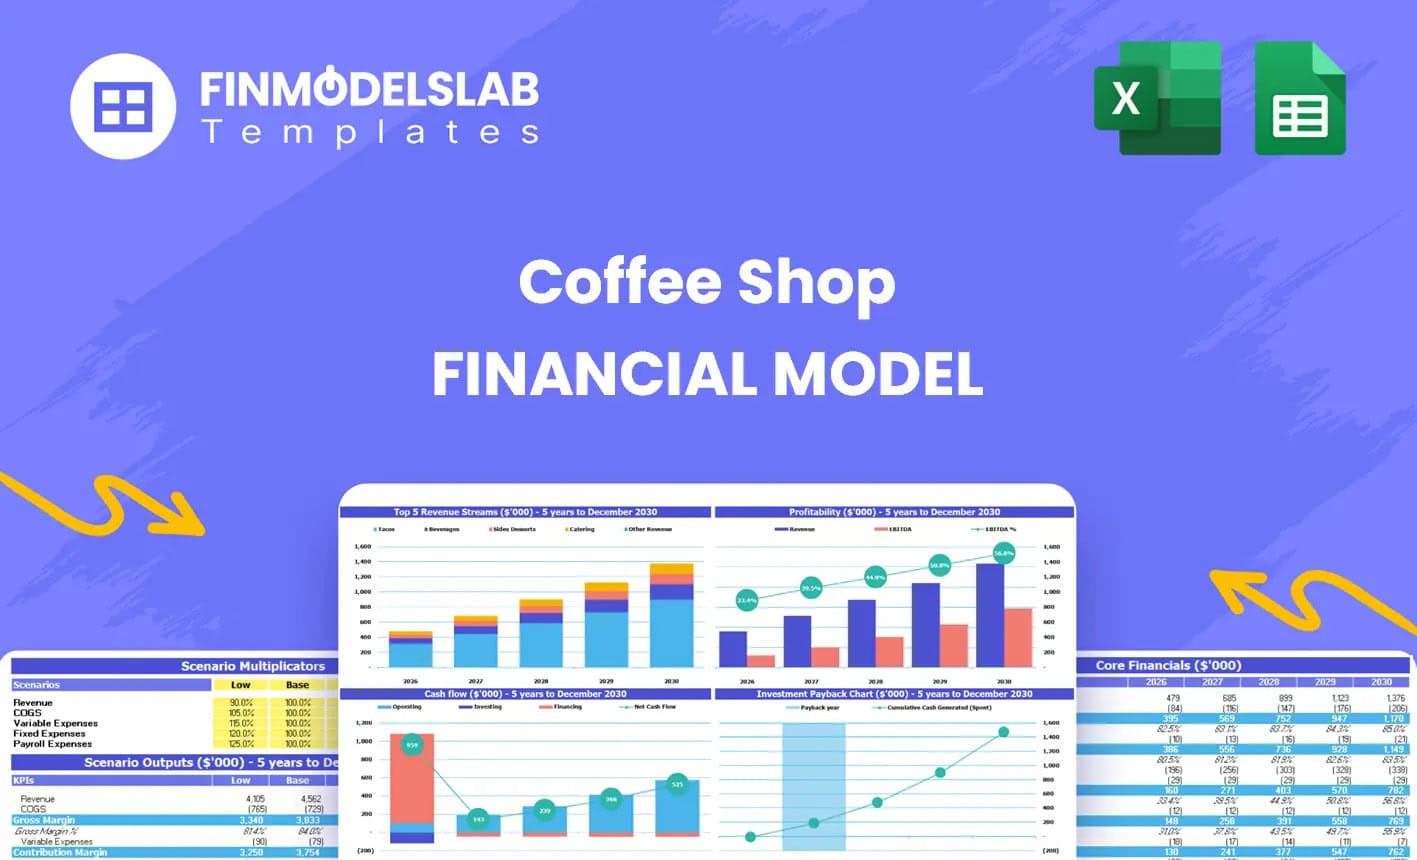
Coffee Shop Financial Model Excel Template
The Coffee Shop Financial Model helps entrepreneurs, founders, business owners, consultants, and ana... Read more
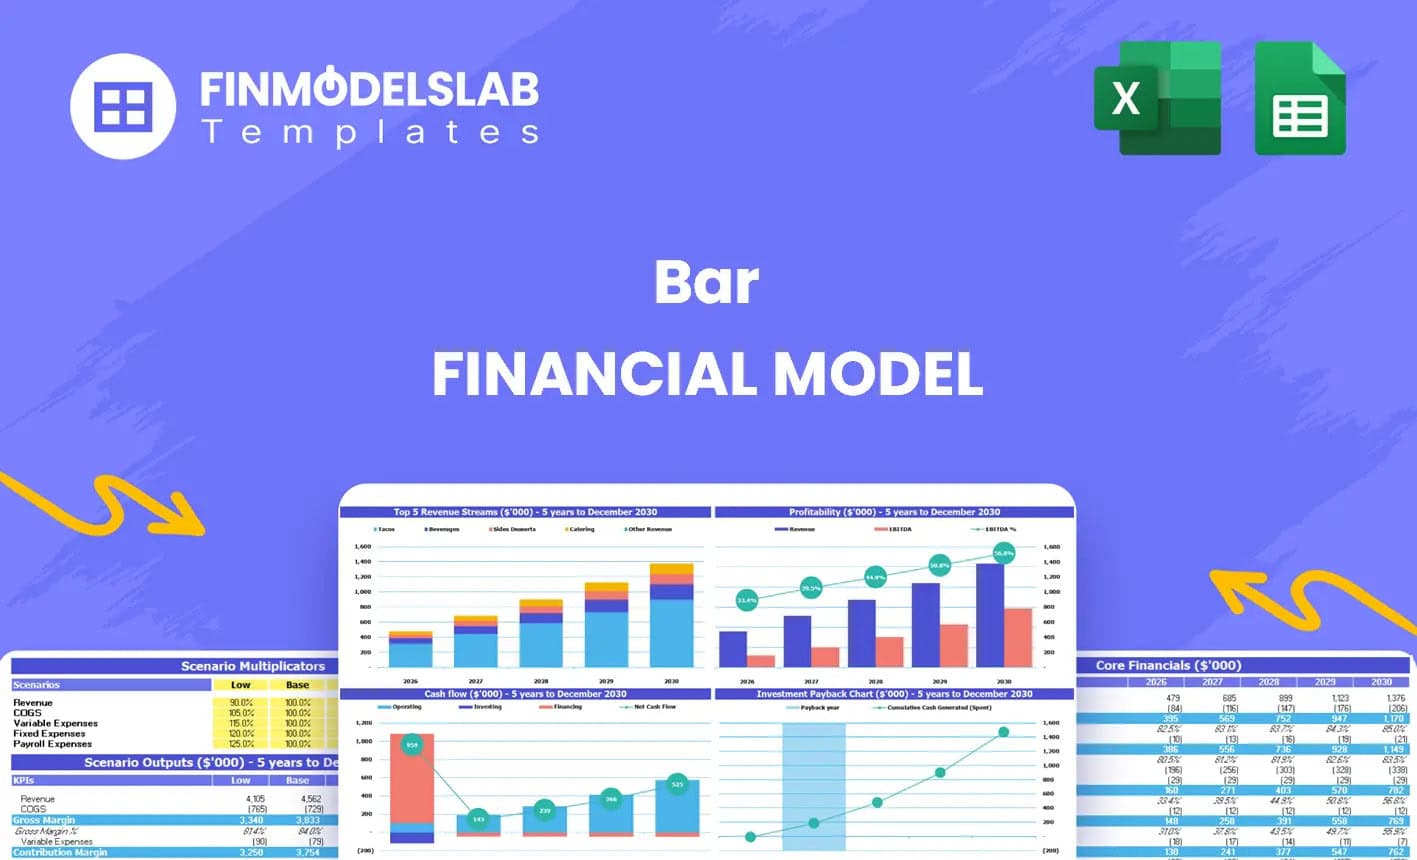
Bar Financial Model Excel Template
The Bar Financial Model Financial Model Template helps entrepreneurs, bar owners, consultants, analy... Read more
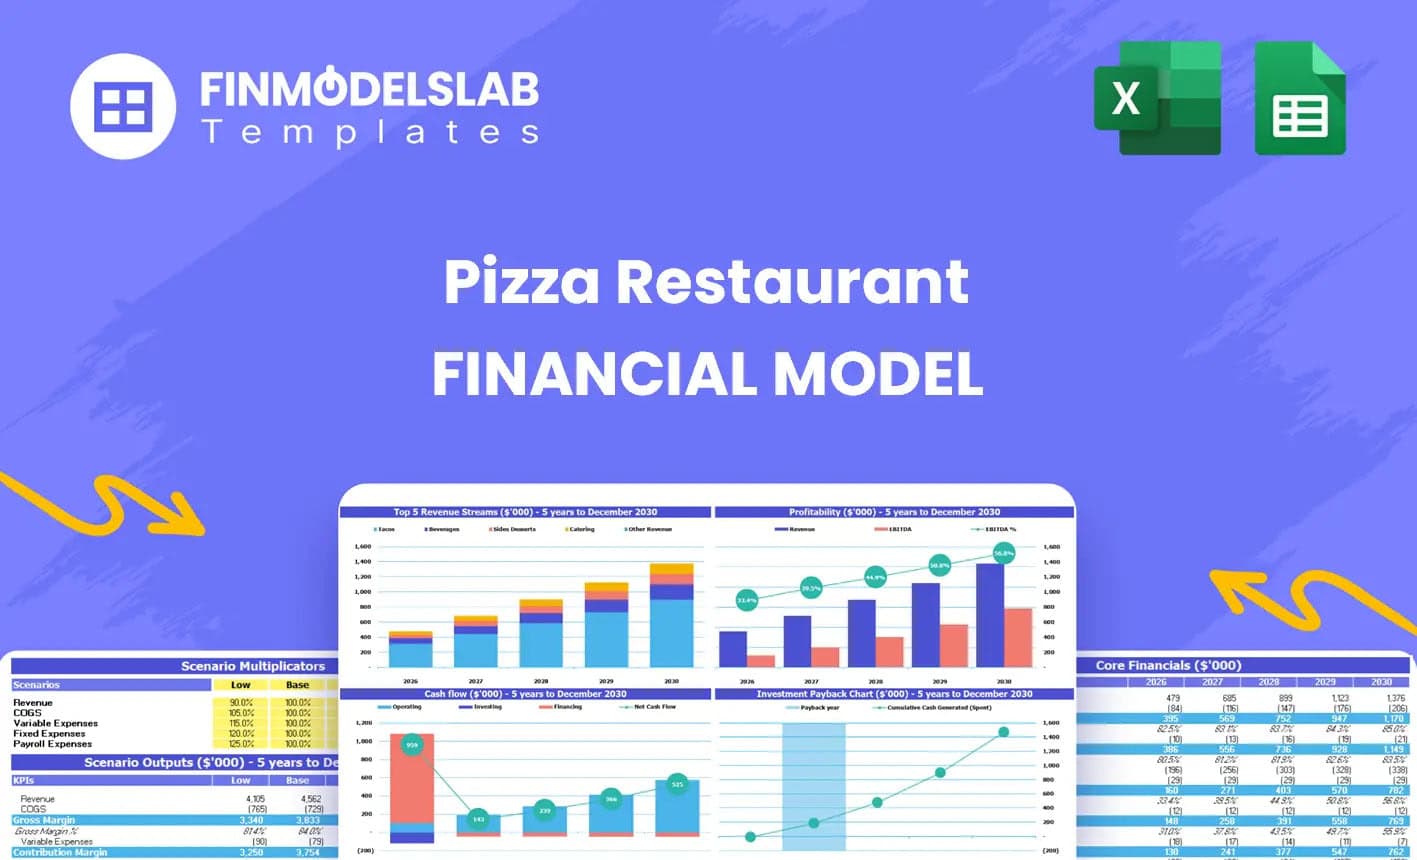
Pizzeria Financial Model Excel Template
The Pizza Restaurant Financial Model Template helps entrepreneurs, restaurant owners, consultants, a... Read more
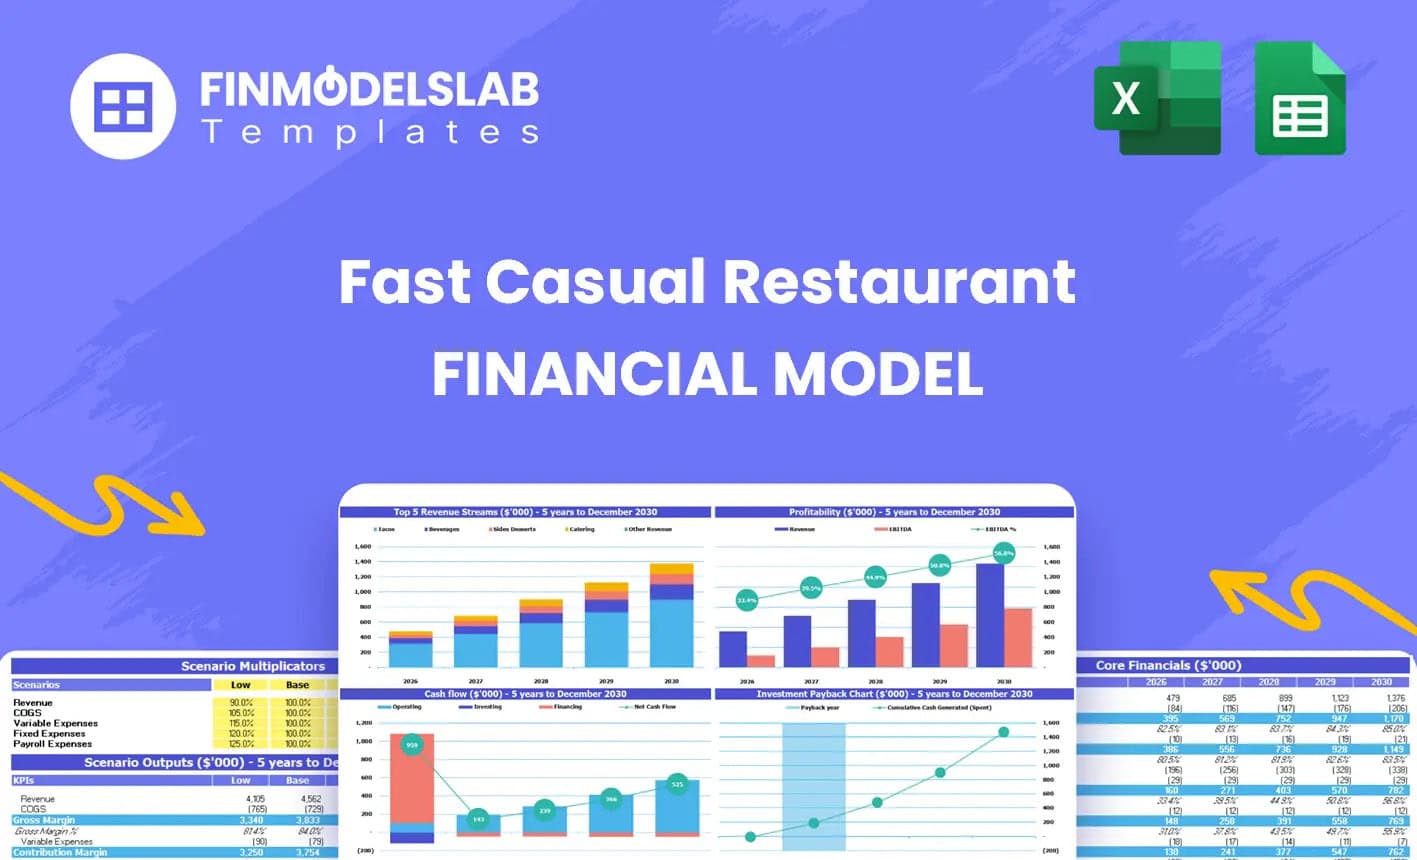
Fast Casual Restaurant Financial Model Excel Templ...
The Fast Casual Restaurant Financial Model helps entrepreneurs, restaurant owners, consultants, anal... Read more

Food Truck Financial Model Excel Template
The Food Truck Financial Model helps entrepreneurs, founders, business owners, consultants, and anal... Read more
You must log in to submit a review.