
0 ITEMS

Radiology Center Financial Model Excel Template
The Radiology Center Financial Model helps users turn a diagnostic imaging business plan into a structured, editable financial forecast. Designed around the economics of a radiology center, it gives entrepreneurs, founders, clinic owners, consultants, and analysts a practical way to estimate revenue potential, startup costs, operating expenses, payroll needs, cash flow, profitability, and funding requirements before launch or expansion. Instead of building a model from a blank spreadsheet, users can work from a ready-to-use template with pre-built formulas, clear assumptions, and professional financial outputs. This financial model template is especially useful for planning an imaging facility with services such as MRI scans, CT scans, X-ray imaging, and radiologist interpretations. Users can adjust revenue assumptions such as procedure pricing, monthly capacity, practitioner count, utilization rates, service mix, and reimbursement expectations. These assumptions connect directly to the forecast, helping users understand how patient volume and pricing decisions affect monthly revenue, profit margins, cash flow, and long-term growth. The model also helps organize the significant capital investment often required for a radiology center, including imaging equipment, facility build-out, technology, licenses, and working capital. For funding preparation and lender discussions, the template helps present the numbers investors and banks typically review first, including startup budget, monthly cash flow, profitability outlook, break-even analysis, and return metrics. It supports decision-making by showing whether the business can cover fixed costs, manage payroll, absorb early cash deficits, and scale toward sustainable profitability. Users can test different assumptions, compare scenarios, and evaluate the impact of changes in utilization, reimbursement rates, staffing, and expenses without manually rebuilding calculations. The Radiology Center Financial Model is built for both strategic planning and practical financial management. It can support a business plan, loan application, investor presentation, internal budget, expansion analysis, or feasibility study. With editable fields, five-year projections, visual dashboards, and lender-friendly reports, the template gives users a clearer view of the financial path ahead and helps them make more confident decisions about launching, financing, or growing a radiology center.
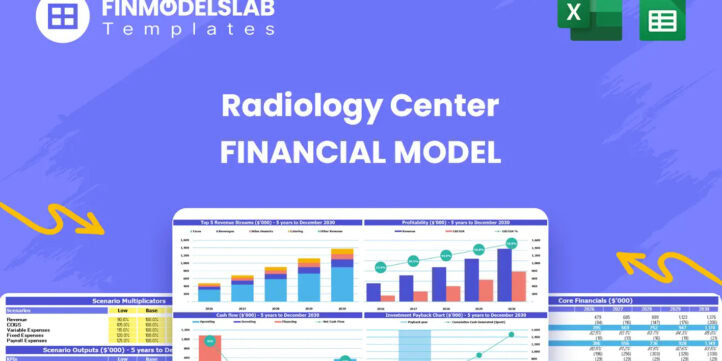


Radiology Center Financial Model Overview
The Radiology Center Financial Model is a ready-to-use financial model template designed to help entrepreneurs, healthcare founders, clinic operators, consultants, analysts, and business plan writers evaluate the financial feasibility of a diagnostic imaging center. A radiology center often requires a large upfront investment in MRI machines, CT scanners, digital X-ray systems, facility build-out, specialized staff, software, insurance, and working capital, so the financial plan needs to be more detailed than a simple revenue and expense estimate. This template brings the key planning areas into one structured workbook, allowing users to enter assumptions for services, pricing, capacity, utilization, staffing, expenses, funding, and growth. It then translates those assumptions into financial outputs that can support budgeting, funding discussions, lender reviews, investor presentations, and internal decision-making. The model is built to help users understand not only whether the radiology center can become profitable, but also how much capital may be required, how monthly cash flow may behave, which services drive revenue, and what operating metrics should be monitored as the center scales.
All-in-One Dashboard
The all-in-one dashboard gives users a central view of the most important inputs and outputs in the Radiology Center Financial Model. This section is designed to reduce the time spent navigating separate worksheets by summarizing key assumptions, forecast results, financial metrics, and business performance indicators in one place. Users can review core drivers such as service volume, utilization, pricing, revenue growth, operating expenses, EBITDA, net income, cash flow, and funding needs without manually pulling data from different parts of the model. For a radiology center, this is especially useful because the business depends on multiple moving parts, including equipment capacity, referring physician demand, insurance reimbursement, technician staffing, radiologist interpretation volume, and fixed facility costs. The dashboard helps users quickly see whether the plan is financially balanced, whether revenue is growing fast enough to support the cost structure, and whether the business is likely to maintain sufficient liquidity during the early months. It also helps founders and consultants communicate the overall financial story to lenders, investors, partners, or internal stakeholders in a clear and organized format.
Low, Base, and High Scenario Analysis
The low, base, and high scenario analysis component helps users test how the radiology center may perform under different business conditions. Instead of relying on a single forecast, users can compare conservative, expected, and optimistic cases by adjusting important drivers such as scan volume, utilization rate, reimbursement rates, procedure pricing, operating expenses, staffing levels, and growth speed. The low case can be used to understand the impact of slower patient acquisition, lower referral volume, delayed insurance payments, or higher operating costs. The base case can represent the most realistic operating plan based on current assumptions and market research. The high case can show the upside if utilization improves faster, service pricing is stronger, or marketing and referral partnerships generate higher patient throughput. This section is valuable for risk assessment because radiology centers carry significant fixed costs and major equipment investment, so small changes in volume or reimbursement can have a meaningful effect on cash flow and profitability. Scenario analysis allows users to prepare more resilient funding plans, set realistic targets, and make better decisions before committing capital.
Professional Charts and Visual Reports
The professional charts and visual reports component turns the financial forecast into clear, presentation-ready visuals that help users explain the business plan more effectively. Financial models can contain many rows of assumptions and calculations, but lenders, investors, partners, and management teams often need a faster way to understand the trend behind the numbers. This section may visualize revenue growth, gross profit, EBITDA, net income, cash flow, expense categories, service mix, investment requirements, and key return metrics over the forecast period. For a radiology center, charts can make it easier to show how revenue ramps up as utilization increases, how fixed costs are absorbed over time, and how profitability improves once equipment and staff capacity are used more efficiently. These visual outputs are useful for business plan presentations, funding meetings, board updates, and internal reviews because they simplify complex financial information without removing the underlying detail. By presenting financial performance in graphs and summaries, the model helps users identify trends, compare periods, explain assumptions, and communicate the center’s financial potential in a polished and professional way.
ROE Components and DuPont Analysis
The ROE components and DuPont analysis section helps users understand what is driving return on equity and how efficiently the radiology center uses invested capital. Return on equity can be an important investor metric, especially for a healthcare business that requires a substantial upfront commitment for equipment, leasehold improvements, technology, and operating reserves. Rather than showing ROE as a single number, the DuPont framework breaks it into underlying drivers such as profitability, asset efficiency, and financial leverage. This helps users see whether returns are being created through strong margins, efficient use of assets, appropriate financing structure, or a combination of these factors. In a radiology center, asset utilization is particularly important because expensive imaging machines need enough scan volume to justify their cost. The section can help users evaluate whether MRI, CT, and X-ray assets are producing enough revenue relative to the capital invested. It also supports investor conversations by showing how operational improvements, better reimbursement rates, cost control, and higher utilization can improve equity returns over time. This makes the model useful not only for startup planning, but also for performance management after launch.
Revenue Inputs and Assumption Builder
The revenue inputs and assumption builder is where users define the commercial engine of the radiology center. This component allows users to enter the assumptions that determine how the business makes money, including service categories, procedure pricing, monthly treatment or scan capacity, number of practitioners or technologists, utilization rates, patient volume growth, and reimbursement expectations. Typical revenue streams may include MRI scans, CT scans, X-ray imaging, ultrasound if added by the user, and radiologist interpretations. For example, users can model how many scans each technologist or machine can support per month, what percentage of capacity is expected to be used, and what average revenue is generated per procedure. The model then converts these assumptions into monthly and annual revenue forecasts. This section is useful because radiology center revenue is highly sensitive to utilization and service mix. A center with strong MRI utilization may produce very different margins than one relying heavily on lower-priced imaging services. By making the inputs editable, the template allows users to match the forecast to their local market, payer mix, physician referral network, equipment plan, and growth strategy.
Bank-Ready Financial Reports
The bank-ready financial reports section organizes the model’s outputs into a format that is useful for lenders, investors, and other financing partners. A lender typically wants to understand the startup budget, funding requirement, monthly cash flow, debt service capacity, revenue forecast, profitability outlook, and whether the business can withstand early operating pressure. This component provides structured financial statements and summaries that can support those discussions, including projected profit and loss, cash flow forecast, balance sheet view, EBITDA, margins, and other financial metrics. For a radiology center, lender-friendly reporting is especially important because the business may require financing for high-cost medical imaging equipment, facility construction, software systems, working capital, and pre-opening expenses. The reports help show how the borrowed or invested funds will be used, when revenue is expected to ramp up, and how the center plans to cover operating expenses and repayments. Because the outputs are linked to the user’s assumptions, changes to pricing, staffing, utilization, financing, or cost structure automatically flow into the reports, saving time and improving consistency across business planning documents.
Revenue Breakdown by Service Line
The revenue breakdown by service line component gives users a detailed view of how each imaging and interpretation service contributes to total revenue. Instead of showing only one combined sales figure, this section separates income sources such as MRI scans, CT scans, X-ray imaging, radiologist interpretations, and any additional services the user chooses to include. Users can compare the volume, pricing, utilization, growth, and revenue contribution of each service line over time. This is useful because not all radiology services have the same equipment cost, reimbursement level, staffing requirement, throughput capacity, or profit margin. MRI services may generate higher revenue per scan but require major capital investment, while X-ray services may have different volume and cost dynamics. Radiologist interpretations may scale differently from facility-based imaging procedures. By breaking revenue into detailed streams, the model helps users understand which services are likely to drive growth, where capacity constraints may appear, and which offerings deserve more marketing or operational focus. This component also supports better pricing decisions, payer negotiations, resource planning, and strategic expansion decisions.
KPI Dashboard and Benchmark Tracking
The KPI dashboard and benchmark tracking section helps users monitor the operational and financial indicators that matter most for a radiology center. Key performance indicators may include monthly scans, utilization rate, revenue per scan, revenue per modality, gross margin, EBITDA margin, payroll as a percentage of revenue, operating expense ratios, cash balance, break-even progress, return on equity, and payback period. The value of this component is that it connects day-to-day business drivers with financial outcomes. For example, if utilization is below target, the dashboard can help users see the effect on revenue, cash flow, and profitability. If payroll or consumable costs are rising faster than expected, the KPI view can highlight pressure on margins. Benchmarks can also help users compare planned performance against researched assumptions or industry expectations, making the forecast more credible for funding and internal planning. This section is useful for founders who need a simple management view, consultants preparing an investor-ready plan, and existing operators who want to track whether the center is performing according to the forecast. It turns the model from a static projection into a practical performance management tool.
Startup Cost and Funding Plan
The startup cost and funding plan component helps users estimate the capital required to open or expand a radiology center before revenue fully stabilizes. This section may include major medical imaging equipment such as MRI machines, CT scanners, digital X-ray systems, imaging software, PACS and RIS systems, furniture, leasehold improvements, facility build-out, shielding, installation, licensing, deposits, insurance, legal and professional fees, initial marketing, recruitment, training, and working capital reserves. Because radiology centers often require a significant upfront investment, this component helps users create a clear and itemized startup budget rather than relying on a broad estimate. It can also help distinguish between one-time capital expenditures and recurring operating costs, which is important for lender reviews and cash flow planning. The funding plan can show how much capital may come from owner investment, bank loans, equipment financing, leasing, investor equity, or other sources. By connecting startup costs with the cash flow forecast, the model helps users understand whether the business is sufficiently funded through launch, ramp-up, and early operations. This is essential for avoiding undercapitalization and preparing a more credible funding request.
Break-Even Analysis
The break-even analysis component helps users identify when the radiology center may become profitable and what level of revenue or procedure volume is needed to cover its cost structure. This section evaluates the relationship between fixed costs, variable costs, pricing, service volume, gross margin, and operating expenses. For a radiology center, fixed costs can be substantial because rent, equipment financing, salaries, software, insurance, compliance, and administrative overhead may continue regardless of monthly scan volume. The break-even analysis helps users understand how many MRI scans, CT scans, X-rays, or combined procedures may be required to cover those obligations. It also shows how changes in utilization, reimbursement, staffing, or supply costs can move the break-even point earlier or later. This is useful for launch planning because a center may have strong long-term profit potential but still face cash pressure during the first months of operations. By identifying the break-even timeline and the drivers behind it, users can set realistic patient volume targets, plan marketing and referral development, adjust staffing schedules, evaluate pricing strategies, and communicate a clear path to profitability to lenders, investors, and stakeholders.
File types:
Excel – Single-User: .xlsx
Excel – Multi-User: .xlsx
Similar ProductsOther customers were also interested in...


 HenrySheykin
Clinical Lab Financial Model Excel Template
The Clinical Laboratory Financial Model helps users turn a diagnostic lab concept into a structured ... Read more
Blood Bank Center Financial Model Excel Template
The Blood Bank Financial Model helps users turn a blood bank, blood collection facility, or blood ce... Read more

Gynecology Financial Model Excel Template
The Gynecology Clinic Financial Model Financial Model Template helps entrepreneurs, clinic founders,... Read more
Dialysis Center Financial Model Excel Template
The Hemodialysis Center Financial Model helps users evaluate the financial feasibility of launching,... Read more

 eFinancialModels
Pharma Biotech Valuation Model Template (Risk-Adju...
The Pharma Biotech Valuation Model Template calculates the risk-adjusted DCF Value of a Pharma or Bi... Read more

 Giorgos
Pharma Biotech Financial Model incl. Risk-Adjusted...
Financial Model analyzing a Biopharmaceutical Company using a Risk-Adjusted NPV Valuation Methodolog... Read more

 David
BioPharma Business Financial Projection 3 Statemen...
5-year rolling 3 statement financial projection for a biopharma business generating royalty and lice... Read more

 ExcelFinModels
Radiology Centers ( Interventional Radiology (IR) ...
The Interventional Radiology (IR) Center Financial Model is a comprehensive and versatile tool desig... Read more

Mobile Imaging Center Financial Model
This Excel model facilitates mobile imaging services by providing equipment and staff directly to th... Read more
Imaging Center Monthly 5-Year 3-Statement Financia...
This comprehensive financial model is designed for imaging centers, covering key revenue streams suc... Read more
You must log in to submit a review.