
0 ITEMS

Private Island Financial Model Excel Template
The Luxury Private Island Financial Model helps users turn an exclusive resort, island rental, or high-end hospitality concept into a structured financial forecast. Instead of starting from a blank spreadsheet, buyers can work from a ready-to-use model designed around the economics of a luxury private island business, including accommodation revenue, premium guest experiences, capital investment, staffing, operating expenses, cash flow, profitability, and investor return expectations. It gives entrepreneurs, founders, business owners, consultants, analysts, and advisors a practical framework for understanding whether the opportunity is financially viable before committing significant capital. This financial model template is useful for business planning, acquisition analysis, investor presentations, loan applications, and internal decision-making. Users can adjust revenue assumptions such as room nights, average daily rates, occupancy, events, excursions, wellness packages, and other ancillary services, then see how those assumptions affect sales, gross profit, EBITDA, net income, and cash position. The model also supports planning around startup costs and capital expenditures, which are especially important for a private island project where infrastructure, boats, utilities, villa upgrades, amenities, and launch preparation may require substantial upfront investment. The template helps organize both startup and ongoing financial planning in one place. Users can review operating expenses, payroll, cost of goods sold, fixed costs, variable costs, and funding needs while connecting those assumptions to monthly and annual projections. It is designed to help users evaluate cash flow timing, anticipate liquidity gaps, understand profitability, and prepare for discussions with lenders, investors, partners, or internal stakeholders. Break-even analysis, performance metrics, and return indicators help users identify when the business may become profitable and how sensitive the plan is to changes in demand, pricing, or costs. Built for flexibility, the Luxury Private Island Financial Model can be edited to reflect a new launch, acquisition, redevelopment, expansion, or investor-backed hospitality project. It provides a professional structure for testing decisions before they are made, comparing scenarios, refining budgets, and presenting a credible financial story. Whether the user is preparing a private island resort business plan, evaluating a luxury hospitality investment, or building funding documents, this template saves time and supports clearer, more confident decision-making.
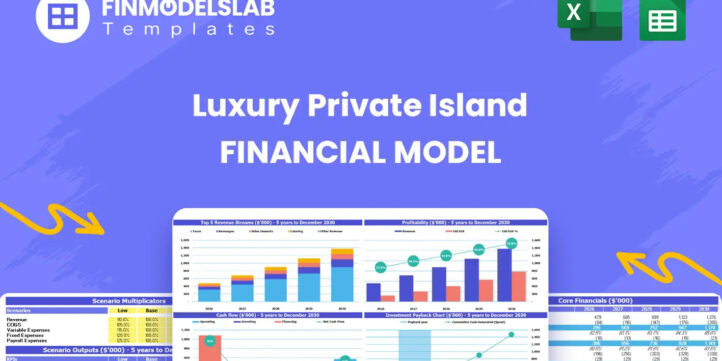


Financial Model Overview
The Luxury Private Island Financial Model is a ready-to-use financial model template designed for planning, evaluating, and presenting a high-end private island hospitality venture. A luxury private island business can involve multiple revenue streams, significant upfront capital expenditure, complex operating costs, premium staffing requirements, and investor-level return expectations. This template brings those moving parts into one structured model so entrepreneurs, business owners, consultants, analysts, and investors can forecast revenue, expenses, cash flow, profitability, and long-term performance without building a full model from scratch. It is useful for private island resorts, exclusive island rentals, boutique luxury hospitality concepts, acquisition analysis, redevelopment projects, and funding presentations. By connecting assumptions such as room count, average daily rate, occupancy, events, ancillary services, payroll, capital investment, and financing needs, the model helps users understand whether the project can generate sustainable returns and how different business decisions may affect performance over time.
All-in-One Dashboard
The all-in-one dashboard gives users a centralized view of the most important inputs and outputs in the Luxury Private Island Financial Model. It is designed to help users move quickly from assumptions to financial results by bringing together key drivers such as occupancy, average daily rate, accommodation mix, ancillary revenue, operating costs, capital investment, financing assumptions, cash flow, EBITDA, and profitability indicators. For a luxury private island business, decision-makers need to see how premium pricing, room inventory, guest demand, and high-value services combine to create overall performance, and the dashboard makes those relationships easier to review. Users can update editable fields to reflect their specific island, resort positioning, villa configuration, event strategy, staffing plan, or acquisition structure, then monitor the resulting impact on revenue, margins, funding needs, and returns. This component is especially useful for founders and advisors who need a fast summary for internal review, investor conversations, lender discussions, or board-level decision-making. Rather than searching through separate worksheets, users can rely on the dashboard to understand the financial health of the project at a glance and identify which assumptions require further review.
Low, Base, and High Scenario Analysis
The Low, Base, and High scenario analysis component allows users to compare three potential outcomes for the private island business under different operating conditions. A luxury resort or exclusive island rental can be highly sensitive to occupancy, average daily rate, seasonality, ancillary spending, staffing intensity, capital costs, and market demand, so scenario planning is essential for realistic financial planning. The Low case can be used to test conservative assumptions, such as slower booking growth, lower occupancy, reduced event revenue, or higher operating costs. The Base case can represent the expected operating plan, while the High case can show the upside potential from stronger demand, higher rates, improved utilization, or expanded premium services. This section helps generate side-by-side outputs for revenue, EBITDA, cash flow, payback, profitability, and return metrics, giving users a clearer understanding of possible performance ranges. For funding preparation, scenario analysis helps show investors and lenders that management has considered both risk and opportunity. For internal decision-making, it allows users to stress-test the business plan and prepare practical responses to changing market conditions.
Professional Charts
The professional charts component turns financial projections into presentation-ready visual outputs that are easier for stakeholders to understand. A private island investment often involves large numbers, multi-year forecasts, and several interconnected assumptions, and charts help simplify that information for business plans, pitch decks, lender packages, and investor updates. This section may visualize revenue growth, expense trends, EBITDA performance, cash flow movement, net income, cumulative returns, cost structure, or other key metrics across the forecast period. Users can rely on the charts to identify patterns that may not be obvious in raw spreadsheet data, such as the pace of revenue growth, the timing of cash flow recovery, margin expansion, or the effect of capital investment on short-term liquidity. For a luxury hospitality project, visual reporting is especially valuable because stakeholders often want to see how premium pricing, occupancy growth, ancillary sales, and operating leverage translate into long-term profitability. The charts also help improve communication with non-financial audiences by turning model outputs into clear business insights. This makes the template more practical for meetings, presentations, and decision reviews where users need to explain the opportunity quickly and professionally.
ROE Components and DuPont Analysis
The ROE components section uses DuPont-style analysis to help users understand the drivers behind return on equity rather than viewing ROE as a single isolated figure. In a luxury private island financial model, equity returns can be influenced by operating margins, asset utilization, financing structure, capital intensity, and profitability growth. This component breaks the return profile into more meaningful parts so users can see whether performance is being driven by strong margins, efficient use of invested capital, leverage, or a combination of factors. Inputs may include net income, revenue, total assets, equity investment, debt assumptions, operating profit, and balance sheet projections. Outputs can help users evaluate whether the business is generating attractive returns relative to the capital required to acquire, develop, refurbish, or operate the island. For investors, this analysis provides a more sophisticated view of financial performance and helps support discussions about capital structure, reinvestment, distributions, and exit planning. For management, it can highlight which operational levers matter most, such as increasing average daily rate, improving ancillary revenue, controlling fixed costs, or optimizing asset use. This makes the section valuable for both strategic planning and investor-ready financial analysis.
Revenue Inputs
The revenue inputs component is where users define the commercial assumptions that drive the financial forecast. For a Luxury Private Island Financial Model, revenue may come from several sources, including accommodation revenue across multiple villa or suite categories, whole-island bookings, bespoke events, bar and dining services, wellness packages, excursions, private experiences, and other premium guest services. Inputs may include room counts, available nights, occupancy rates, weekday and weekend pricing, average daily rate, package pricing, event volume, service attach rates, and expected annual growth. Because luxury island businesses often rely on high-value bookings and high-margin ancillary spending, small changes in these assumptions can have a major impact on total revenue and profitability. This section helps users document and adjust those assumptions in a clear, organized way, making it easier to test different pricing strategies, demand levels, guest segments, and service packages. It also supports more credible business planning because revenue is calculated from operational drivers rather than entered as a single top-line estimate. For entrepreneurs and consultants, this component is essential for building a forecast that reflects how the business actually earns money.
Bank-Ready Reports
The bank-ready reports component provides structured financial outputs that are suitable for lender review, investor due diligence, and formal business planning. Private island projects may require external financing for acquisition, refurbishment, infrastructure upgrades, boat fleets, utilities, launch costs, working capital, or expansion, and lenders typically expect clear financial statements, assumptions, cash flow projections, profitability analysis, and debt service visibility. This section helps organize the model into reports that can support those discussions, including income statement summaries, cash flow forecasts, balance sheet views, funding requirements, profitability metrics, and repayment capacity indicators where applicable. The goal is to make the financial story easier to review and more credible for professional stakeholders. Users can present how revenue is expected to grow, how costs are controlled, when the business becomes profitable, and whether the operation can maintain sufficient liquidity through the launch and growth phases. For a luxury private island business, bank-ready reporting is especially useful because the investment can be capital intensive and may involve unique risk factors such as seasonality, high staffing requirements, marine logistics, and infrastructure maintenance. This component helps users prepare a cleaner, more lender-friendly package.
Revenue Breakdown
The revenue breakdown component provides a detailed view of each revenue stream so users can understand where income is expected to come from and which parts of the private island business have the greatest financial impact. Instead of viewing total sales as one combined number, this section separates revenue by categories such as accommodation types, island estate bookings, villas, events, bar services, wellness packages, excursions, private dining, activities, and other guest experiences. Inputs may include rates, volume, utilization, frequency, guest participation, seasonal assumptions, and growth rates. Outputs help users compare the contribution of each revenue stream to total revenue, gross margin, and overall profitability. This is particularly important for a luxury private island because the business model may depend on both premium lodging and high-margin ancillary services. A detailed breakdown helps users identify which offerings deserve more marketing focus, which services should be priced differently, and which guest experiences may improve total revenue per stay. It also helps with operational planning because each revenue stream may require different staffing, inventory, partnerships, or capital investment. For investor presentations, the breakdown provides a clearer explanation of how the resort generates value beyond room revenue alone.
KPI Dashboard
The KPI dashboard component tracks performance metrics and benchmarks that help users evaluate the health of the luxury private island business over time. Key performance indicators may include occupancy rate, average daily rate, revenue per available room, total revenue per guest, EBITDA margin, gross margin, payroll as a percentage of revenue, cost of goods sold, cash balance, break-even timing, return on equity, internal rate of return, payback period, and other hospitality or investment metrics. This section turns detailed financial data into decision-ready indicators that can be reviewed quickly by owners, managers, investors, or advisors. For a luxury private island project, KPIs are important because the business may have high fixed costs and a premium positioning that depends on maintaining both pricing power and service quality. The dashboard helps users compare planned performance against targets, industry expectations, or internal benchmarks, making it easier to spot issues early. If occupancy is lower than expected, costs are rising, or ancillary revenue is underperforming, users can revisit assumptions and adjust strategy. The KPI dashboard also supports reporting discipline by giving stakeholders a consistent set of metrics to review during planning, fundraising, launch, and ongoing operations.
Startup and Operating Cost Planning
The startup and operating cost planning component helps users estimate the capital and expense structure required to launch and run a luxury private island business. Startup costs may include acquisition-related expenses, villa refurbishment, guest amenities, marine equipment, boat fleet purchases, power generation upgrades, water systems, staff housing, resort technology, furniture, fixtures, pre-opening marketing, licenses, deposits, legal fees, and initial working capital. Operating expenses may include payroll, food and beverage costs, utilities, maintenance, insurance, transportation, housekeeping, guest services, marketing, commissions, management costs, repairs, security, and administrative overhead. This section is useful because private island ventures often require substantial upfront investment before revenue begins, along with ongoing costs that must support a premium guest experience. Users can separate fixed and variable costs, estimate cost of goods sold, adjust payroll levels, and align expenses with occupancy and service volume. Outputs from this section help determine funding needs, operating budgets, profit margins, and cash flow requirements. For investors and lenders, a detailed cost plan shows that the user has considered both the launch budget and the long-term expense base. For management, it supports better decisions about phasing capital expenditures, staffing appropriately, negotiating supplier terms, and protecting profitability.
Break-Even and Cash Flow Analysis
The break-even and cash flow analysis component helps users understand when the luxury private island business may become profitable and whether it has enough liquidity to operate through each phase of the forecast. Break-even analysis connects revenue, fixed costs, variable costs, payroll, cost of goods sold, and operating expenses to determine the point where total revenue covers total costs. Cash flow analysis then goes further by showing the timing of inflows and outflows, including customer deposits, operating receipts, supplier payments, payroll, capital expenditures, debt service, financing proceeds, and working capital needs. This is especially important for a private island project because heavy upfront investment, seasonal demand, high staffing expectations, and infrastructure costs can create temporary liquidity gaps even when the long-term economics are attractive. Users can review monthly and annual cash flow, minimum cash balance, funding shortfalls, and the impact of different operating assumptions on liquidity. This component is valuable for deciding how much capital to raise, whether an operating line of credit is needed, when to phase investments, and how quickly the business can move toward sustainable profitability. It also gives lenders and investors a clearer view of risk, repayment capacity, and the financial discipline behind the plan.
File types:
Excel – Single-User: .xlsx
Excel – Multi-User: .xlsx
Similar ProductsOther customers were also interested in...



 HenrySheykin
Casino Hotel Financial Model Excel Template
The Casino Hotel Financial Model helps users build a structured five-year forecast for an integrated... Read more
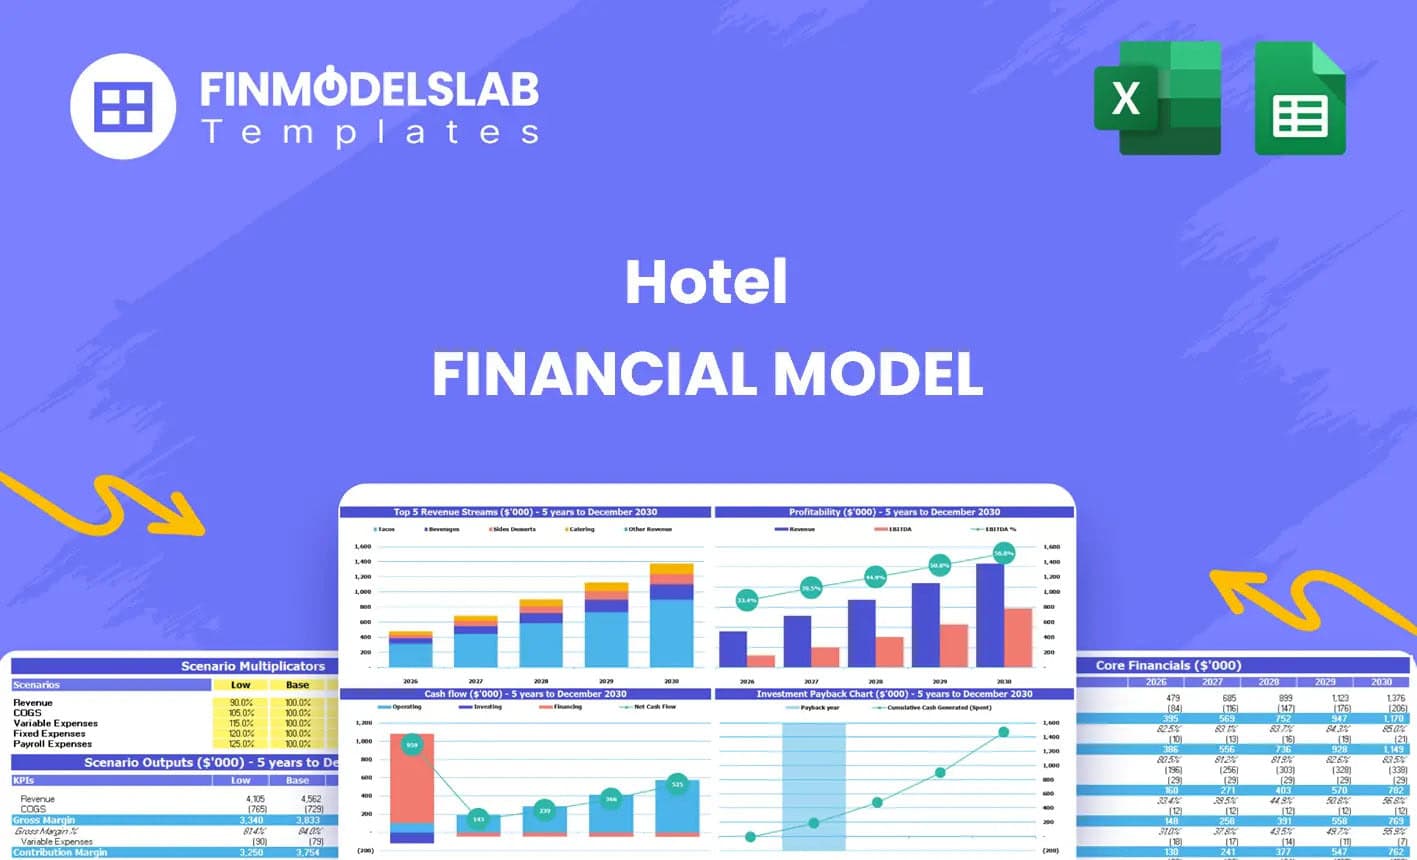
Floating hotel Financial Model Excel Template
The Hotel Financial Model helps users build a structured financial forecast for a hotel business usi... Read more
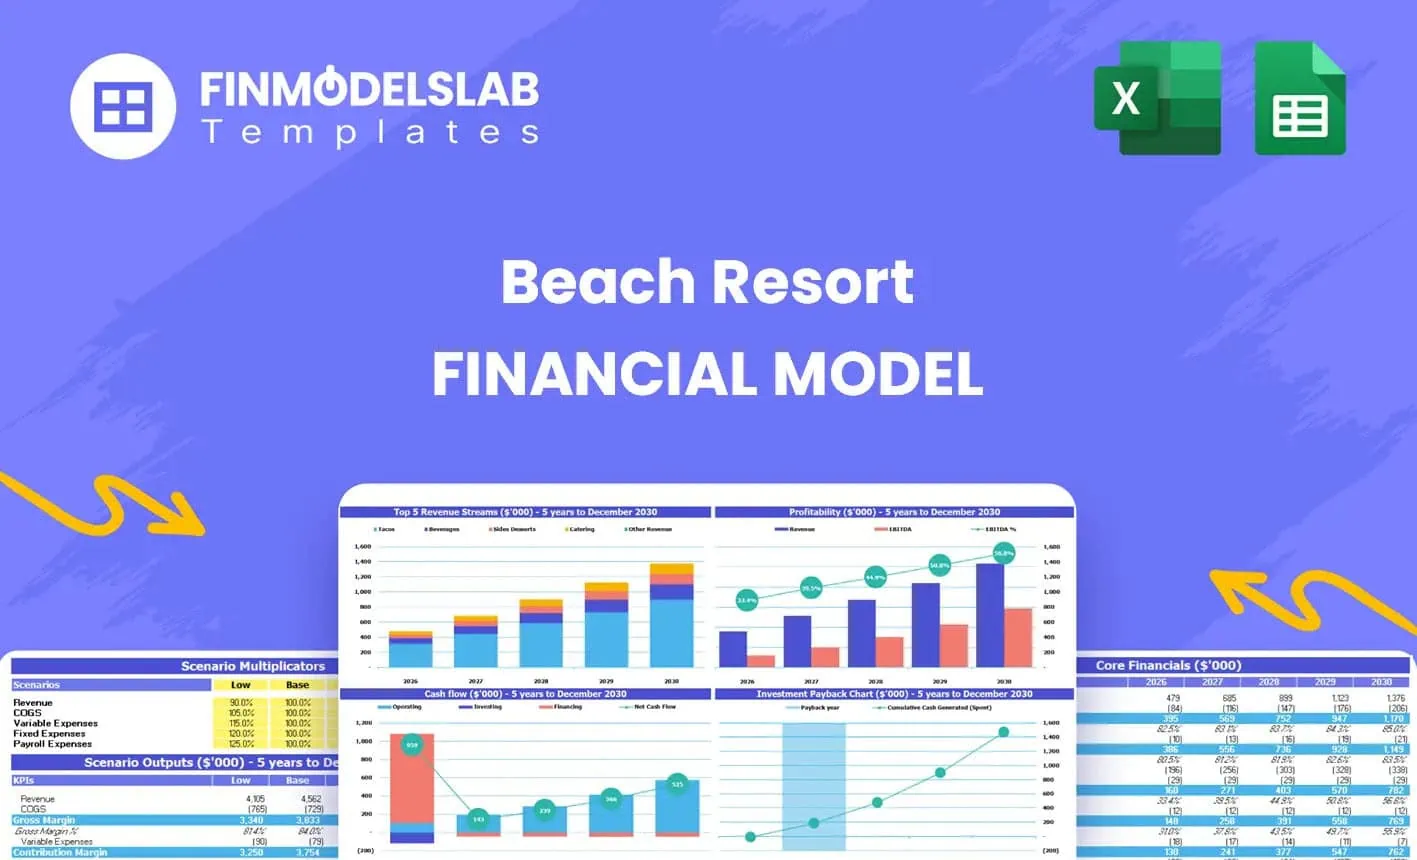
Beach Hotel Financial Model Excel Template
The Beach Resort Financial Model template helps entrepreneurs, resort owners, consultants, analysts,... Read more
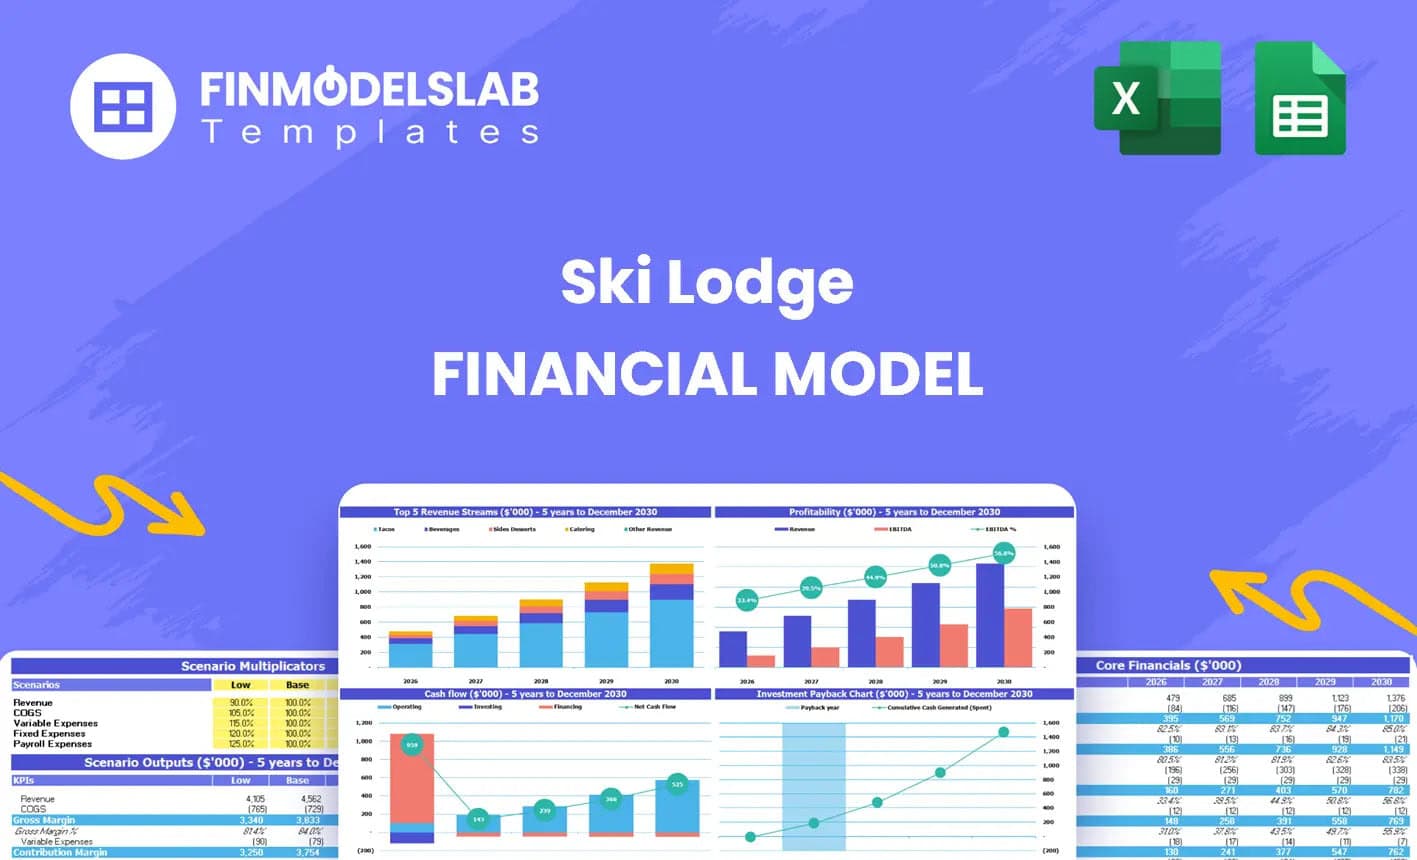
Ski Resort Hotel Financial Model Excel Template
The Ski Lodge Financial Model Template helps entrepreneurs, hospitality founders, consultants, analy... Read more

 Giorgos
Tour Operator Financial Model – 5 Year Finan...
Financial Model providing an advanced 5-year financial plan for a startup or operating Tour Operator... Read more

Theme Park & Hotel Financial Model (Construct...
Financial model presenting a development scenario for a Theme Park & Hotel project including con... Read more

 GoGo Spreadsheets
Best Resort Financial Model
The best financial model for a Resort business. Unlock the true potential of your luxury resort with... Read more
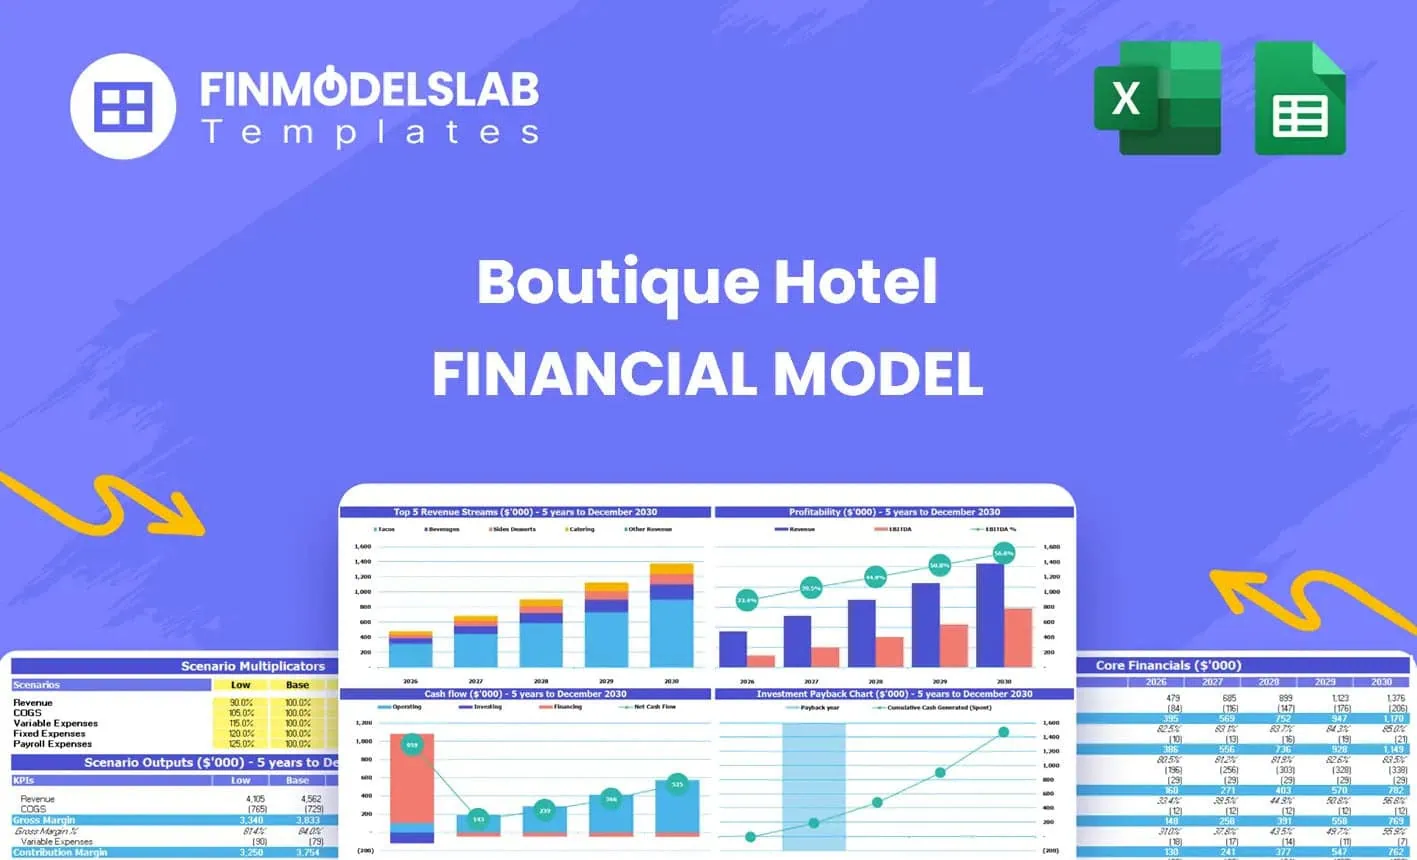
Boutique Hotel Financial Model Excel Template
The Boutique Hotel Financial Model Financial Model Template helps entrepreneurs, hotel owners, consu... Read more
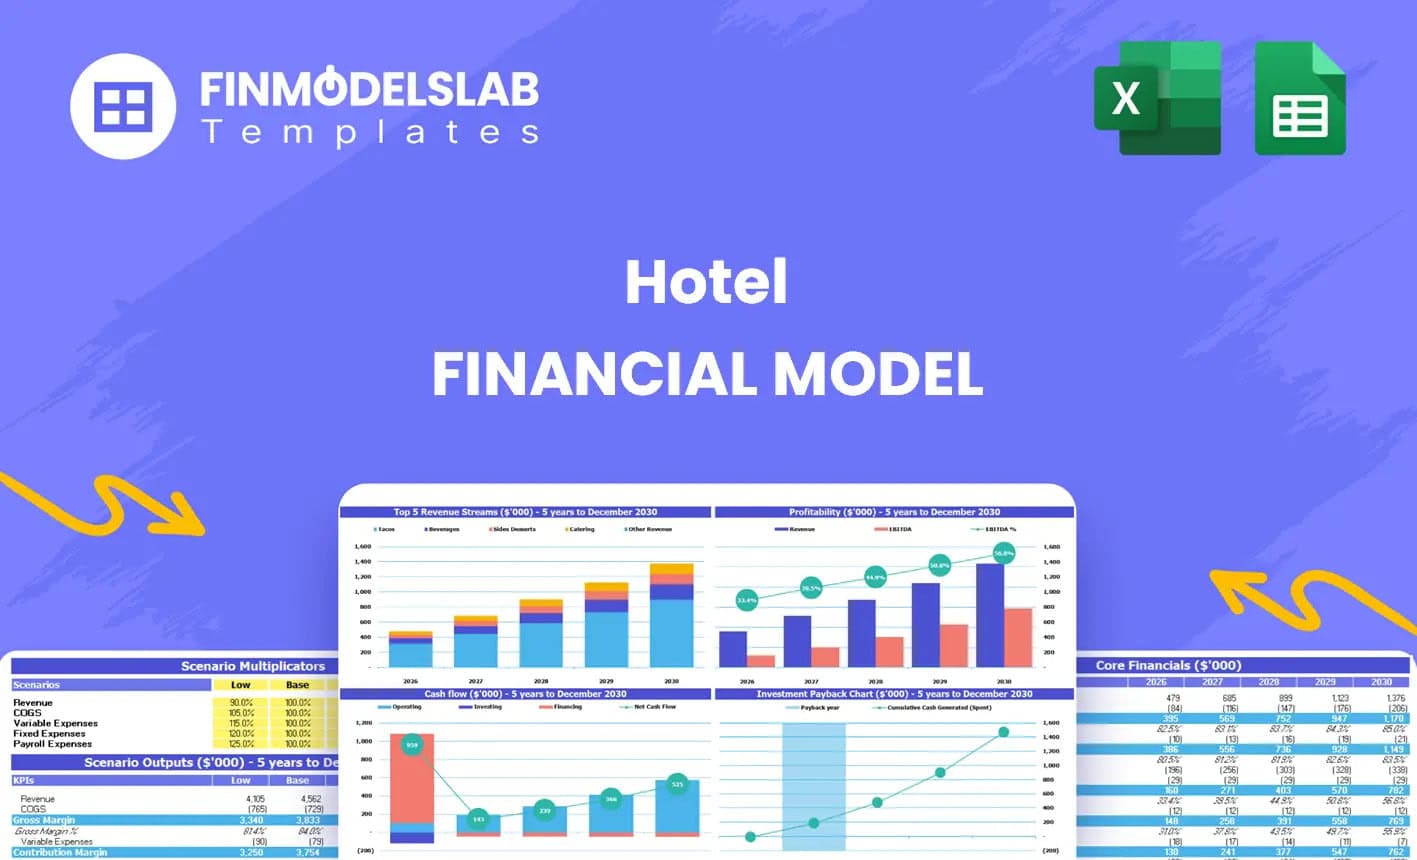
Hotel Financial Model Excel Template
The Hotel Financial Model helps users build a structured financial forecast for a hotel business usi... Read more
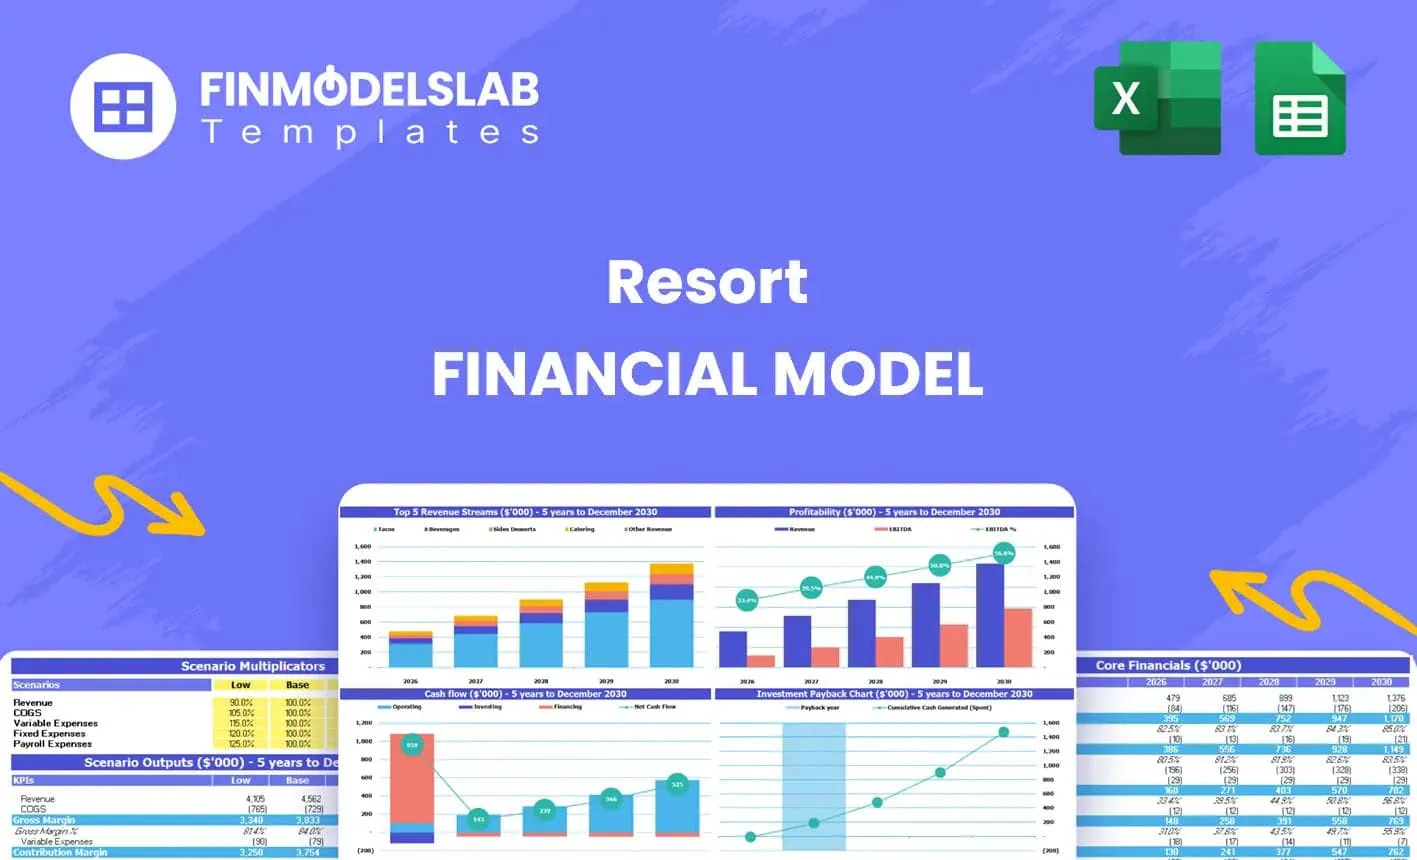
Resort Financial Model Excel Template
The Resort Financial Model Financial Model Template helps resort developers, hospitality entrepreneu... Read more
You must log in to submit a review.