
0 ITEMS

Japan Luxury Hotels: 42.7M Visitors Drive 2026–2031 Boom
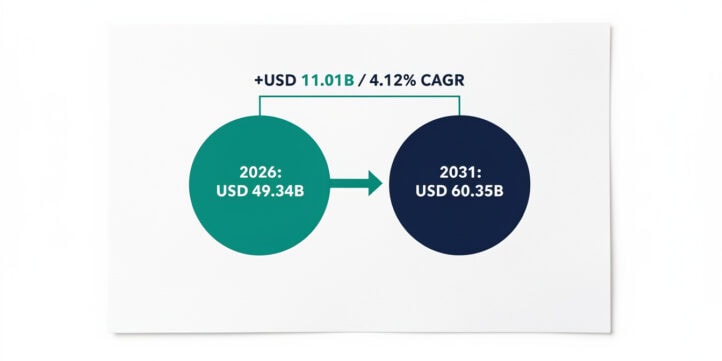
Japan is the most sought-after luxury-lodging market in Asia right now, and the gap between surging demand and constrained supply is the central investment thesis for the next five years.
Key Takeaways
- Japan recorded roughly 42.7 million foreign visitors in 2025, a second consecutive all-time high, who spent a record near ¥9.5 trillion, making inbound tourism the country’s second-largest export industry.
- Tokyo luxury RevPAR rose approximately 71% in 2025, yet Tokyo’s city-wide ADR of about ¥28,000 (US$188) still sits well below New York (US$306), London (US$250), and Paris (US$374), leaving structural rate headroom.
- Prime Tokyo hotel cap rates (net operating income divided by asset value) compressed to record lows near 3.0–3.5%, and Japan led Asia-Pacific with more than US$4 billion of hotel transactions in 2024.
- The luxury ryokan market was estimated at about US$2.2 billion in 2025 and is growing at roughly 12% per year toward US$3.1 billion by 2033, driven by succession-driven consolidation.
- Niseko holds approximately 1,629 branded-residence units across nine projects, representing about 78% of Japan’s national branded-residence supply.
- Three scenarios to 2031 project luxury RevPAR CAGR of 2.0% (Bear), 4.5% (Base), or 7.0% (Bull), with branded-residence premiums ranging from 28% to 42% over unbranded prime.
- The binding constraint across all three sub-segments is supply, not demand: Japan’s new-supply-to-existing ratio is only about 1.7%, far below regional peers.
Why Japan’s Hospitality Market Is Different
Japan’s luxury lodging market rests on three structural pillars that reinforce each other: gateway-city luxury hotels, traditional high-end ryokan (Japanese inns with hot-spring bathing and kaiseki multi-course dining), and branded residences attached to or near those hotels. Each generates a distinct cash-flow profile, and investors who blend them into a single model miss the dynamics that drive returns in each.
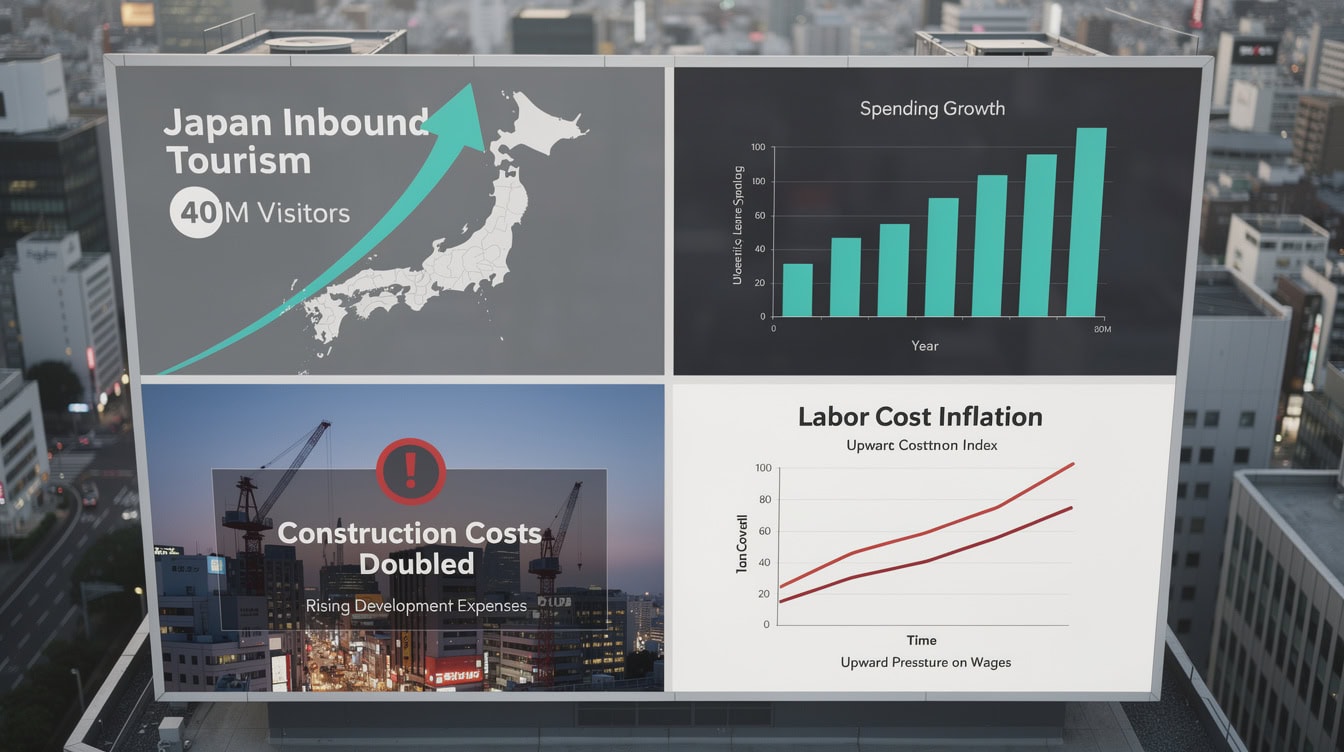
The demand engine is the government’s Tourism Nation Promotion Basic Plan, which targets 60 million visitors and ¥15 trillion of spending by 2030, up from 42.7 million visitors and ¥9.5 trillion in 2025 (Japan Tourism Agency). North American arrivals passed 3 million for the first time in 2025, and Gulf and high-net-worth Asian travelers are growing fastest, precisely the cohorts that over-index on luxury lodging. A persistently weak yen amplifies the effect: for a dollar- or dirham-denominated guest, Japanese luxury is effectively discounted, which supports both average daily rate (ADR, the average room revenue per occupied room) and foreign appetite for resort property.
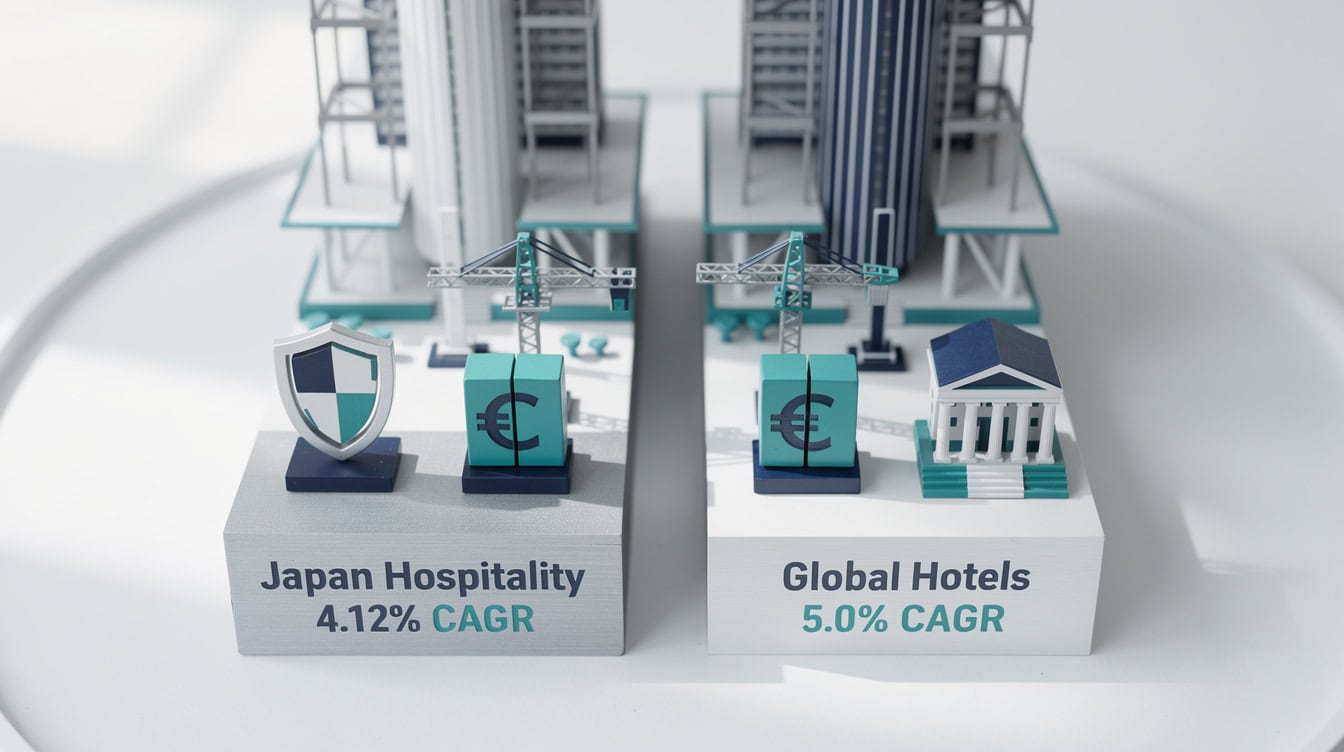
The Three Sub-Segments: How Each Model Works
Each of Japan’s three luxury lodging sub-segments has a different operating structure, return driver, and risk profile. Investors should underwrite them separately before consolidating into a platform view.
Luxury Hotels: Rate Is the Lever
Luxury hotels are five-star city properties in Tokyo, Osaka, and Kyoto, and five-star resorts in Niseko, Okinawa, and the onsen (hot-spring) mountain regions. RevPAR (revenue per available room, calculated as ADR multiplied by occupancy rate) is the primary operating metric. Tokyo’s city-wide ADR reached roughly ¥28,000 (about US$188) in 2025, growing more than 20% year over year for nineteen consecutive months according to STR data cited in the eFinancialModels Japan Luxury Hospitality Market Study 2026–2031. Osaka rode the six-month Expo 2025 to luxury occupancy near 73%, up about 24 percentage points year over year, with double-digit RevPAR growth. Japan welcomed approximately 36.9 million international visitors in 2024 (Japan Tourism Agency), a figure that underscores just how dramatic the acceleration to 42.7 million in 2025 truly was.
The supply constraint is the structural advantage for existing owners. Japan’s new-supply-to-existing ratio is only about 1.7%, far below regional peers, because prime sites are scarce, construction costs have risen sharply, and labor is tight. The pipeline is a roster of named, high-conviction projects: Waldorf Astoria Tokyo Nihonbashi (197 rooms, 2026), Capella Kyoto in Gion (89 rooms, 2026), and MGM Osaka integrated resort (approximately 1,829 rooms plus casino, 2030). Each is a discrete, financeable event, not a flood of new supply.
Luxury Ryokan: The Consolidation Opportunity
A ryokan is a traditional Japanese inn regulated under the Inns and Hotels Business Act. The luxury tier pairs small-format rooms with kaiseki dining (multi-course Japanese haute cuisine) and private or communal onsen bathing on culturally irreplaceable land. This is Japan’s most distinctive hospitality asset and, for investors, its least-benchmarked.
The total number of ryokan has fallen from more than 46,000 establishments in 2010 toward the mid-30-thousands as family operators face succession crises, according to the study’s analysis of Inns and Hotels Act registrations. Yet the luxury tier is consolidating and growing in value. The luxury-ryokan market was estimated at about US$2.2 billion in 2025 and is projected to reach US$3.1 billion by 2033 at roughly 12% per year (FutureDataStats). Capital is moving in: Hyatt and Kiraku launched the ATONA hot-spring ryokan brand with ¥10 billion of initial funding, and Marriott created a Ryokan Collection.
For the investor, the ryokan should be modeled as a multi-revenue operating business, not a hotel alone. Revenue streams include rooms, kaiseki food and beverage (which often exceeds room revenue per guest), onsen access, and curated experiences. Onsen infrastructure and heritage-building maintenance are distinctive capital expenditure lines and regulatory prerequisites.
Branded Residences: The Faster-Cash Half
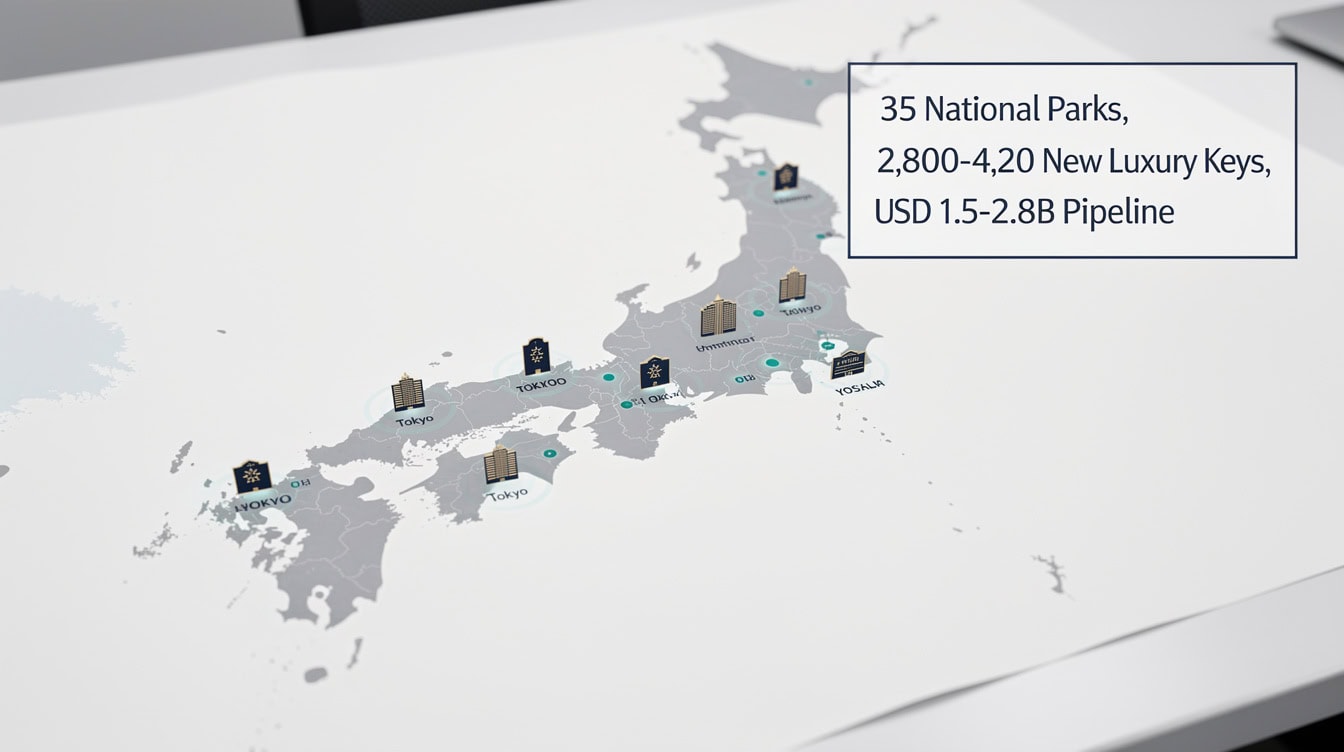
A branded residence is a for-sale home carrying a hotel or lifestyle brand, either hotel-attached or standalone. The branded premium is the percentage uplift in price over comparable unbranded prime property in the same location. In Japan, that premium runs approximately 30% in gateway cities and 33–35% in resorts (C9 Hotelworks Japan Branded Residences Overview 2025).
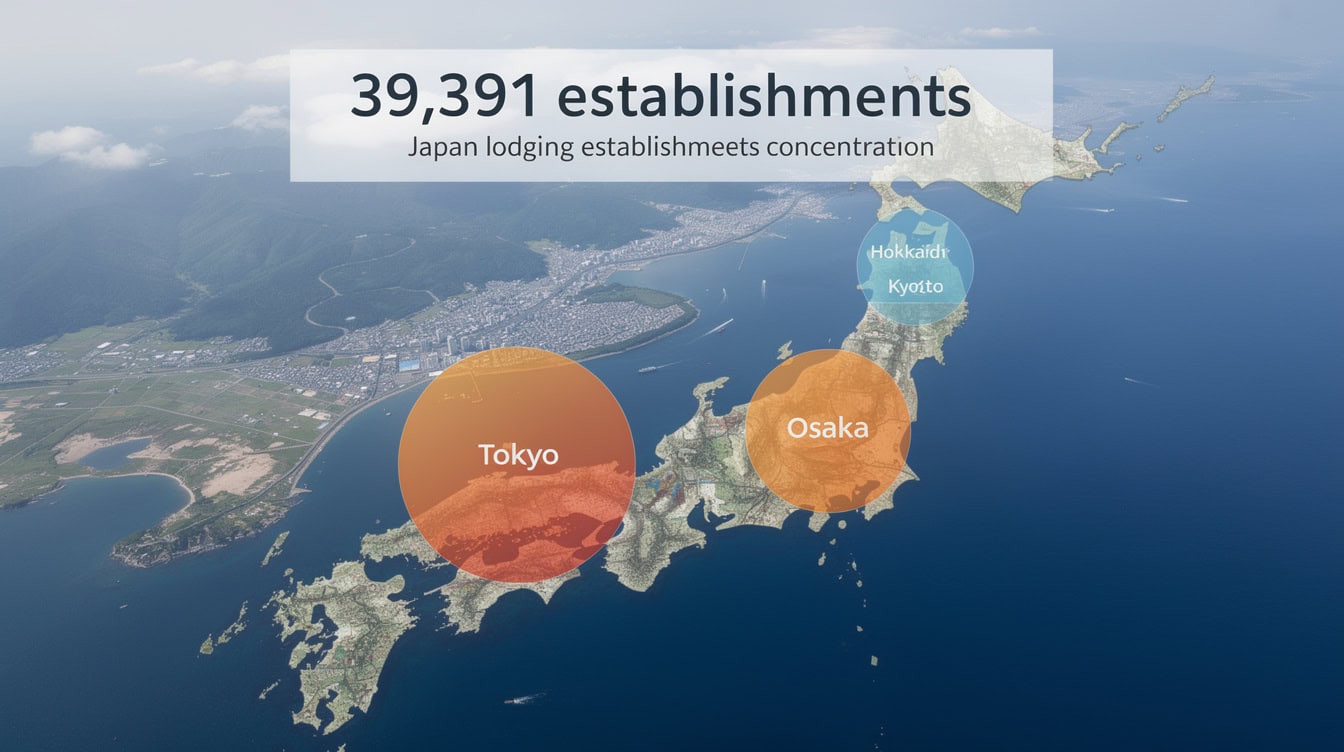
Niseko holds the country’s largest branded-residence market at roughly 1,629 units across nine projects, and Hokkaido accounts for about 78% of national supply. Okinawa adds about 11%. Tokyo is small in unit count but commands extreme prices: the Aman Residences at the Mori JP Tower, 91 units, sold out, with one Azabudai unit reportedly trading at about ¥20 billion (around US$129 million). Japan’s inbound tourism spending reached a record ¥8.1 trillion in 2024 (Japan Tourism Agency), providing the high-net-worth visitor base that sustains demand for ultra-premium branded product.
For developers, the residence is often the faster-cash, lower-operating-risk component of a mixed scheme. Pre-sales de-risk construction finance, and absorption (the pace at which units sell) in the Base Case runs approximately two years to sell-out, faster in resort markets. The brand is paid through some combination of up-front key money, a licensing fee of roughly 3–6% of net sales, and a recurring service fee.
Worked Example: Base Case RevPAR and Branded-Residence Return
Here’s the math for a simplified Base Case underwrite of a Tokyo luxury hotel with an attached branded-residence component.
Hotel component:
- Starting luxury ADR: ¥45,000 (five-star tier, above city-wide average)
- Starting occupancy: 77%
- Starting RevPAR: ¥45,000 × 0.77 = ¥34,650
- ADR growth CAGR 2026–2031: 4.5% per year (Base Case)
- RevPAR at 2031: ¥34,650 × (1.045)^5 = ¥34,650 × 1.246 = approximately ¥43,174
- GOP margin (gross operating profit as a percentage of total revenue): approximately 35% for a well-run Tokyo luxury hotel
- Implied NOI at stabilization: ¥43,174 × 0.35 = approximately ¥15,111 per available room per year
- At a 3.2% cap rate (mid-point of the 3.0–3.5% Tokyo range): implied value per room = ¥15,111 ÷ 0.032 = approximately ¥472,000 per room
Branded-residence component:
- Unbranded prime Tokyo residential price: ¥2,000,000 per square meter (illustrative)
- Branded premium at 30%: ¥2,000,000 × 1.30 = ¥2,600,000 per square meter
- Brand license fee: 4% of net sales
- Net developer revenue per square meter after license: ¥2,600,000 × 0.96 = ¥2,496,000
- Developer margin hurdle: 20% of gross revenue
- Implied development cost ceiling: ¥2,600,000 × 0.80 = ¥2,080,000 per square meter
The residence component generates cash at sale, de-risking the hotel construction loan, while the hotel underwrites the branded premium that makes the residences sellable. This is why the two must be modeled as linked but separate cash-flow engines.
Three Scenarios to 2031: Bear, Base, and Bull
The eFinancialModels research team assigns three probability-weighted scenarios for the 2026–2031 period. Each scenario changes the return driver, not just the headline number.
| Metric | Bear (25%) | Base (50%) | Bull (25%) |
|---|---|---|---|
| RevPAR CAGR | ~2.0%/yr | ~4.5%/yr | ~7.0%/yr |
| Gateway occupancy | ~75% | ~78% | ~80% |
| Tokyo cap rate | ~4.0% | ~3.4% | ~3.0% |
| Branded premium | ~28% | ~34% | ~42% |
| Developer margin | Below hurdle | Above hurdle | Well above hurdle |
The Bear Case assumes a sharp yen appreciation that erodes the foreign-visitor discount, a faster-than-expected Bank of Japan (BoJ) rate normalization that lifts cap rates off record lows, and heavier accommodation-tax friction. The Bull Case assumes a persistently weak yen, the MGM Osaka integrated resort acting as a sustained Kansai demand catalyst, and a genuine shortage of brand-grade product driving rate above trend.
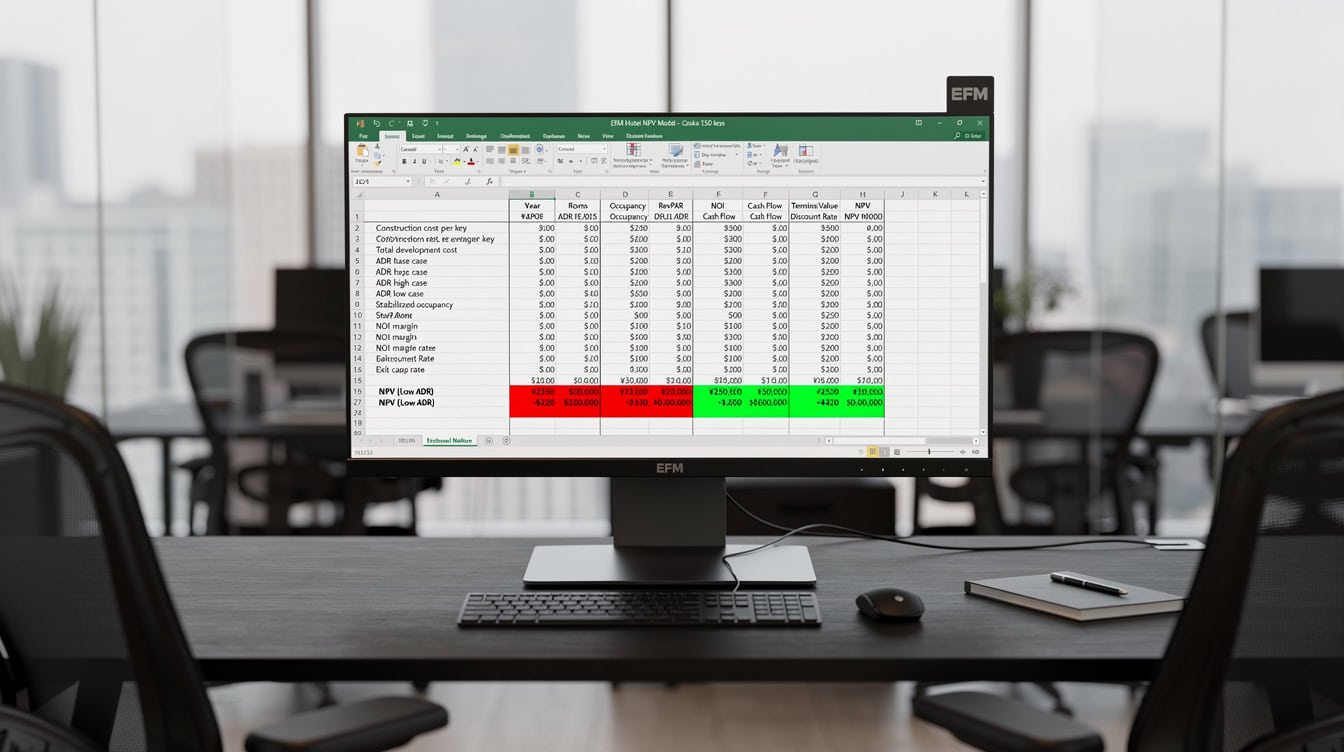
The central recommendation: stress the rate and premium assumptions against a yen reversal and faster BoJ tightening rather than stressing occupancy, which is already strong across gateway cities.
Investment Market: Cap Rates, Transactions, and the BoJ Risk
Japan’s hotel investment market is the deepest and most liquid in Asia-Pacific. Japan attracted more than US$4 billion of hotel transactions in 2024, approximately 40% of the Asia-Pacific total, and US$1.5 billion in the first half of 2025 alone (JLL Asia Pacific Hotel Investment Highlights). Prime Tokyo hotel NOI yields compressed to all-time lows near 3.0–3.5% as cross-border capital competed for scarce stock against a backdrop of a weak yen and near-zero rates (CBRE Japan Investment MarketView Q3 2025).
The implication for underwriting is direct: entry yields are structurally low, and returns depend on rate growth, brand-led repositioning, and the residential premium rather than further yield compression. The Bank of Japan’s policy normalization is the primary capital-market risk. Prime cap rates near 3.0–3.5% leave little cushion if the 10-year Japanese Government Bond (JGB, the domestic risk-free benchmark) rises materially. The prudent approach is to underwrite rate-driven income growth and fix or hedge debt rather than relying on further cap-rate compression.
Regulatory and Tax Context: What Changes in 2026
Regulation is now a first-order operating and demand variable, and the 2026 stack on balance favors the branded, professionally managed top of the market.
Kyoto’s accommodation tax rises tenfold to ¥10,000 per night at the top tier from March 2026 (Live Japan). Japan’s departure tax triples from ¥1,000 to ¥3,000 per person in 2026 (Self-Guide Japan). Minpaku (licensed private short-term lodging under the 2018 Act, capped at 180 nights per year) enforcement is tightening, which constrains the unbranded competitive set. The MGM Osaka integrated resort, breaking ground toward a 2030 opening, is a one-time Kansai demand catalyst whose post-opening normalization the modeler should anticipate.
For luxury operators, the accommodation tax is absorbable at five-star price points and acts as a barrier to lower-quality supply. For investors, the regulatory stack lowers new-supply risk for in-place owners and adds a manageable cost line to luxury operations.
Common Mistakes Investors Make in Japan Hospitality
Five specific errors appear repeatedly in Japan hospitality underwriting, and each has a clear fix.
1. Blending the three sub-segments into one model. Mixing hotel, ryokan, and residence cash flows hides the dynamics that drive returns in each. Fix: build three separate pro formas and consolidate at the platform level only.
2. Underwriting cap-rate compression as the return driver. With prime Tokyo cap rates already at 3.0–3.5%, further compression is unlikely and BoJ normalization could reverse it. Fix: drive returns from ADR growth, brand repositioning, and the residential premium.
3. Modeling the ryokan as a hotel. Ryokan revenue from kaiseki dining often exceeds room revenue per guest, and onsen capex is a regulatory prerequisite, not optional. Fix: model rooms, F&B, onsen, and experiences as separate revenue lines with their own cost structures.
4. Ignoring the yen as a financeable input. The weak yen underpins both ADR growth and branded-residence demand. A sharp appreciation would simultaneously cool inbound stays and foreign buyer appetite. Fix: stress-test rate and premium assumptions against a 15–20% yen appreciation scenario.
5. Treating resort seasonality as a rounding error. Niseko earns its year in the December-to-March powder season. A soft peak season cannot be recovered. Fix: model resort cash flows monthly, size the residence pre-sales to cover fixed costs in the off-season, and build shoulder-season programming into the operating budget.
Tools and Templates for Japan Hospitality Modeling
Building a credible Japan hospitality model requires separate financial engines for each sub-segment. The Japan Luxury Hospitality Market Study 2026–2031 provides the market benchmarks, scenario assumptions, and operator landscape needed to calibrate a property-level model. For the financial modeling layer, the Hospitality Financial Model Bundle and the Hospitality Financial Model Template Bundle cover the hotel operating pro forma, while the Market Studies library provides comparable research for adjacent markets.
For the branded-residence component, the key modeling inputs are the branded premium (approximately 30% city, 33–35% resort), the brand license fee (3–6% of net sales), absorption pace (approximately two-year sell-out in the Base Case), and the developer margin hurdle (approximately 20%). These should be modeled as a separate residential pro forma linked to the hotel through shared brand costs and the NOI underwrite.
Frequently Asked Questions
What is RevPAR and why does it matter for Japan luxury hotels?
RevPAR stands for revenue per available room and equals ADR multiplied by occupancy rate. It is the single most important operating metric for a hotel investor because it captures both pricing power and utilization in one number. In Japan’s luxury segment, RevPAR is the primary return driver because occupancy in gateway cities is already strong (approximately 77–78% in the Base Case) and the principal lever is rate, not filling more rooms. Tokyo luxury RevPAR rose approximately 71% in 2025 according to CoStar data cited in the eFinancialModels study, yet Tokyo’s ADR still sits well below New York, London, and Paris, which means the structural room for further rate growth is real and quantifiable. An investor who models Japan hospitality on occupancy growth rather than ADR growth will systematically underestimate returns in the Base and Bull cases.
How does the branded-residence premium work in Japan, and what fees does the brand charge?
The branded premium is the percentage uplift in sale price that a for-sale home commands because it carries a recognized hotel or lifestyle brand. In Japan, that premium runs approximately 30% in gateway cities like Tokyo and approximately 33–35% in resort markets like Niseko, based on C9 Hotelworks Japan Branded Residences Overview 2025. The brand earns this premium through a combination of up-front key money, a licensing fee of roughly 3–6% of net sales, and a recurring service fee paid by the homeowners association. For a developer selling a ¥500 million Tokyo unit at a 30% premium over unbranded prime, the gross uplift is ¥150 million per unit, from which the brand license fee of approximately 4% (¥20 million) is deducted. The net uplift of ¥130 million per unit is what makes the residence the faster-cash, lower-operating-risk half of a mixed hotel-and-residence scheme.
What is a ryokan, and why is it an investable asset class now?
A ryokan is a traditional Japanese inn regulated under the Inns and Hotels Business Act. The luxury tier pairs small-format rooms (often 10–30 keys) with kaiseki multi-course dining, private or communal onsen (natural hot-spring) bathing, and heritage architecture on culturally irreplaceable land. Ryokan have historically been family-owned and difficult to institutionalize, but two forces are changing that. First, Japan’s demographic crisis means thousands of family operators face succession with no heir, creating acquisition opportunities for well-capitalized platforms. Second, international brands have validated the model: Hyatt and Kiraku launched the ATONA brand with ¥10 billion of initial funding, and Marriott created a Ryokan Collection. The luxury-ryokan market was estimated at about US$2.2 billion in 2025 and is growing at roughly 12% per year (FutureDataStats), making it the fastest-compounding sub-segment in Japanese hospitality.
What is Japan’s cap rate environment, and how does Bank of Japan policy affect hotel values?
A cap rate (capitalization rate) is net operating income divided by asset value, expressed as a percentage. A lower cap rate means a higher asset value for the same income. Prime Tokyo hotel cap rates compressed to record lows near 3.0–3.5% in 2025 as cross-border capital competed for scarce stock against a backdrop of near-zero Japanese interest rates and a weak yen (CBRE Japan Investment MarketView Q3 2025). The risk is that the Bank of Japan’s policy normalization pushes the 10-year Japanese Government Bond yield higher, which typically widens cap rates and reduces asset values. The Base Case assumes the 10-year JGB normalizes to approximately 1.5–1.8%, with prime Tokyo cap rates holding near 3.4% by 2031. The Bear Case assumes faster tightening pushes cap rates to approximately 4.0%, which would materially reduce exit values for assets underwritten at today’s entry yields. The mitigation is to underwrite income growth from ADR rather than cap-rate compression, and to fix or hedge debt at entry.
How should investors model the yen risk in a Japan hospitality investment?
The weak yen is both the primary demand accelerant and the primary downside risk in Japan hospitality. For a dollar-denominated guest, a yen at 150 per dollar makes a ¥45,000 ADR room cost US$300 per night. If the yen strengthens to 120 per dollar, the same room costs US$375, a 25% effective price increase that cools inbound demand and foreign buyer appetite simultaneously. The practical approach is to build a currency sensitivity table alongside the main pro forma: stress the ADR and branded-residence premium assumptions against a 15–20% yen appreciation and test whether the investment still clears the return hurdle on scarcity value and domestic demand alone. The scarcity floor, a resilient domestic luxury base, and the government’s 60-million-visitor target provide a buffer, but the prudent investor does not rely on the currency tailwind as a base assumption.
Which markets within Japan offer the best risk-adjusted opportunity through 2031?
The answer depends on the sub-segment. For luxury hotels, Tokyo offers the deepest liquidity, the strongest ADR growth trajectory, and the most diversified demand base across business, leisure, and cultural travel. Osaka adds the MGM integrated resort catalyst in 2030 and a commerce-driven base. Kyoto offers heritage tourism demand that already strains capacity, but overtourism management and the tenfold accommodation-tax increase add operating complexity. For branded residences, Niseko is the volume market with approximately 1,629 units across nine projects and a proven pre-sales model that de-risks construction finance. Tokyo is the ultra-premium market where scarcity commands extreme prices, as the sold-out Aman Residences demonstrate. For ryokan consolidation, the opportunity is national but concentrated in onsen regions where succession-driven sales of family inns are most active.
What does the MGM Osaka integrated resort mean for investors?
The MGM Osaka integrated resort (IR) is a casino-anchored leisure complex developed by MGM Resorts and Orix, breaking ground toward a 2030 opening with approximately 1,829 hotel rooms and a casino. An integrated resort is a large-scale entertainment destination combining a casino with hotels, convention facilities, retail, and dining. For investors, the MGM Osaka IR is a one-time Kansai demand catalyst that will draw new visitor segments, particularly MICE (meetings, incentives, conferences, and exhibitions) and gaming-adjacent leisure travelers, to Osaka and the broader Kansai region. The practical modeling implication is to treat the opening year as a demand spike and build in a post-opening normalization rather than assuming the catalyst-year occupancy and ADR persist. Osaka luxury occupancy already reached approximately 73% during Expo 2025, so the IR adds to an already-strong base rather than rescuing a weak market.
Conclusion
Japan’s luxury hospitality market from 2026 to 2031 is defined by one structural fact: demand is enormous and growing, supply is constrained and growing slowly, and the assets that can raise rate are the structural winners. Tokyo luxury RevPAR has room to converge toward global gateway peers. The luxury-ryokan consolidation wave is the clearest succession-driven M&A opportunity in Asian hospitality. Branded residences in Niseko and Tokyo command premiums that stack on already-high prime values and de-risk mixed-use development.
The investor’s job is to model the three sub-segments separately, drive returns from rate growth and the residential premium rather than cap-rate compression, and stress-test every assumption against a yen reversal and faster BoJ tightening.
I recommend starting with the Japan Luxury Hospitality Market Study 2026–2031 to calibrate your market assumptions, then pairing it with the Hospitality Financial Model Template Bundle to build the property-level pro formas that turn those benchmarks into a financeable investment case.























































