
0 ITEMS

Investor-Ready Financial Models: 5 Criteria VCs Check

Your pitch deck gets you in the room. Your financial model determines whether you leave with a term sheet.
Key Takeaways
- 38% of startup funding rejections trace back to weak or incomplete financial models, according to CB Insights post-mortem analysis of failed fundraising rounds.
- An investor-ready financial model requires 5 non-negotiable components: three-statement integration, 12-18 months of monthly granularity, scenario modeling, unit economics, and sensitivity analysis.
- EFM offers 3 service tiers: downloadable industry-specific templates (customizable in 2-3 days), expert model reviews with 48-72 hour turnaround, and fully custom builds delivered in 1-2 weeks.
- Pre-seed founders need a different model structure than Series A companies: pre-seed focuses on unit economics and burn rate, while Series A demands cohort analysis, CAC payback periods, and revenue bridge modeling.
- The 5 most common model errors that kill deals are circular references, missing cash flow statements, hockey-stick projections without driver justification, hardcoded assumptions, and broken formula links.
- Professional financial models reduce average investor Q&A time by allowing founders to answer scenario questions live, directly from the model.
- EFM templates follow CFA-reviewed formatting standards and VC-tested structures used by institutional investors at the seed through Series B stages.
What Makes a Financial Model Truly Investor-Ready?
An investor-ready financial model is a fully integrated, assumption-driven document that lets any investor stress-test your business without asking you a single clarifying question. It is not a spreadsheet with revenue guesses and a profit line.
Here are the 5 criteria every serious investor checks within the first 10 minutes of opening your model:
1. Three-Statement Integration
A three-statement model links your income statement (revenue and expenses), balance sheet (assets, liabilities, equity), and cash flow statement into a single dynamic system. When you change one assumption, all three statements update automatically. Many founder-built models have an income statement and nothing else. Investors treat a missing cash flow statement as a red flag, because cash flow, not profit, determines whether a company survives.
2. Monthly Granularity for 12-18 Months, Then Quarterly
Investors want to see monthly detail for the near term because that is where hiring decisions, runway calculations, and milestone timing live. Beyond 18 months, quarterly projections are acceptable. Annual-only models signal that the founder has not thought through operational timing.
3. Scenario Modeling
Scenario modeling means building at least 3 versions of your forecast: a base case (most likely outcome), a bull case (upside if key assumptions outperform), and a bear case (downside if growth is slower or costs are higher). Investors use the bear case to assess whether the company survives a bad quarter. A model with only one scenario tells investors you have not stress-tested your own business.
4. Unit Economics Clarity
Unit economics are the per-customer or per-transaction economics of your business. For a SaaS company, the key metrics are Customer Acquisition Cost (CAC, the total sales and marketing spend divided by new customers acquired) and Lifetime Value (LTV, the average revenue per customer multiplied by gross margin and average customer lifespan). Investors expect LTV to be at least 3 times CAC for a SaaS business.
Source: First Round Capital
Source: Andreessen Horowitz
5. Sensitivity Analysis
Sensitivity analysis (also called a data table or tornado chart) shows how your key output, usually net revenue or cash runway, changes when you vary one or two input assumptions. Excel supports up to 2 input variables in a single data table.
This is why most sensitivity tables in financial models are structured as two-variable grids showing the interaction between your two most critical assumptions. For example: what happens to your 24-month runway if your monthly churn rate increases from 2% to 4%? A model without sensitivity analysis forces investors to run those calculations themselves, which they will not do.

Investors check these 5 criteria within the first 10 minutes of opening a financial model. Missing any one of them raises an immediate red flag.
Why Most Founder-Built Models Fail Due Diligence
Founder-built models fail due diligence not because founders are unsophisticated, but because financial modeling is a specialized skill that takes years to develop. According to CB Insights, 38% of startups that fail to raise cite investor concerns about financial projections as a contributing factor.
The 5 most common errors EFM identifies in submitted models are:
- Circular references: A circular reference occurs when a formula refers back to its own cell, creating an infinite loop. Excel flags these with a warning, but many founders ignore it. Circular references cause models to produce incorrect outputs silently, which investors discover during due diligence. Excel can handle iterative calculations to resolve circular references, but only when iteration is explicitly enabled and capped — by default Excel allows up to 100 iterations before stopping, meaning unintentional circular references almost always produce wrong numbers rather than correct ones.
- Missing cash flow statements: Revenue minus expenses does not equal cash. Working capital changes, capital expenditures, and debt repayments all affect cash. A model without a cash flow statement cannot tell you when you run out of money.
- Hockey-stick projections without driver justification: A hockey-stick projection shows flat or slow growth followed by a sudden vertical spike. Investors accept hockey sticks only when the model shows the specific drivers (a new sales hire, a partnership launch, a product release) that cause the inflection. Without those drivers, the projection is fiction.
- Hardcoded assumptions: Hardcoding means typing a number directly into a formula instead of referencing a dedicated assumption cell. A model where you cannot change the growth rate in one place and have it flow through every calculation is not a model. It is a static table.
- Broken formula links: When a model is copied, moved, or restructured, relative cell references break. Investors who open a model and see #REF! or #VALUE! errors stop reading.
EFM’s review process catches all 5 categories before your model reaches an investor’s inbox.

These 5 model errors are the most common reasons investors stop reading a financial model during due diligence.
EFM’s Three-Tier Approach: Templates, Reviews, and Custom Builds
EFM meets founders at every stage of the fundraising journey with 3 distinct service tiers, each designed for a different level of model maturity and budget.
Tier 1: Industry-Specific Downloadable Templates
EFM’s startup financial model templates are pre-built with industry-specific assumptions, driver structures, and formatting that matches institutional investor expectations. A founder can download a SaaS template, replace the assumptions with their own numbers, and have a presentation-ready model in 2-3 days.
Each template includes a three-statement model, scenario toggle, unit economics dashboard, and sensitivity tables. Templates are available for SaaS, marketplace, hardware, biotech, and 40+ other verticals.
Tier 2: Expert Model Review and Consultation
If you have already built a model and want a professional audit before your next pitch, EFM’s review service delivers a structured assessment with a 48-72 hour turnaround. The review covers formula integrity, assumption benchmarking against industry data, three-statement linkage, and a written summary of gaps with recommended fixes.
This tier suits founders who are 2-4 weeks from a pitch and need validation, not a rebuild.
Tier 3: Fully Custom Model Builds
For founders raising Series A or above, or for businesses with complex revenue structures (multi-product, multi-geography, or hardware plus software), EFM builds fully custom models from scratch. Custom builds are delivered in 1-2 weeks and include a live working session where EFM walks the founder through every assumption so they can defend the model in investor Q&A.
Custom builds include ongoing support for 30 days post-delivery, covering model updates as investor feedback arrives.

EFM’s three service tiers match founders at every stage: from a 2-3 day template customization to a fully custom 1-2 week model build.
Industry-Specific Model Requirements
Different business models require different financial structures. A SaaS model and a hardware model share the same three-statement skeleton, but the KPIs, margin structure, and investor expectations are entirely different.
| Metric | SaaS | Hardware | Marketplace | Biotech |
|---|---|---|---|---|
| Key Revenue Driver | MRR/ARR | Units Sold | GMV | Milestones |
| Gross Margin Target | 70-80% | 30-50% | 50-70% | N/A (pre-revenue) |
| Primary KPI | LTV:CAC | Inventory Turns | Take Rate | Burn to Milestone |
| Investor Focus | Churn, NRR | BOM Cost, Yield | Liquidity, Cohorts | IP, Trial Data |
| Monthly Detail Needed | 24 months | 18 months | 24 months | 36 months |
SaaS investors benchmark LTV:CAC ratios and net revenue retention (NRR, the percentage of recurring revenue retained from existing customers including expansions). Hardware investors focus on bill-of-materials (BOM) cost and gross margin at scale. Marketplace investors want to see take rate (the percentage of each transaction the platform keeps) and cohort-level retention. Biotech investors model burn rate against clinical trial milestones rather than revenue.
EFM’s financial projections templates are structured around these sector-specific KPI sets so the right metrics appear on page one of your model.

Each industry vertical requires a different KPI structure: SaaS investors focus on LTV:CAC while biotech investors model burn rate against clinical milestones.
Worked Example: SaaS Unit Economics in a Three-Statement Model
Here is how a SaaS unit economics calculation flows into a three-statement model. Assume the following inputs:
- Monthly new customers: 50
- Average Revenue Per User (ARPU): $200/month
- Gross margin: 75%
- Monthly churn rate: 2%
- Sales and marketing spend (monthly): $30,000
Step 1: Calculate CAC
CAC = Monthly S&M spend / New customers acquired = $30,000 / 50 = $600 per customer
Step 2: Calculate LTV
Average customer lifespan = 1 / churn rate = 1 / 0.02 = 50 months
LTV = ARPU x Gross margin x Average lifespan = $200 x 0.75 x 50 = $7,500
Step 3: Calculate LTV:CAC ratio
LTV:CAC = $7,500 / $600 = 12.5x
This ratio of 12.5x exceeds the 3x minimum benchmark, which means the business is acquiring customers efficiently. This figure flows into the income statement as a validated marketing efficiency metric, into the cash flow statement as the timing of S&M spend versus revenue recognition, and into the balance sheet as deferred revenue (subscription payments received before the service period ends).
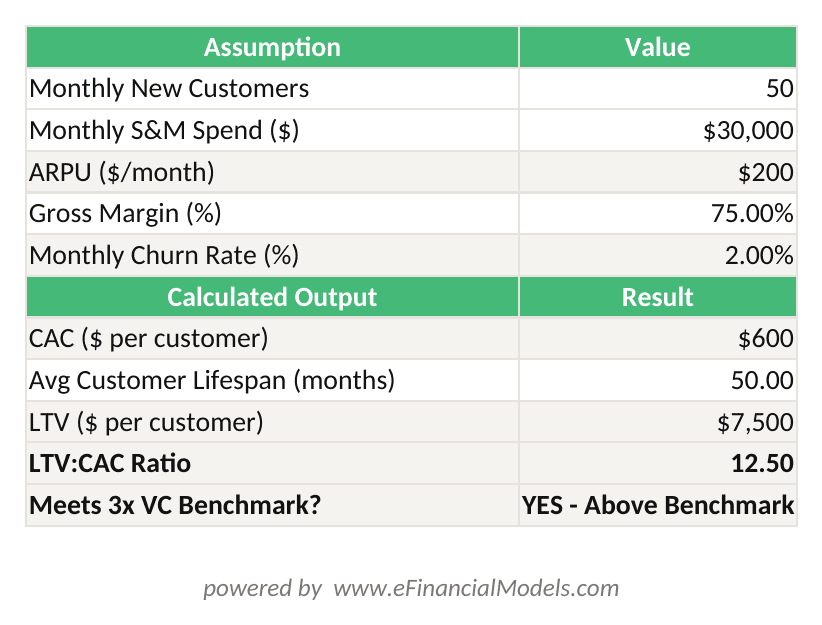
SaaS Unit Economics: CAC = S&M Spend / New Customers; LTV = ARPU × Gross Margin × (1/Churn Rate); LTV:CAC = LTV / CAC. A ratio above 3x meets the VC minimum benchmark.

A 12.5x LTV:CAC ratio signals strong customer acquisition efficiency and flows directly into the three-statement model as a validated marketing metric.
Our Certification Standards and Quality Framework
EFM models follow a structured quality framework built on 3 pillars: formula integrity, assumption benchmarking, and presentation standards.
Formula Integrity: Every EFM model passes an automated audit for circular references, broken links, hardcoded values in formula cells, and division-by-zero errors before delivery. EFM uses a structured model review checklist aligned with best practices published by the Financial Modeling Institute (FMI), the body that administers the Advanced Financial Modeler (AFM) certification.
Assumption Benchmarking: EFM benchmarks every key assumption against sector-specific data from sources including PitchBook, Crunchbase, and publicly available VC portfolio benchmarks. Growth rates, margin targets, and churn assumptions are flagged if they fall outside the 25th-75th percentile range for comparable companies at the same stage.
Presentation Standards: EFM models follow a color-coding convention used by institutional investors: blue cells for inputs (assumptions the user changes), black cells for formulas (calculated outputs), and green cells for links from other sheets. This convention, standard in investment banking and private equity, signals to investors that the model was built by someone who understands professional modeling norms.
All three-statement financial models delivered by EFM include a dedicated assumptions sheet, a summary dashboard, and a print-ready investor output tab.

EFM’s quality framework covers formula integrity, sector-specific assumption benchmarking, and institutional investor presentation standards.
How the Process Works: From Intake to Investor Presentation
EFM’s engagement process follows 4 stages regardless of which service tier you choose.
Stage 1: Model Assessment (Day 1)
You submit your existing model (or describe your business if starting from scratch). EFM reviews the structure, identifies the 3-5 highest-priority gaps, and delivers a written assessment with a recommended path forward.
Stage 2: Scoping and Kickoff (Day 1-2)
EFM confirms the deliverable scope, timeline, and assumptions package. For custom builds, a 60-minute kickoff call covers your business model, revenue drivers, cost structure, and fundraising timeline.
Stage 3: Build or Review (Days 2-14 depending on tier)
Template customization: 2-3 days. Model review: 48-72 hours. Custom build: 7-14 days. EFM delivers a draft for your review before finalizing.
Stage 4: Investor Preparation (Final day)
EFM walks you through the model so you can answer investor questions confidently. For custom builds, this includes a 90-minute Q&A simulation where EFM plays the role of a skeptical investor asking about your assumptions.

EFM’s 4-stage process moves from initial assessment to investor-ready delivery in as few as 3 days for template reviews or up to 14 days for custom builds.
Pricing and Engagement Models for Every Fundraising Stage
EFM’s pricing reflects the scope of work at each tier, with transparent structures that match where founders are in their fundraising journey.
| Service | Delivery | Best For | Starting Price |
|---|---|---|---|
| Template Download | Instant | Pre-seed, bootstrapped | From $97 |
| Model Review | 48-72 hrs | Seed, pre-pitch | From $497 |
| Custom Build | 1-2 weeks | Series A/B, complex models | From $2,500 |
| Ongoing Support | Monthly retainer | Active fundraising | From $750/mo |
For context, fractional CFO services for model builds typically range from $5,000 to $15,000 per engagement according to industry surveys of finance consulting rates. EFM’s custom build tier delivers institutional-quality output at a fraction of that cost because EFM uses structured templates as a foundation rather than building from a blank spreadsheet.
EFM also offers free financial model templates for founders who want to explore the structure before committing to a paid tier.

EFM’s pricing ranges from $97 for instant template downloads to $2,500+ for fully custom builds, compared to $5,000-$15,000 for fractional CFO engagements.
Frequently Asked Questions About Investor-Ready Financial Models
What is the difference between a financial model and a financial projection?
A financial projection is a single forecast of future revenue and expenses, usually presented as a table or chart. A financial model is a dynamic, assumption-driven system where changing one input (like your growth rate or churn rate) automatically updates every output across all three financial statements. Investors require models, not projections, because they need to stress-test your assumptions. A projection tells them what you think will happen. A model lets them test what happens if you are wrong. For a pre-seed company, even a simple model with 10-15 clearly labeled assumptions is more credible than a polished projection with no visible logic.
How detailed does my financial model need to be for a seed round?
For a seed round (typically $500K to $3M), investors expect monthly detail for at least 12 months, a clear unit economics section showing CAC and LTV or equivalent metrics for your business model, a three-statement structure (income statement, balance sheet, cash flow), and at least a base case and bear case scenario. You do not need a 50-tab model. A clean, 5-7 tab model with clearly labeled assumptions, a summary dashboard, and a cash runway chart will outperform a complex model with broken formulas. According to First Round Capital’s founder resources, clarity and defensibility of assumptions matter more than model complexity at the seed stage.
What are the most common reasons investors reject financial models during due diligence?
The 5 most common rejection triggers are: (1) missing cash flow statement, which makes it impossible to verify runway; (2) circular references that produce incorrect outputs; (3) growth assumptions that are not tied to specific operational drivers like headcount, marketing spend, or channel partnerships; (4) gross margin assumptions that are inconsistent with industry benchmarks (for example, a SaaS company projecting 40% gross margins when the sector average is 70-80%); and (5) a single-scenario model with no downside case. CB Insights analysis of failed fundraising rounds identifies financial model quality as a contributing factor in 38% of cases where founders cited investor feedback.
Can EFM work with the model I have already built?
Yes. EFM’s Tier 2 review service is specifically designed for founders who have an existing model and want a professional audit before their next pitch. EFM does not replace your work. The review identifies structural issues (broken formulas, missing statements, circular references), benchmarks your assumptions against sector data, and delivers a written report with prioritized fixes. Most founders who use the review service can implement the recommended changes themselves within 1-2 days. For more complex structural issues, EFM can rebuild specific sections while preserving the parts of your model that are working correctly.
How long does it take to build an investor-ready financial model from scratch?
For a template-based approach, a founder with basic Excel skills can customize an EFM industry-specific template in 2-3 days. For a custom build, EFM delivers in 7-14 days depending on business complexity. By comparison, founders who build models from scratch without a template typically spend 40-80 hours over 3-6 weeks, often producing a model that still has structural gaps. The time savings from using a professional template or custom build service are significant, but the more important benefit is avoiding the errors that cause investors to lose confidence in your numbers during due diligence.
What is a sensitivity analysis and do I really need one?
Sensitivity analysis is a table or chart that shows how your key output metric (usually net revenue, EBITDA, or cash runway) changes when you vary one or two input assumptions across a range of values. For example, a two-variable sensitivity table might show how your 24-month cash runway changes as your monthly burn rate varies from $80K to $120K and your monthly revenue growth rate varies from 5% to 15%. Investors use sensitivity tables to quickly identify the assumptions your model is most sensitive to, which tells them where the real risk in your business lies. Every EFM model includes at least one sensitivity table as a standard deliverable.
Does EFM offer models for non-SaaS businesses like hardware or biotech?
Yes. EFM builds and reviews models across 40+ industry verticals including hardware, biotech, marketplace, e-commerce, real estate, fintech, and consumer goods. Each vertical has different KPI structures, margin benchmarks, and investor expectations. A hardware model needs a bill-of-materials cost build-up, inventory financing assumptions, and gross margin at different production volumes. A biotech model needs a milestone-based burn schedule, probability-weighted revenue scenarios tied to clinical trial outcomes, and a cash runway analysis that extends to the next fundable milestone. EFM’s financial model templates include sector-specific versions for each of these verticals.
Build the Model That Gets the Meeting and Closes the Round
Investors fund businesses they understand. A professional financial model is the clearest signal that you understand your own business: your unit economics, your cash needs, your growth drivers, and your risks. It does not guarantee a yes, but a broken or incomplete model guarantees a no.
EFM has helped founders across pre-seed to Series B stages build models that survive due diligence and support confident investor conversations. Whether you need a template you can customize this week, a professional review of your existing model before Thursday’s pitch, or a fully custom build for a complex business, EFM has a structured path for you.
I recommend starting with EFM’s startup financial model templates to assess where your current model stands, then scheduling a free 30-minute model assessment consultation to get a customized roadmap for making your model investor-ready before your next pitch.























































