0 ITEMS

How Long Until Break-Even? A Founder’s Timeline Guide

Time to break-even, also called payback, is the number of months until a new venture’s cumulative cash, which starts at minus the launch spend, returns to zero, and in a venture that ramps up gradually it arrives long after the first profitable month. In the illustrative example below, a subscription venture turns profitable in month 12, needs 148,540 dollars at its lowest cash point and pays back after 29.5 months.
Key Takeaways
- A founder needs two dates, the first profitable month and the later payback month, when the invested cash is recovered.
- In the illustrative subscription example (USD, before tax and financing), the first profitable month is 12 and payback comes after 29.5 months.
- Peak cash need, 148,540 in the base case of that example, exceeds the 70,000 launch spend because losses continue while customers build.
- Ramp-up speed shifts the date widely: payback runs from 23.5 months in the fast case to 41.5 months in the slow case of the example.
- Fund the cash low point rather than the launch spend alone, and rerun the model whenever price, cost or sales pace changes.
The First Profitable Month and Payback Are Different Dates
The break-even point is the sales level at which total cost and total revenue are equal, according to the U.S. Small Business Administration (SBA) startup cost guide. The month a venture first reaches that level is its first profitable month, the first date a founder needs. The second date is payback, the month in which cumulative cash returns to zero after the launch spend and every early loss have been repaid. Founders often call both dates break-even, so this guide says first profitable month for the first and payback for the second.
A new venture loses money while it builds its customer base, so the two dates sit far apart and the practical question is how long the money has to last.
No Single Benchmark Exists, So the Date Must Be Modeled
A typical time to break-even does not exist across industries, because it depends on cost structure and sales pace, so the timeline comes from the venture’s own numbers. The U.S. Bureau of Labor Statistics (BLS) reported in a January 2024 data note that 34.7 percent of private-sector business establishments born in March 2013 were still operating in March 2023, and that survival fell most in the first year. That figure measures survival in the United States, not profit.
Cash strain is also common. The Federal Reserve Banks’ 2025 Report on Employer Firms found that more than half of small employer firms cited paying operating expenses (56 percent) or uneven cash flows (51 percent) as challenges, in a non-random survey fielded from September to November 2024. The two data sets describe different groups and measure survival and cash strain, not time to break-even.
What Sets the Date
Six inputs decide the two dates. Price minus the variable cost of one customer gives the contribution per customer, which is the amount each customer leaves over to pay fixed costs, the bills that stay constant whatever the sales volume. Break-even customers per month equal fixed costs divided by that contribution, the same logic as the formula in a Missouri extension guide to break-even pricing, revenue and units. The ramp-up speed sets how soon that customer count is reached, while the launch spend and the customer cap affect payback and cash need, and the cap leaves the first profitable month unchanged while it exceeds the break-even customer count.
The method has three outputs. The first profitable month is the first month in which customers times contribution is at least fixed costs. Peak cash need is the size of the lowest point of cumulative cash, which is the launch spend plus every loss made before profit builds. Payback time is the point where cumulative cash returns to zero, interpolated inside its month. The logic fits any industry once customers are replaced by units, visits or projects, and eFinancialModels lists break-even models and startup financial models for readers who want to apply it. A growth-stage owner can apply the same method to an expansion or new product line, using its launch spend as the starting deficit and counting only the extra revenue and costs it creates.
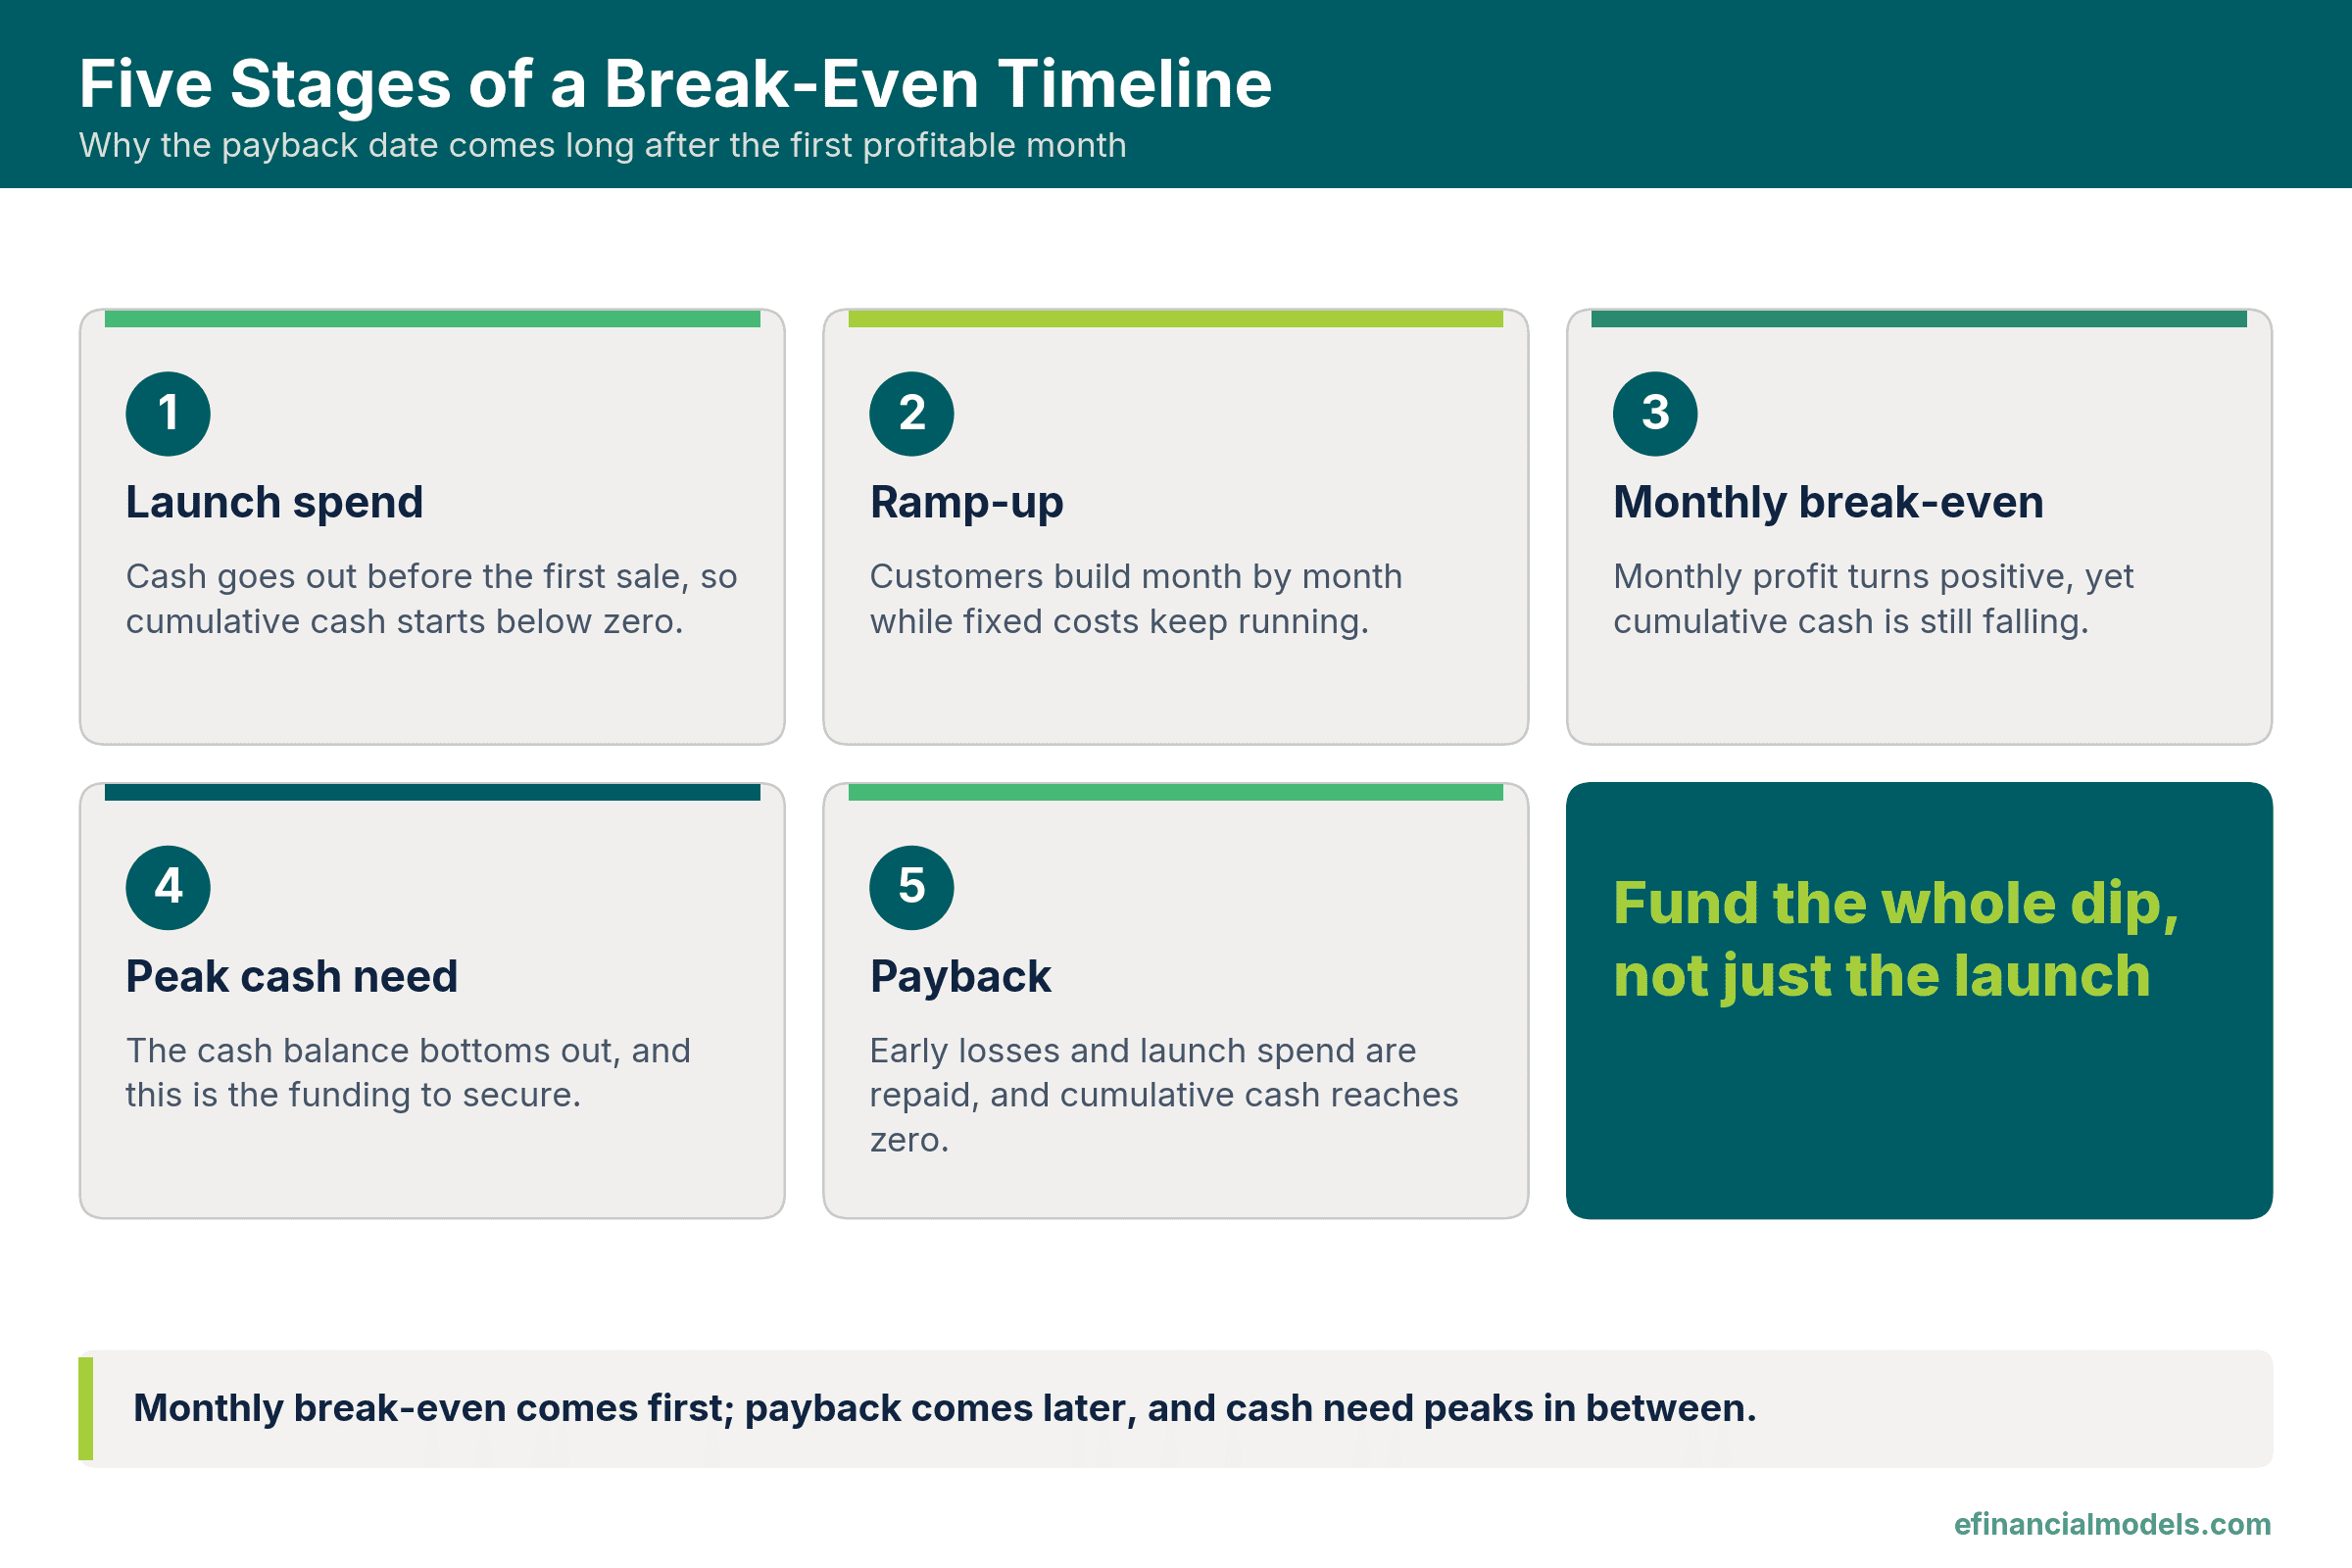
The five stages in order, drawn by eFinancialModels from the method described above.
Worked Example: Three Ramp-Up Speeds and One Cost Increase
All amounts below are in USD, before financing, interest and taxes, and every input is an illustrative assumption. Payback is undiscounted, customer counts are net of cancellations, fixed costs include a founder salary, and the timing of cash collection is ignored. Assume a hypothetical subscription venture with a launch spend of 70,000, fixed costs of 14,700 per month, a price of 150 per customer per month and a variable cost of 45. Assume a cap of 240 customers and, in the base case, 12 net new customers each month. The slow case adds 8 and the fast case adds 16, and a fourth case keeps the base ramp-up but raises fixed costs by 10 percent.
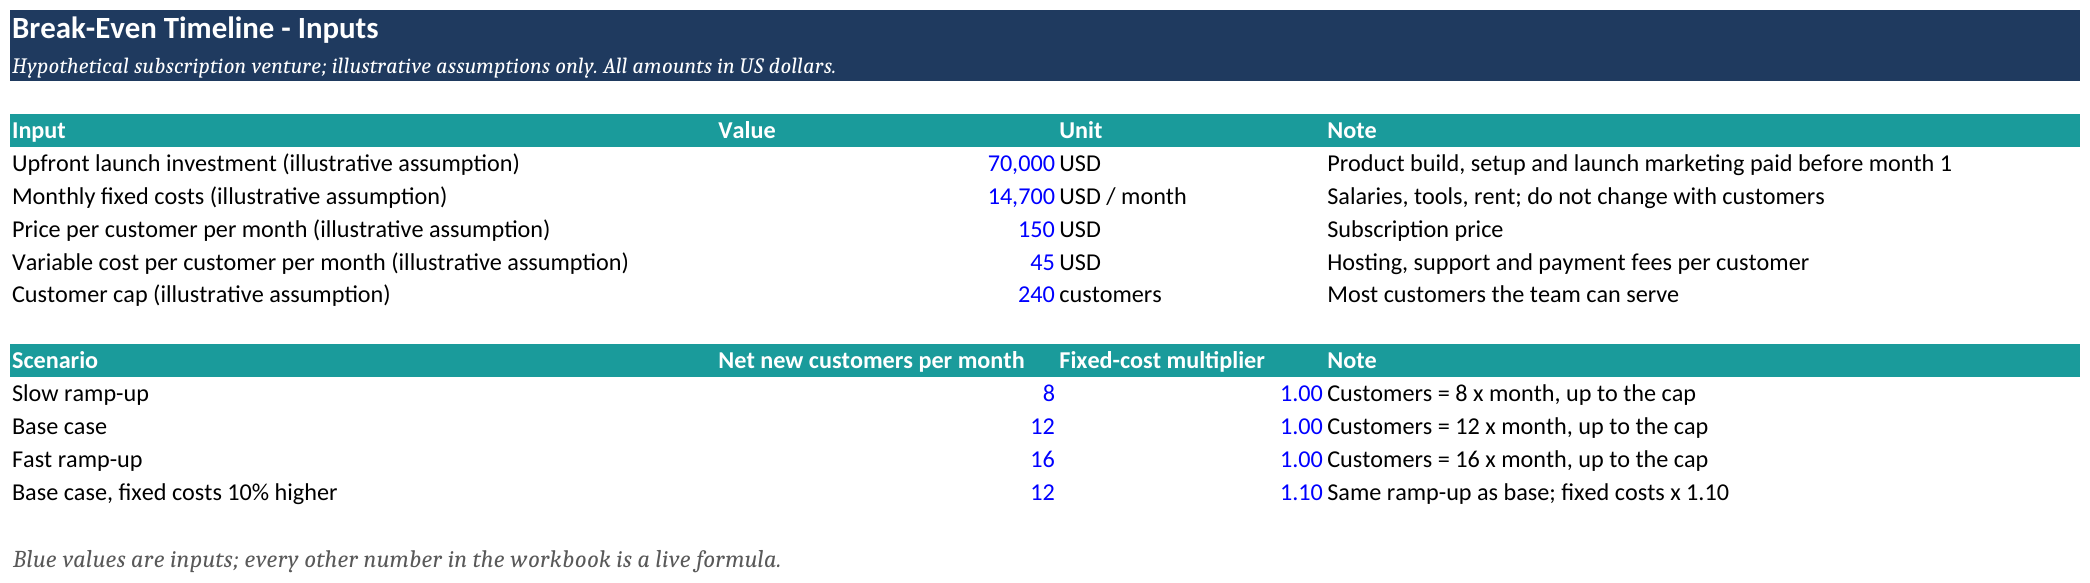
All assumptions sit on one input sheet, so changing a price, a cost or a ramp-up speed updates every scenario. Source: eFinancialModels Analysis
Contribution per customer is 150 minus 45, or 105, so break-even customers are 14,700 divided by 105, or 140 per month. In the base case, month 11 has 132 customers and a loss, while month 12 has 144 customers and a profit of 420. Below the cap, monthly profit equals 1,260 times the month number minus 14,700. Monthly losses in months 1 to 11 are 13,440, 12,180, 10,920, 9,660, 8,400, 7,140, 5,880, 4,620, 3,360, 2,100 and 840, which total 78,540. Cumulative cash therefore bottoms out in month 11 at minus 148,540, so the peak cash need is 148,540, the 70,000 launch spend plus those losses. Monthly profits in months 12 to 20 add 49,140 (1,260 times 144, minus 14,700 times 9), leaving minus 99,400 when customers reach the cap in month 20. From then on, profit is 10,500 per month, so months 21 to 29 add 94,500 (9 times 10,500).
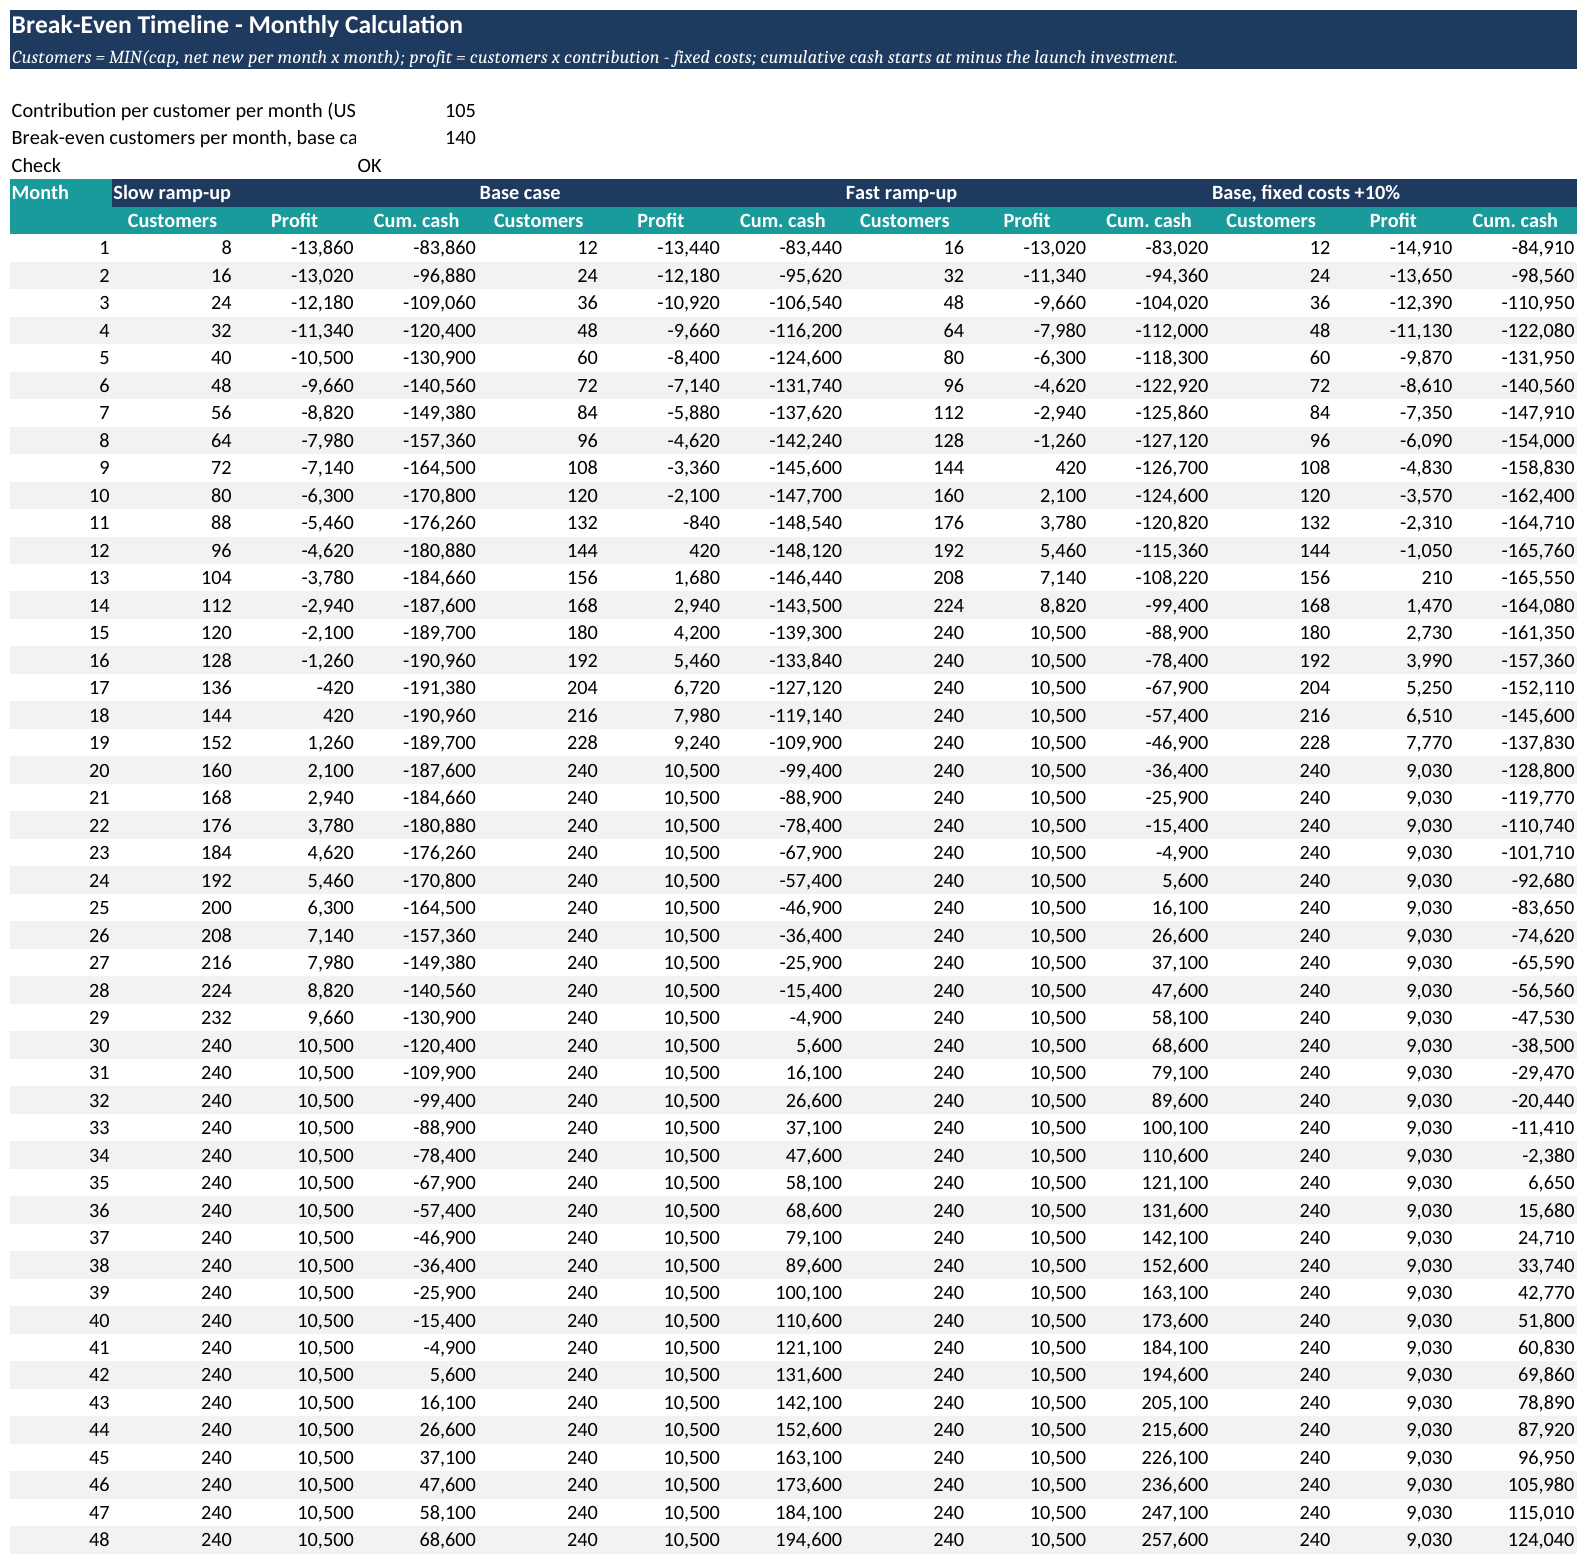
The monthly schedule tracks customers, profit and cumulative cash for each scenario side by side. Source: eFinancialModels Analysis
Cumulative cash is therefore minus 4,900 after month 29, and month 30 adds 10,500, so payback is 29 plus 4,900 divided by 10,500, or 29.5 months. A shortcut would mislead: dividing the 70,000 launch spend by the steady-state profit of 10,500 gives 6.7 months, because it ignores the ramp-up.
| Case | First profitable month | Peak cash need | Payback (months) | Versus base (months) |
|---|---|---|---|---|
| Slow ramp-up (8 per month) | 18 | 191,380 | 41.5 | +12.0 |
| Base case (12 per month) | 12 | 148,540 | 29.5 | 0.0 |
| Fast ramp-up (16 per month) | 9 | 127,120 | 23.5 | -6.0 |
| Base ramp-up, fixed costs 10% higher | 13 | 165,760 | 34.3 | +4.8 |
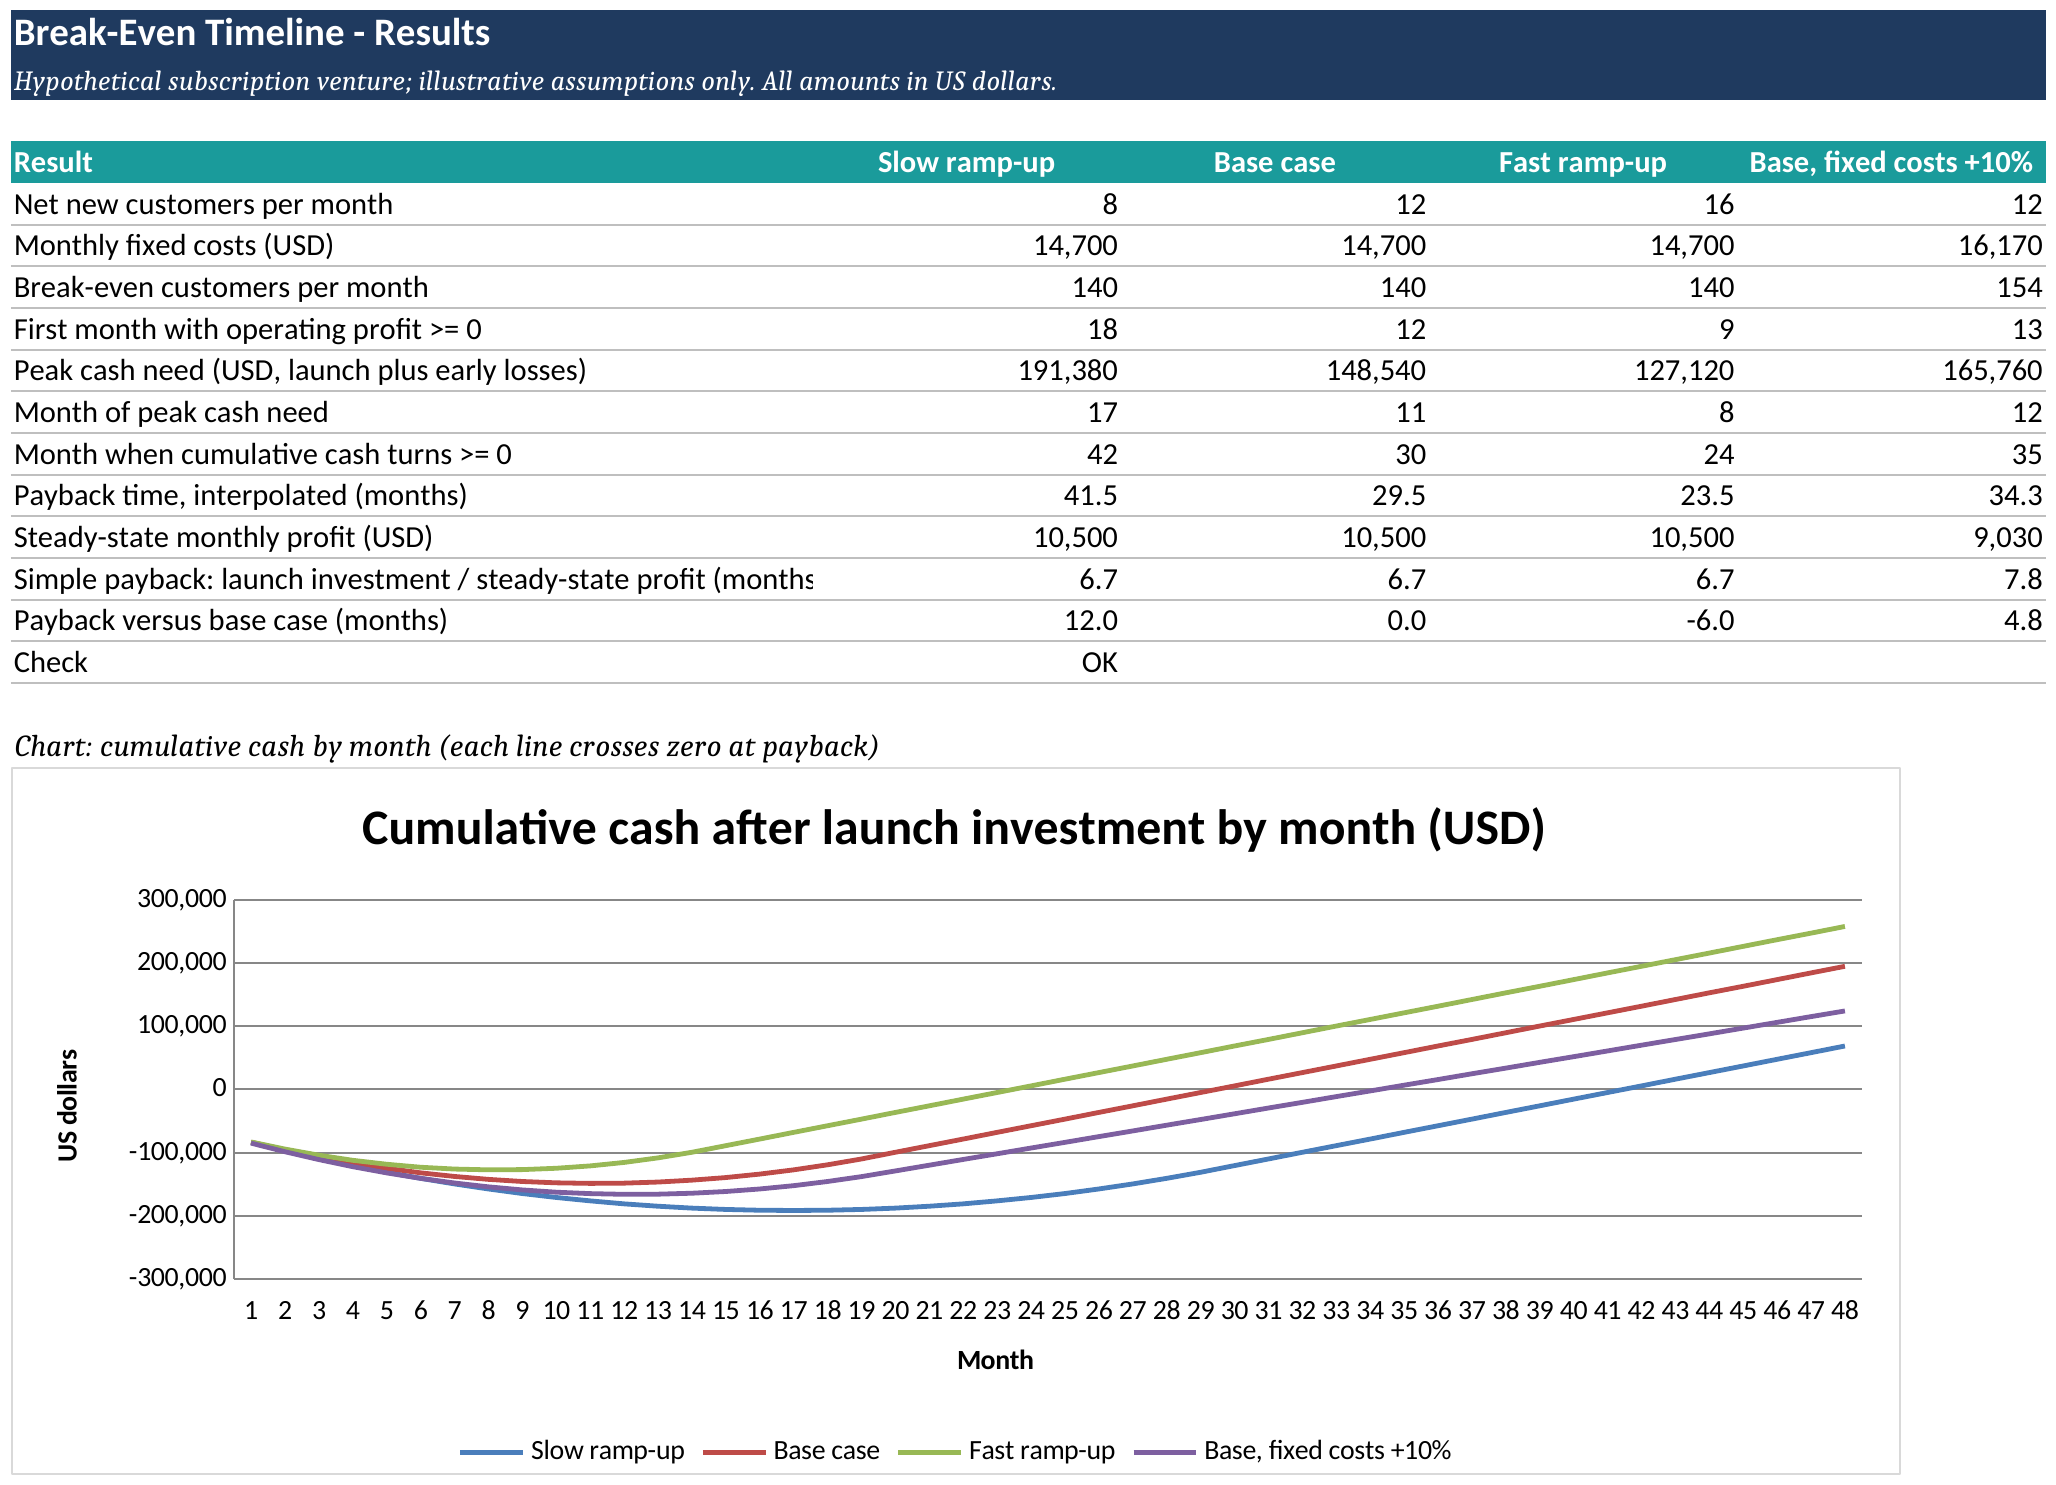
The results sheet compares the scenarios and charts each cumulative cash line crossing zero. Source: eFinancialModels Analysis
The table shows how each input moves the dates. The fast ramp-up saves 6.0 months against the base case and the slow ramp-up costs 12.0, while a 10 percent rise in fixed costs adds 4.8 months and lifts the peak cash need to 165,760. The shocks differ in size, since the ramp-up cases change customer growth by a third each way, so the table does not rank the inputs.
What to Do When the Date Is Too Far Away
Start by funding the cash low point, not the launch spend. In the example, the peak cash need is more than double the launch spend, so a founder who raised only the launch amount would run short of cash almost at once.
Four levers improve the timeline. Raising price or cutting variable cost lifts contribution per customer. Trimming or delaying fixed costs lowers the break-even customer count. Staging the launch spend lowers the peak cash need and, because later outflows leave cumulative cash less negative earlier, can also shorten the payback time, while faster customer acquisition pulls both dates forward. Tax treatment, loan terms and the legal form of any investment sit outside what a break-even model can settle, so an accountant and a lender should review those parts of the plan.
Frequently Asked Questions
Should the break-even date include the owner’s own salary?
Yes, at a realistic market rate. A founder who pays no salary makes fixed costs look smaller and pulls the date forward, but the saving is a personal subsidy rather than a lasting cost reduction. A later hire would raise fixed costs and push break-even back. Showing the salary as a separate line item also lets an investor or lender compare the venture with others on equal terms.
Does borrowing change the break-even date?
Principal repayments are financing cash flows, and interest is a cost of borrowing that sits below operating profit, so neither belongs inside the contribution calculation. A sound check runs the schedule twice, once before financing and once after it, and compares the two paybacks. The gap shows how much of the delay comes from the debt, not from the business itself.
What if customers pay once instead of subscribing?
The same logic works with units sold in place of subscribers. Contribution per unit is the price minus the variable cost, and the break-even volume is fixed costs divided by that contribution. The added risk is timing: customers who pay on credit terms or after delivery turn profit into cash later, so the cumulative cash line should use the dates cash arrives, not the dates of sale.
How often should the timeline be updated?
Monthly during the first year, using actual customers, prices and costs in place of the plan. If actual customer growth lags the forecast by two months, shift the whole growth curve and read the new payback month. Keeping actual and planned figures on one sheet shows early whether the venture is tracking the base case or drifting toward the slow case.
Conclusion
In a venture that ramps up gradually, time to break-even arrives long after the first profitable month, and cash need peaks in between, so a founder should model the whole timeline before committing money. Readers who want ready-made spreadsheets can browse the eFinancialModels General Financial Model Bundle, a collection of ready-made Excel financial model templates.