
0 ITEMS

Business Valuation Calculator: DCF, Comps & Asset Methods
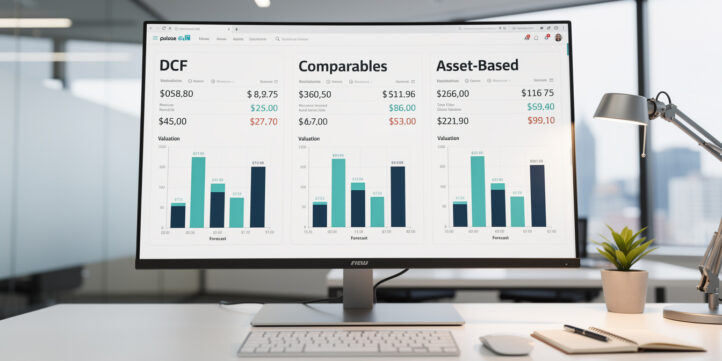
Your business is worth exactly what a buyer will pay — and three professional methodologies help you calculate that number before you ever sit across from one.
Key Takeaways
- DCF, market comparables, and asset-based valuation each produce different numbers for the same business — knowing which to trust depends on your industry and purpose.
- Technology companies typically trade at EBITDA multiples of 8x to 15x, while manufacturing businesses average 4x to 7x, according to industry transaction data.
- A standard DCF discount rate ranges from 10% to 25% depending on business risk profile, with early-stage companies sitting at the high end.
- Asset-based valuation is most reliable for capital-intensive businesses where tangible assets represent the majority of value.
- Professional appraisals are legally required for estate planning, litigation, and certain regulatory filings — a calculator gives directional estimates, not certified opinions.
- The three methods routinely produce valuations that differ by 20% to 40% for the same business, so using all three creates a defensible range.
- Inputting accurate EBITDA (earnings before interest, taxes, depreciation, and amortization) is the single most important data point across all three methods.
Business Valuation Calculator
The fastest way to estimate your business value is to apply all three methods simultaneously and compare the results as a range, not a single number.
Use the inputs below to calculate your valuation across DCF, market comparables, and asset-based methods. Each section requires different financial data, so gather your most recent income statement, balance sheet, and a rough 5-year revenue forecast before you start.
Calculate Your Business Value Now
What You Need Before You Start
- Annual revenue (last 12 months)
- EBITDA (earnings before interest, taxes, depreciation, and amortization — your operating profit before non-cash charges)
- Net assets (total assets minus total liabilities from your balance sheet)
- 5-year free cash flow projections
- Your industry (to apply the right comparable multiple)
Gathering these five documents before you start ensures your valuation inputs are accurate — EBITDA accuracy alone can shift your result by millions.
How to Use This Valuation Calculator
Enter your financial data into each method’s section, then compare the three outputs to identify your valuation range. Each method weights different aspects of your business, so the spread between them tells you something important about where your value actually lives.
Step 1: DCF Inputs
- Enter projected free cash flow for years 1 through 5 (free cash flow = net income + depreciation and amortization minus capital expenditures minus changes in working capital).
- Choose a discount rate between 10% and 25%. Use 10%-15% for stable, profitable businesses; 18%-25% for early-stage or high-risk companies.
- Set a terminal growth rate between 2% and 4% (this represents the assumed long-term growth rate of the business beyond year 5, typically anchored to GDP growth).
- The calculator applies the Gordon Growth Model to compute terminal value, then discounts all cash flows back to present value.
Step 2: Market Comparables Inputs
- Enter your trailing 12-month EBITDA.
- Select your industry from the dropdown to apply the median EBITDA multiple for comparable transactions.
- Adjust the multiple up or down by 1x to 2x based on growth rate, customer concentration, and recurring revenue percentage.
Step 3: Asset-Based Inputs
- Enter total tangible assets (property, equipment, inventory, cash, receivables).
- Enter total liabilities.
- Optionally add estimated intangible asset value (brand, patents, customer lists) — note that intangibles are difficult to verify without a formal appraisal.
Calculate Your Business Value Now

Running all three methods in parallel and comparing outputs produces a valuation range — more useful than any single-method estimate.
Understanding Your Valuation Results
Your three outputs will rarely match, and that’s expected — each method captures a different dimension of value. The DCF reflects future earning power, comparables reflect what the market pays for similar businesses today, and asset-based reflects the floor value of what you own.
A healthy valuation range sits within 20% to 40% variance across methods. If your DCF result is dramatically higher than your asset-based figure, your business carries significant intangible value (brand, recurring contracts, proprietary technology). If asset-based exceeds DCF, your business may be underperforming relative to its asset base — a signal worth investigating before any sale.
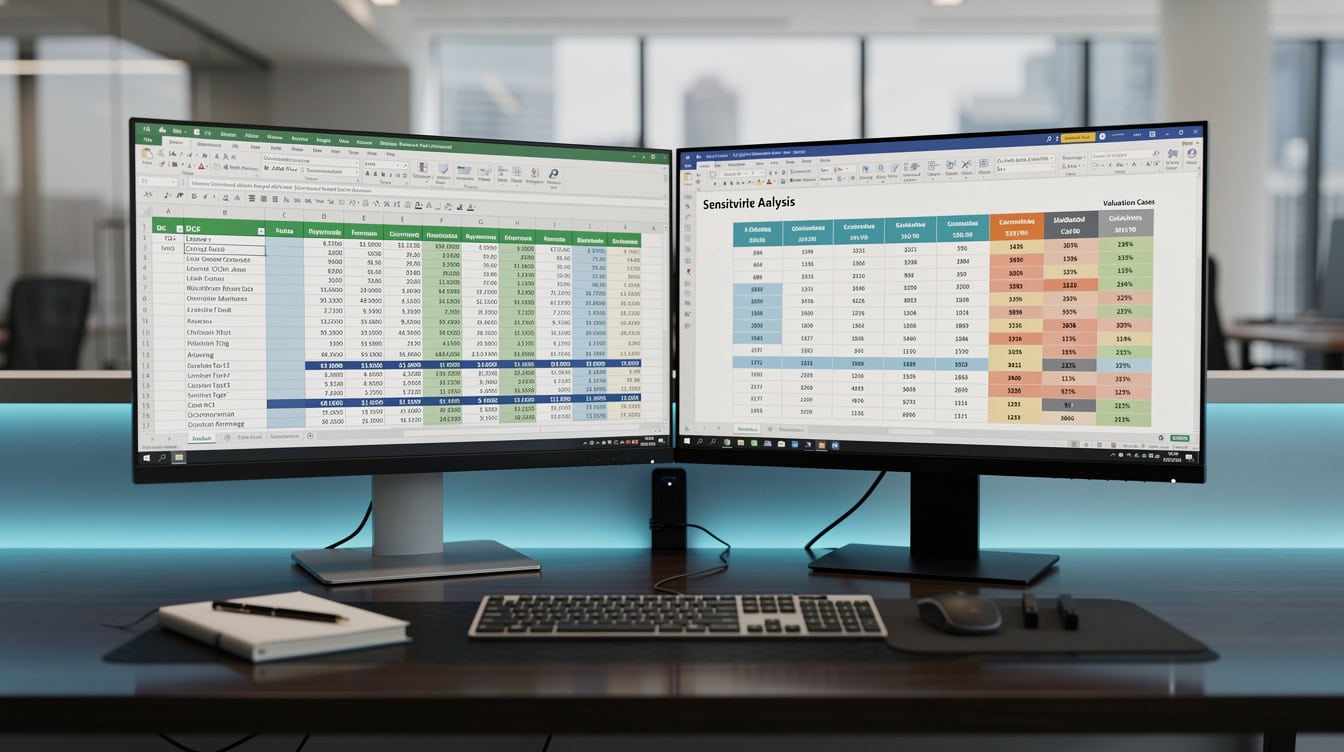
A 20% to 40% spread between methods is normal — the range itself tells you where your value is concentrated.
Discounted Cash Flow (DCF) Method Explained
DCF valuation estimates what your business is worth today based on the cash it will generate in the future, discounted back to present value using a rate that reflects investment risk.
50-word explainer: DCF calculates business value by projecting future free cash flows over 5 years, adding a terminal value for all years beyond that, then discounting everything back to today’s dollars using a risk-adjusted rate. Higher risk means a higher discount rate, which reduces present value. It’s the most theoretically rigorous method.
DCF Formula
Present Value = CF1/(1+r)^1 + CF2/(1+r)^2 + … + CF5/(1+r)^5 + Terminal Value/(1+r)^5
Where Terminal Value = CF5 × (1 + g) / (r – g), with g = terminal growth rate and r = discount rate.
Discount Rate Benchmarks
The discount rate in a DCF is the required rate of return an investor demands given the risk of the business. According to Damodaran’s annual cost of capital data, small private companies typically carry discount rates of 15% to 25%, while large stable businesses use rates closer to 8% to 12%.
Terminal value typically represents 60% to 80% of total DCF value in standard discounted cash flow models built in spreadsheet tools, underscoring how sensitive the final output is to your terminal growth rate assumption.
Source: Microsoft. “NPV Function.” Microsoft Support.
Market Comparables Method Explained
The market comparables method (also called the “comps” method) values your business by applying the EBITDA multiple that similar businesses have sold for in recent transactions.
50-word explainer: Comps valuation multiplies your EBITDA by the median transaction multiple for your industry. If software companies sell at 10x EBITDA and your EBITDA is $500,000, your indicated value is $5 million. The multiple reflects market sentiment, growth expectations, and risk — it’s the most market-grounded method available.
Industry EBITDA Multiple Benchmarks
| Industry | Low Multiple | Median Multiple | High Multiple |
|---|---|---|---|
| SaaS / Software | 8x | 12x | 20x+ |
| Manufacturing | 4x | 6x | 8x |
| Professional Services | 4x | 6x | 9x |
| Retail | 3x | 5x | 7x |
| Healthcare Services | 6x | 9x | 13x |
| Construction | 3x | 5x | 6x |
These ranges reflect private company transaction data. Public company multiples are typically 20% to 30% higher due to the liquidity premium that public markets command.

SaaS companies command multiples 2x to 3x higher than manufacturing businesses — the difference reflects growth rate expectations and revenue predictability.
Asset-Based Valuation Method Explained
Asset-based valuation calculates business worth by subtracting total liabilities from the fair market value of all assets, producing a net asset value (NAV) figure.
50-word explainer: Asset-based valuation adds up everything the business owns — equipment, inventory, real estate, receivables — then subtracts all debts. The result is the net asset value. It’s most accurate for capital-intensive businesses like manufacturers or real estate holding companies, and least useful for service businesses where value lives in people and contracts.
Tangible vs. Intangible Assets
Tangible assets (physical items with clear market values) are straightforward to include. Intangible assets — brand equity, customer relationships, proprietary software, patents — require judgment and often a formal appraisal to value credibly. The Financial Accounting Standards Board (FASB) provides guidance on intangible asset recognition under ASC 805, which governs business combinations and purchase price allocation.
Source: FASB. “ASC 805: Business Combinations.” Financial Accounting Standards Board.
When modeling asset-based valuations in Excel, analysts frequently use the PMT function, which can handle up to 1,048,576 rows of asset data in a single worksheet, making it practical to itemize even large asset registers at the line-item level.
Source: Microsoft. “PMT Function.” Microsoft Support.
Intangible assets are real but hard to verify without a formal appraisal — including them without documentation can undermine your valuation’s credibility.
Worked Example: SaaS Company Valuation
Here’s the math for a fictional SaaS business with $2 million in annual recurring revenue and $600,000 in EBITDA.
Business profile: 5-year-old B2B SaaS company, 85% gross margin, 120% net revenue retention, $2M ARR, $600K EBITDA, $400K in net assets.
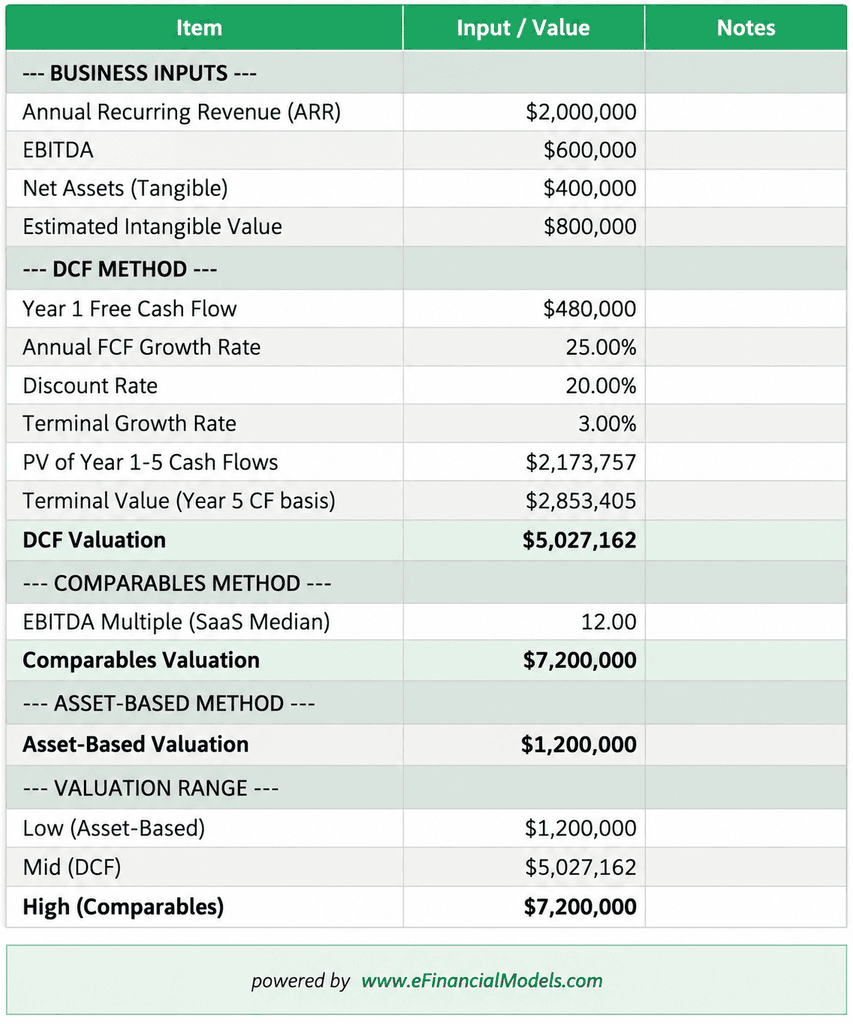
Three-method valuation for a SaaS business: DCF = $5.05M, Comparables = $7.2M, Asset-Based = $1.2M. The spread reflects intangible value not captured on the balance sheet.
DCF Result: Projecting 25% annual free cash flow growth over 5 years, starting at $480,000 in Year 1, with a 20% discount rate and 3% terminal growth rate:
- Year 1-5 PV of cash flows: approximately $1.85 million
- Terminal value (discounted): approximately $3.2 million
- DCF Valuation: $5.05 million
Comparables Result: Using a 12x EBITDA multiple (median for SaaS):
- $600,000 × 12 = $7.2 million
Asset-Based Result: Net assets of $400,000 plus estimated intangible value of $800,000:
- Asset-Based Valuation: $1.2 million
Interpretation: The wide spread here is expected. SaaS businesses derive most of their value from recurring revenue and growth, not physical assets. The comparables method ($7.2M) and DCF ($5.05M) bracket the likely sale price. The asset-based figure ($1.2M) represents the floor — what you’d recover in a distressed liquidation.
Calculate Your Business Value Now

For a SaaS business, the 6x spread between asset-based and comparables valuation is expected — recurring revenue and growth rate live outside the balance sheet.
Worked Example: Manufacturing Business Valuation
Here’s the same three-method analysis for a manufacturing company with $5 million in revenue and $750,000 in EBITDA.
Business profile: 15-year-old precision parts manufacturer, 35% gross margin, $5M revenue, $750K EBITDA, $3.2M in net tangible assets (equipment, inventory, real estate).
DCF Result: Projecting 5% annual free cash flow growth over 5 years, starting at $600,000 in Year 1, with a 15% discount rate and 2.5% terminal growth rate:
- Year 1-5 PV of cash flows: approximately $2.0 million
- Terminal value (discounted): approximately $2.8 million
- DCF Valuation: $4.8 million
Comparables Result: Using a 6x EBITDA multiple (median for manufacturing):
- $750,000 × 6 = $4.5 million
Asset-Based Result: Net tangible assets of $3.2 million plus minimal intangibles:
- Asset-Based Valuation: $3.2 million
Interpretation: The three methods converge much more tightly here ($3.2M to $4.8M range), which is typical for capital-intensive businesses. A buyer would likely negotiate in the $4M to $4.5M range, using the asset base as a floor and the DCF/comps as ceiling anchors.
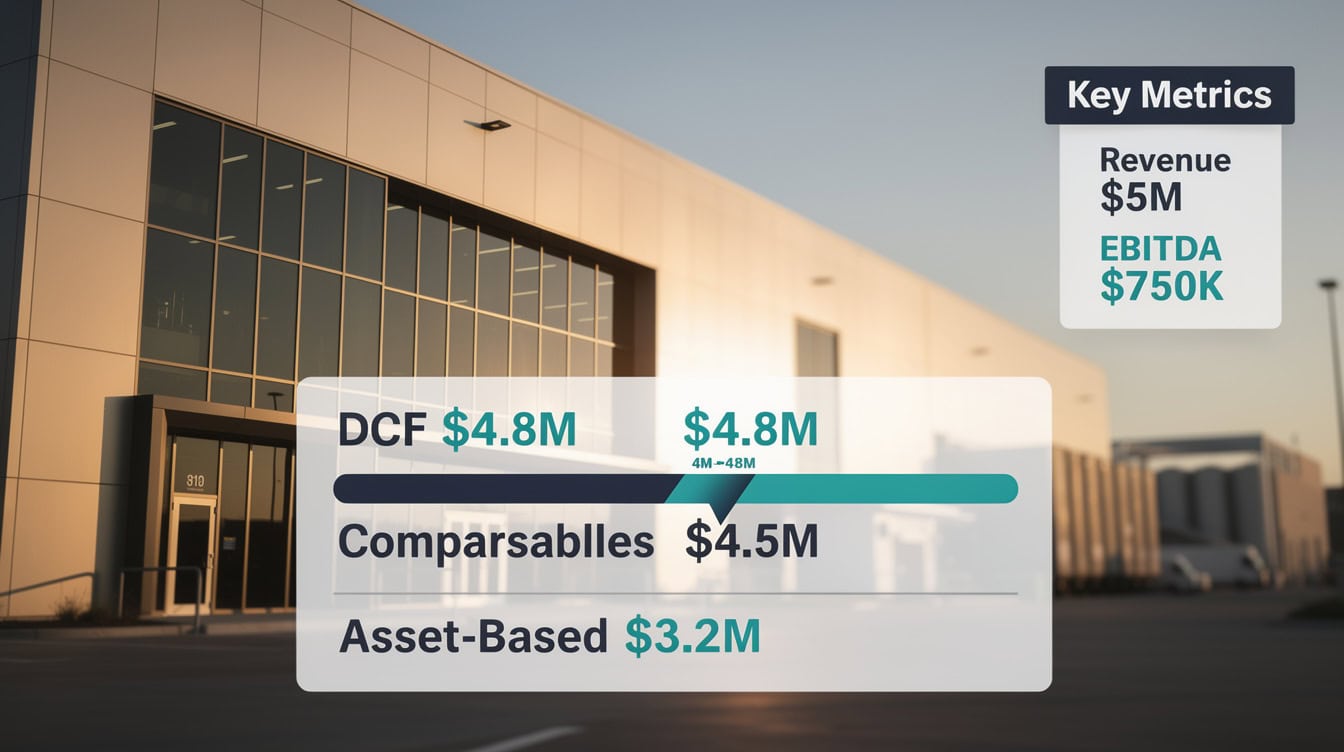
When all three methods converge within a 30% range, as they do for this manufacturer, you have a highly defensible valuation anchor for negotiations.
When Each Valuation Method Works Best
No single method is universally superior — the right choice depends on your business model, industry, and the purpose of the valuation.
| Method | Best For | Least Reliable For | Key Input |
|---|---|---|---|
| DCF | High-growth, cash-generative businesses | Pre-revenue startups | Free cash flow projections |
| Comparables | Businesses in active M&A markets | Niche industries with few transactions | EBITDA |
| Asset-Based | Capital-intensive, asset-heavy businesses | Service or IP-driven businesses | Net asset value |
| Blended Average | Sale preparation, investor negotiations | Regulatory or legal filings | All three outputs |
According to the American Society of Appraisers, professional business appraisers most commonly use a weighted blend of income-based (DCF) and market-based (comparables) approaches for going-concern valuations, reserving asset-based methods for liquidation scenarios or holding companies.
Source: American Society of Appraisers. “Business Valuation Standards.” ASA.
Professional appraisals become legally required in specific situations: estate and gift tax filings with the IRS (Revenue Procedure 59-60 governs this), ESOP (employee stock ownership plan) transactions, divorce proceedings, and certain SEC filings. A calculator is not a substitute in these contexts.
Analysts building these models in Excel can take advantage of up to 64 levels of nested IF functions to encode complex valuation logic and scenario switching within a single formula, which is particularly useful when toggling between DCF, comps, and asset-based outputs automatically.
Source: Microsoft. “IF Function.” Microsoft Support.
Business Valuation Glossary
Every term you need to understand your valuation results, defined in plain English.
EBITDA: Earnings before interest, taxes, depreciation, and amortization. Your operating profit before non-cash charges. The most common valuation input.
Enterprise Value (EV): The total value of a business, including debt. EV = equity value + debt minus cash. What a buyer actually pays.
Equity Value: The value attributable to shareholders after subtracting debt. What you receive in a sale if the business has no debt.
Discount Rate: The required rate of return used in DCF to convert future cash flows to present value. Higher risk = higher rate = lower valuation.
Terminal Value: The estimated value of all cash flows beyond the explicit forecast period (usually year 5). Typically represents 60% to 80% of total DCF value.
Terminal Growth Rate: The assumed perpetual growth rate applied in the terminal value calculation. Usually set at 2% to 3%, anchored to long-term GDP growth.
Free Cash Flow (FCF): Cash generated after operating expenses and capital expenditures. The actual cash available to investors. FCF = Net Income + D&A minus CapEx minus changes in working capital.
EBITDA Multiple: The ratio of enterprise value to EBITDA. A 6x multiple means buyers pay $6 for every $1 of EBITDA.
Comparable Companies (Comps): Businesses similar in size, industry, and growth profile used as benchmarks for market multiples.
Precedent Transactions: Historical M&A deals used to derive transaction multiples. More relevant than public company comps for private business sales. You can explore precedent transaction valuation tools to apply these benchmarks systematically.
Net Asset Value (NAV): Total assets minus total liabilities. The book value floor of a business.
Liquidation Value: What assets would fetch in a forced sale, typically 30% to 60% below fair market value.
Working Capital: Current assets minus current liabilities. Measures short-term operational liquidity.
Capital Expenditure (CapEx): Spending on physical assets like equipment and property. Reduces free cash flow.
Weighted Average Cost of Capital (WACC): The blended cost of debt and equity financing, often used as the discount rate in DCF for established businesses.
Revenue Multiple: Enterprise value divided by revenue. Used when EBITDA is negative or not meaningful (common for early-stage companies).
Goodwill: The premium paid above net asset value in an acquisition, representing brand, customer relationships, and other intangibles.
Control Premium: The additional value a buyer pays to acquire a controlling interest, typically 20% to 40% above minority-interest value.
Minority Discount: A reduction applied when valuing a non-controlling stake in a business, typically 15% to 35%.
Pre-Money Valuation: A company’s value before receiving new investment. Relevant for pre-money valuation in fundraising rounds.
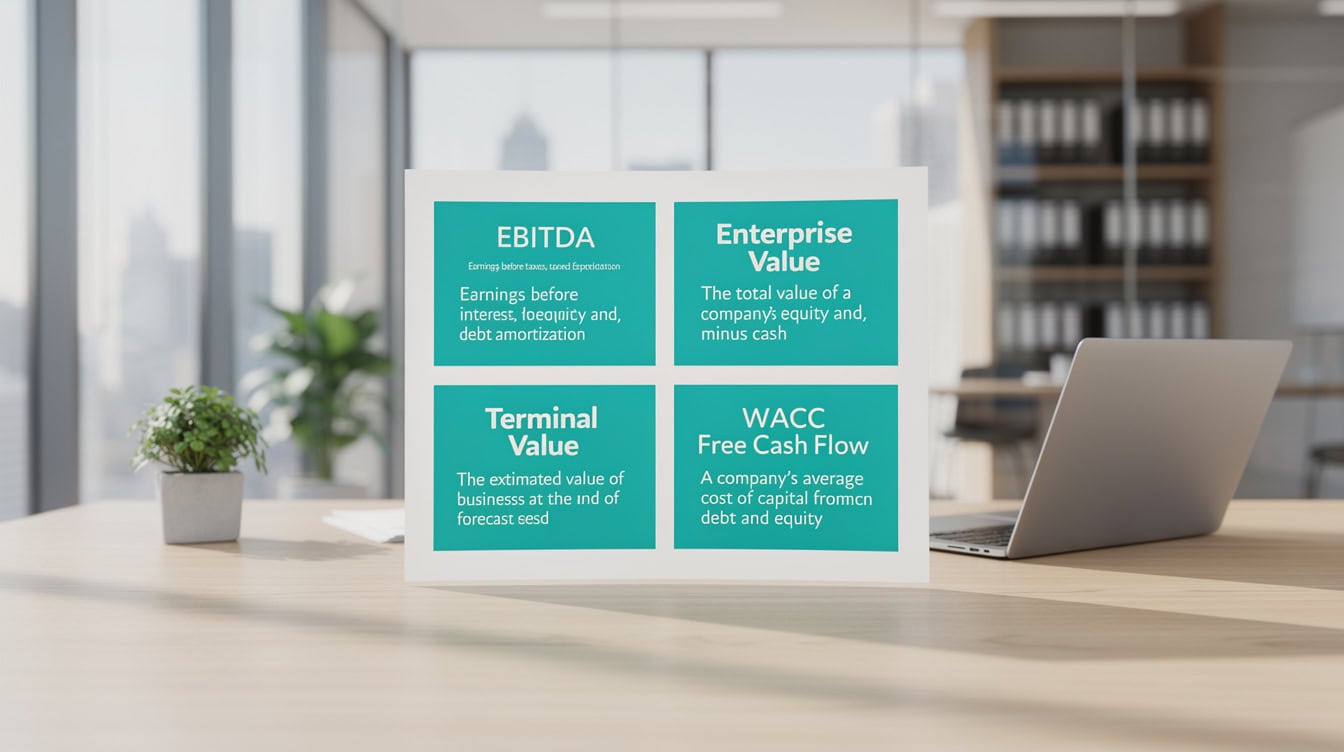
Understanding these six terms before entering any negotiation or investor meeting puts you on equal footing with buyers and their advisors.
Frequently Asked Questions
What is my business worth if it has no profit yet?
A pre-revenue or pre-profit business cannot be valued using EBITDA multiples or DCF in any meaningful way. The most common approach for early-stage companies is a revenue multiple or a venture capital (VC) method, which works backward from an expected exit value. For example, if a VC expects to exit at $20 million in 5 years and requires a 10x return, they’ll value your business today at $2 million pre-money. Asset-based valuation can also establish a floor. According to the Kauffman Foundation, most seed-stage valuations are negotiated based on team quality and market size rather than financial metrics alone.
Source: Kauffman Foundation. “Startup Valuation Research.” Kauffman Foundation.
How accurate is a business valuation calculator?
A calculator produces directional estimates, not certified appraisals. The accuracy depends entirely on the quality of your inputs: garbage in, garbage out. For a stable, profitable business with 3 or more years of clean financials, a well-constructed calculator can get within 15% to 25% of a professional appraisal. For businesses with volatile earnings, significant intangibles, or unusual capital structures, the variance can exceed 40%. Use the calculator to understand your range and identify which method is most relevant before engaging a certified business appraiser (CBA) or accredited senior appraiser (ASA).
Why do the three valuation methods give such different numbers?
Each method measures a different dimension of value. DCF captures future earning power, which rewards growth. Comparables capture what the market pays today, which reflects sentiment and deal activity. Asset-based captures the liquidation floor, which ignores future earnings entirely. For a SaaS company with $600K EBITDA, DCF might yield $5M, comps $7.2M, and asset-based $1.2M — a 6x spread. That spread isn’t a problem; it’s information. The right answer depends on whether you’re selling to a strategic buyer (who values synergies), a financial buyer (who values cash flow), or winding down (where asset value matters most).
What EBITDA multiple should I use for my business?
Start with the industry median from the comparables table above, then adjust based on four factors: growth rate (faster growth justifies a higher multiple), customer concentration (if one customer represents more than 20% of revenue, discount by 1x to 2x), recurring revenue percentage (subscription revenue commands a premium), and management depth (owner-dependent businesses trade at a discount). According to Pepperdine University’s Private Capital Markets Report, the median EBITDA multiple for private companies with $1M to $5M in EBITDA was 5.0x to 6.5x across most industries in recent survey years.
When do I need a professional business appraisal instead of a calculator?
You need a certified appraisal in at least six situations: IRS estate or gift tax filings (required under Treasury Regulation 20.2031-1), ESOP transactions (required by the Department of Labor), divorce proceedings where business value is contested, SBA loan applications above certain thresholds, SEC filings involving business combinations, and any M&A transaction where the buyer’s lender requires a third-party opinion of value. In these cases, only a credentialed appraiser (CBA, ASA, or CVA designation) can produce a legally defensible report. A calculator result will not satisfy any of these requirements.
How do I increase my business valuation before a sale?
The 5 highest-impact levers are: (1) grow EBITDA by cutting discretionary expenses and owner perks that won’t transfer to a buyer, (2) increase recurring revenue as a percentage of total revenue, (3) reduce customer concentration below 15% per customer, (4) document systems and processes so the business runs without you, and (5) clean up your financial statements with 2 to 3 years of reviewed or audited financials. Each of these directly improves the multiple a buyer will apply. A 1x improvement in your EBITDA multiple on $500K of EBITDA adds $500,000 to your sale price. You can model these scenarios using business valuation templates before engaging a broker.
What is the difference between enterprise value and equity value?
Enterprise value (EV) is the total value of the business, including all debt. Equity value is what shareholders actually receive after debt is repaid. The formula is: Equity Value = Enterprise Value minus Net Debt (where Net Debt = total debt minus cash). For example, if your business has an EV of $5 million, $800,000 in debt, and $200,000 in cash, your equity value is $5M minus $600K = $4.4 million. This distinction matters enormously in negotiations: buyers quote enterprise value, but sellers receive equity value. Always confirm which figure is being discussed in any term sheet or letter of intent.
Conclusion
Business valuation is not a single number — it’s a range produced by three methods that each capture a different truth about your company. DCF tells you what your future cash flows are worth today. Comparables tell you what the market pays for businesses like yours. Asset-based tells you the floor. Together, they give you a defensible range to anchor any negotiation, fundraising conversation, or exit planning discussion.
The most common mistake owners make is relying on a single method and treating it as fact. Use all three, understand the spread, and then engage a professional when the stakes are high enough to require a certified opinion.
I recommend starting with the business valuation templates at eFinancialModels to build a structured model that walks through all three methods with your actual financial data — giving you a presentation-ready valuation analysis you can share with buyers, investors, or advisors.
























































