
0 ITEMS

Accounting Rate of Return Formula: 4 Industry Examples
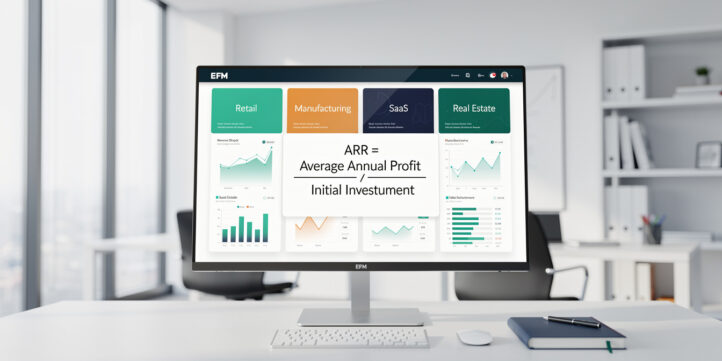
The accounting rate of return (ARR) formula converts average annual accounting profit into a percentage of initial investment, giving finance teams a fast, no-discount-rate screening tool for capital budgeting decisions.
Key Takeaways
- ARR equals average annual profit divided by initial investment, expressed as a percentage — no discounting required.
- A survey by the Association of Chartered Certified Accountants found that roughly 56% of UK firms still use ARR as part of their capital budgeting process alongside NPV and IRR. Source
- ARR ignores the time value of money, making it unreliable as a standalone metric for projects longer than 5 years or with uneven cash flows.
- The 4 worked examples in this article use identical project structures across retail ($250,000), manufacturing ($500,000), SaaS ($180,000), and real estate ($1,200,000) so you can compare ARR results directly.
- ARR above the company’s required rate of return (hurdle rate) signals a preliminary accept; below it signals reject — but always confirm with NPV before committing capital.
- Depreciation method choice (straight-line vs. accelerated) directly changes average annual profit and therefore ARR — a 20% swing is common on 5-year assets.
- Download the free EFM ARR Calculator Template to run all 4 scenarios in Excel with integrated NPV and IRR comparison columns.
What Is the Accounting Rate of Return (ARR)?
ARR is a capital budgeting metric that measures the expected annual accounting profit of an investment as a percentage of the capital committed. Unlike the internal rate of return (IRR) — which finds the discount rate that sets net present value (NPV) to zero — ARR uses accounting profit figures straight from the income statement, making it fast to calculate and easy to communicate to non-finance stakeholders.
Capital budgeting is the process companies use to evaluate major long-term investments. ARR sits at the preliminary screening stage: if a project clears the ARR hurdle, it moves to full NPV/IRR analysis. If it doesn’t, the team saves time by rejecting it early.

ARR sits at Stage 1 of capital budgeting: a fast screen before committing to full NPV/IRR analysis.
Accounting Rate of Return Formula: Complete Breakdown
The ARR formula has two components: average annual profit (the numerator) and initial investment (the denominator).
ARR = Average Annual Profit / Initial Investment × 100
Average Annual Profit is total accounting profit over the project’s life divided by the number of years. Accounting profit equals annual revenue minus operating costs minus depreciation. It is NOT the same as cash flow — depreciation reduces profit but does not consume cash.
Initial Investment is the total capital outlay at project start, including purchase price, installation, and any working capital tied up. Some analysts use average investment ((Initial Investment + Salvage Value) / 2) as the denominator instead; always state which version you’re using.
Salvage value is the estimated residual value of the asset at the end of its useful life. When using the average investment denominator, salvage value raises the denominator and lowers ARR.
Here’s the math for average annual profit:
Average Annual Profit = (Total Revenue over project life − Total Operating Costs − Total Depreciation) / Project Years
And straight-line depreciation (the most common method for ARR calculations):
Annual Depreciation = (Initial Investment − Salvage Value) / Useful Life
The ARR formula has two components: average annual accounting profit (numerator) and initial investment (denominator).
Step-by-Step ARR Calculation: Retail Equipment Example
The fastest way to understand ARR is to work through a complete numerical example with real figures.
Scenario: A retail chain considers buying a new point-of-sale system for $250,000. The system has a 5-year life, a $25,000 salvage value, and is expected to generate $80,000 in additional annual revenue with $30,000 in annual operating costs.
Step 1: Calculate annual depreciation
Annual Depreciation = ($250,000 − $25,000) / 5 = $45,000
Step 2: Calculate annual accounting profit
Annual Profit = $80,000 − $30,000 − $45,000 = $5,000
Step 3: Calculate ARR using initial investment
ARR = $5,000 / $250,000 × 100 = 2.0%
Step 4: Compare to hurdle rate
If the retailer’s hurdle rate (minimum acceptable return) is 8%, this project fails the ARR screen. The team would reject it without spending time on a full DCF model.
Alternative: Using average investment as denominator
Average Investment = ($250,000 + $25,000) / 2 = $137,500
ARR = $5,000 / $137,500 × 100 = 3.6%
Still below the 8% hurdle, but the result is 80% higher just from changing the denominator — which is why stating your ARR method explicitly matters.
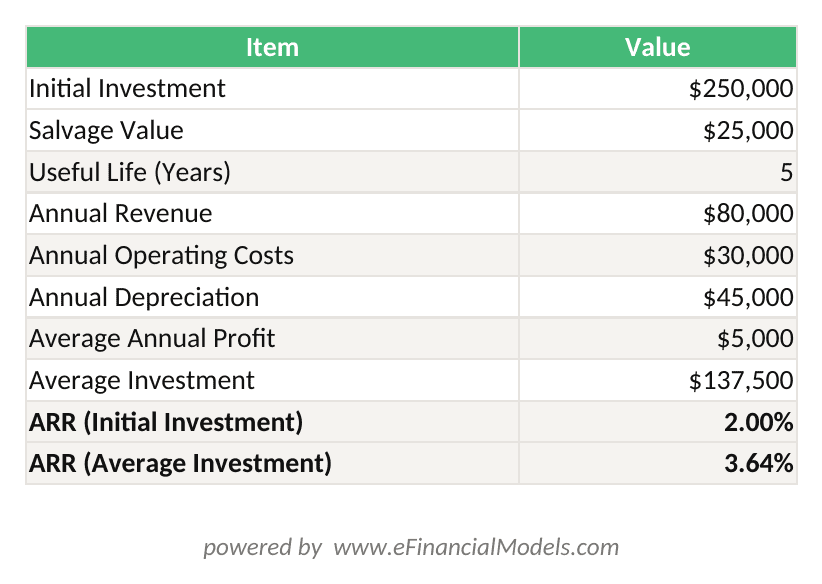
ARR (Initial Investment) = $5,000 / $250,000 = 2.0% | ARR (Average Investment) = $5,000 / $137,500 = 3.6%

The retail POS example produces ARR of 2.0% on initial investment — well below a typical 8% hurdle rate.
Industry-Specific ARR Examples: Manufacturing, SaaS, and Real Estate
ARR produces different signals across industries because asset lives, depreciation schedules, and profit margins vary widely. The three examples below use the same formula structure as the retail example so you can compare results directly.
Manufacturing: $500,000 Machinery Investment
- Initial investment: $500,000
- Useful life: 10 years
- Salvage value: $50,000
- Annual revenue increase: $120,000
- Annual operating costs: $40,000
- Annual depreciation: ($500,000 − $50,000) / 10 = $45,000
- Annual profit: $120,000 − $40,000 − $45,000 = $35,000
- ARR = $35,000 / $500,000 × 100 = 7.0%
Manufacturing firms often set ARR hurdles between 6% and 12% for machinery, according to capital budgeting surveys published by the Financial Management Association. Source At 7.0%, this project sits at the low end but clears a 6% minimum screen.
SaaS: $180,000 Infrastructure Upgrade
- Initial investment: $180,000
- Useful life: 3 years
- Salvage value: $0 (cloud infrastructure has no residual value)
- Annual revenue increase: $90,000
- Annual operating costs: $25,000
- Annual depreciation: $180,000 / 3 = $60,000
- Annual profit: $90,000 − $25,000 − $60,000 = $5,000
- ARR = $5,000 / $180,000 × 100 = 2.8%
SaaS companies typically demand higher returns (15%+ hurdle rates) to compensate for technology obsolescence risk. An ARR of 2.8% would fail most SaaS capital screens, signaling the team should model whether a phased rollout reduces the upfront outlay.
Real Estate: $1,200,000 Commercial Property
- Initial investment: $1,200,000
- Useful life: 25 years
- Salvage value: $400,000
- Annual net operating income: $95,000
- Annual depreciation: ($1,200,000 − $400,000) / 25 = $32,000
- Annual profit: $95,000 − $32,000 = $63,000
- ARR = $63,000 / $1,200,000 × 100 = 5.25%
Real estate investors more commonly use the cap rate (capitalization rate) — net operating income divided by property value — rather than ARR. You can explore cap rate models at the EFM cap rate template library. ARR is still useful here for comparing a property acquisition against non-real-estate capital projects within the same corporate budget.
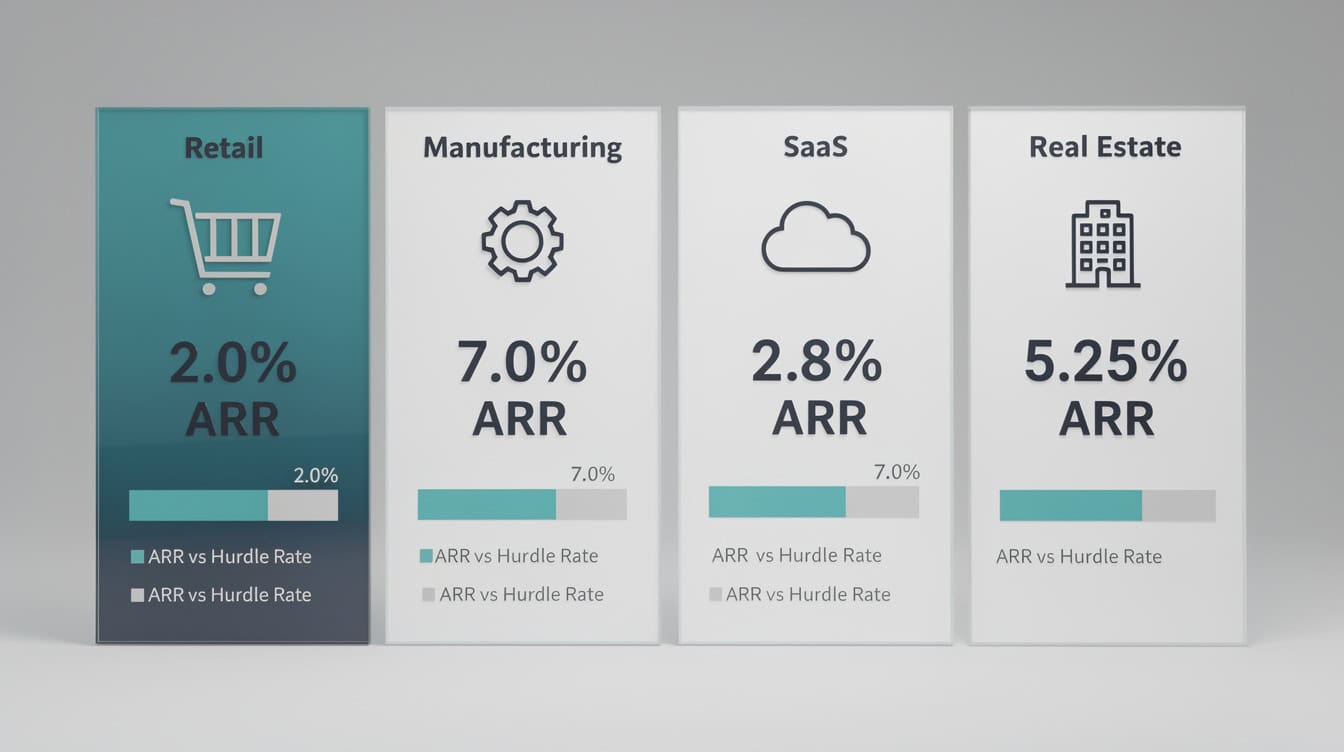
Manufacturing machinery (7.0% ARR) is the only scenario in this article that clears a 6% minimum hurdle rate.
ARR vs. IRR, NPV, ROI, and Payback Period: Comparison Matrix
No single metric tells the whole story. Use this matrix to choose the right tool for each decision stage.
| Metric | Formula Basis | Time Value | Decision Rule | Best Use Case |
|---|---|---|---|---|
| ARR | Accounting profit | Ignores | ARR > Hurdle Rate | Quick screening, short projects |
| IRR | Cash flows | Includes | IRR > Cost of Capital | Ranking mutually exclusive projects |
| NPV | Cash flows | Includes | NPV > 0 | Primary accept/reject decision |
| ROI | Net gain / Cost | Ignores | Higher = Better | Marketing spend, short-term projects |
| Payback | Cash flows | Ignores | Payback < Threshold | Liquidity-constrained decisions |
Decision framework: Start with ARR for a 60-second screen. If ARR clears the hurdle, run NPV and IRR. If NPV is positive and IRR exceeds the weighted average cost of capital (WACC), approve. Use payback period as a tiebreaker when two projects have similar NPVs but different risk profiles.
For projects where you need full IRR modeling across multiple scenarios, the EFM IRR modeling template handles up to 10 simultaneous projects with sensitivity tables built in.
For ROI analysis with detailed breakdowns, the EFM Analytical ROI Calculator provides a structured comparison framework.
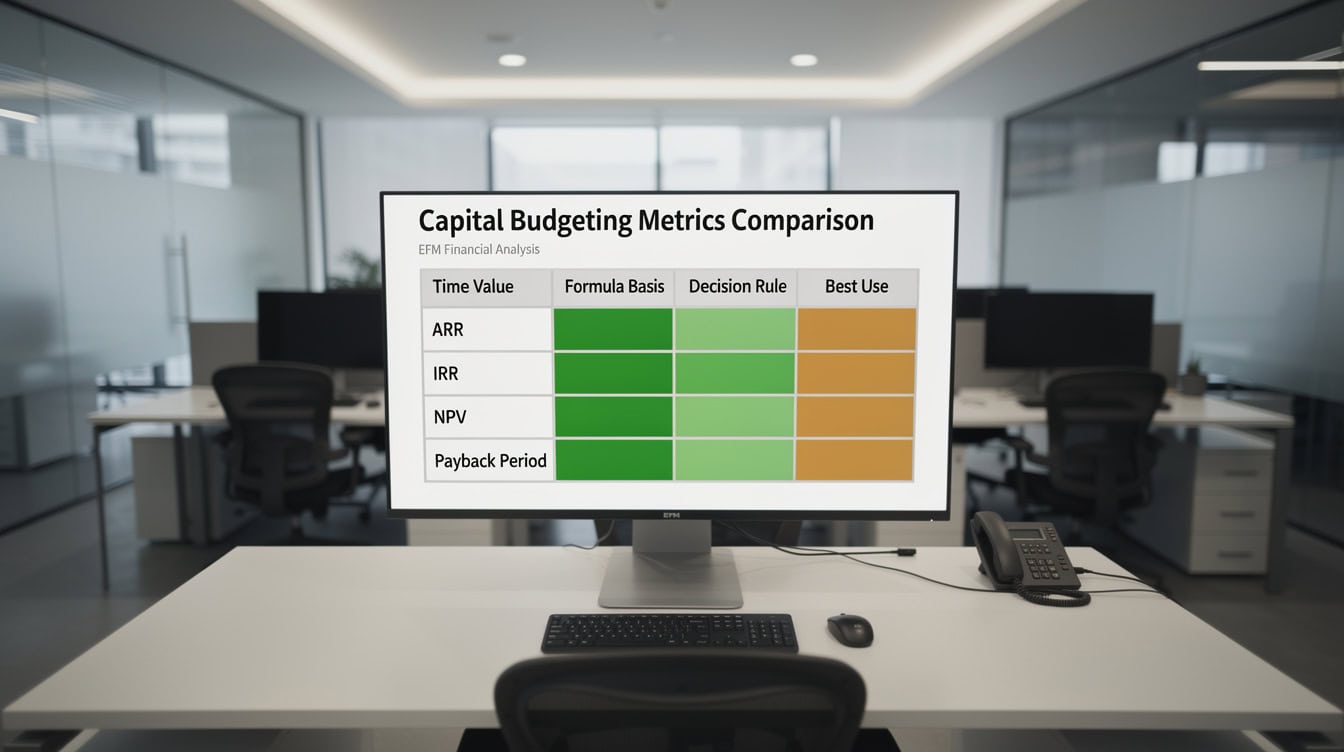
Only NPV and IRR account for the time value of money — ARR, ROI, and Payback Period all ignore it.
When to Use ARR: Advantages and Optimal Scenarios
ARR works best as a fast, accounting-based filter for capital proposals before committing to full discounted cash flow analysis. It’s particularly reliable when cash flows are stable and predictable, the project life is under 5 years, and the finance team needs to communicate results to non-finance managers who understand profit but not present value.
Advantages:
- Simple to calculate from standard income statement data — no discount rate assumption required.
- Directly comparable to accounting return on equity (ROE) and return on assets (ROA), making it intuitive for board-level reporting.
- Useful for preliminary screening: a project with ARR of 2% against a 10% hurdle rate doesn’t need a full DCF model to reject.
- Consistent with profit-based performance targets, which many management incentive schemes use.
Research published in the Journal of Business Finance and Accounting found that ARR remains one of the most widely used capital budgeting methods in practice, particularly among smaller firms and in industries with stable, predictable revenue streams. Source Microsoft Excel’s NPV function, which is commonly used alongside ARR analysis, discounts a series of cash flows using a rate you supply across up to 254 value arguments. Source This makes it straightforward to run a complementary NPV check once an ARR screen is passed.

ARR is most valuable when communicating investment performance to managers who think in accounting profit terms.
Critical Limitations of ARR: When Not to Rely on This Metric
ARR’s biggest flaw is that it ignores the time value of money — the principle that $1 received today is worth more than $1 received in 5 years. This makes ARR systematically misleading for long-duration or back-loaded projects.
Do not use ARR as your primary metric when:
- Project life exceeds 5 years (time value distortion compounds significantly).
- Cash flows are uneven or heavily back-loaded (ARR averages them, hiding the timing risk).
- The project has a large terminal value or salvage value that dominates total returns.
- You’re comparing projects of different sizes or durations (ARR doesn’t adjust for scale).
- The investment involves significant working capital changes that don’t appear in depreciation schedules.
Quantified example of the distortion: Two projects both show ARR of 10%. Project A earns $50,000 profit in Year 1 and $10,000 in Years 2-5. Project B earns $10,000 in Years 1-4 and $50,000 in Year 5. ARR treats them identically. NPV analysis, using a 10% discount rate, would show Project A’s NPV is materially higher because early cash flows are worth more. This is why ARR should always be confirmed with NPV before final approval. Excel’s IRR function, which is frequently used for this confirmation step, can evaluate a series of up to 29 cash flow periods. Source This produces the discount rate at which NPV equals zero.
For projects with complex cash flow timing, the EFM Investment Return Monte Carlo Simulation models uncertainty across thousands of scenarios — something ARR cannot do.
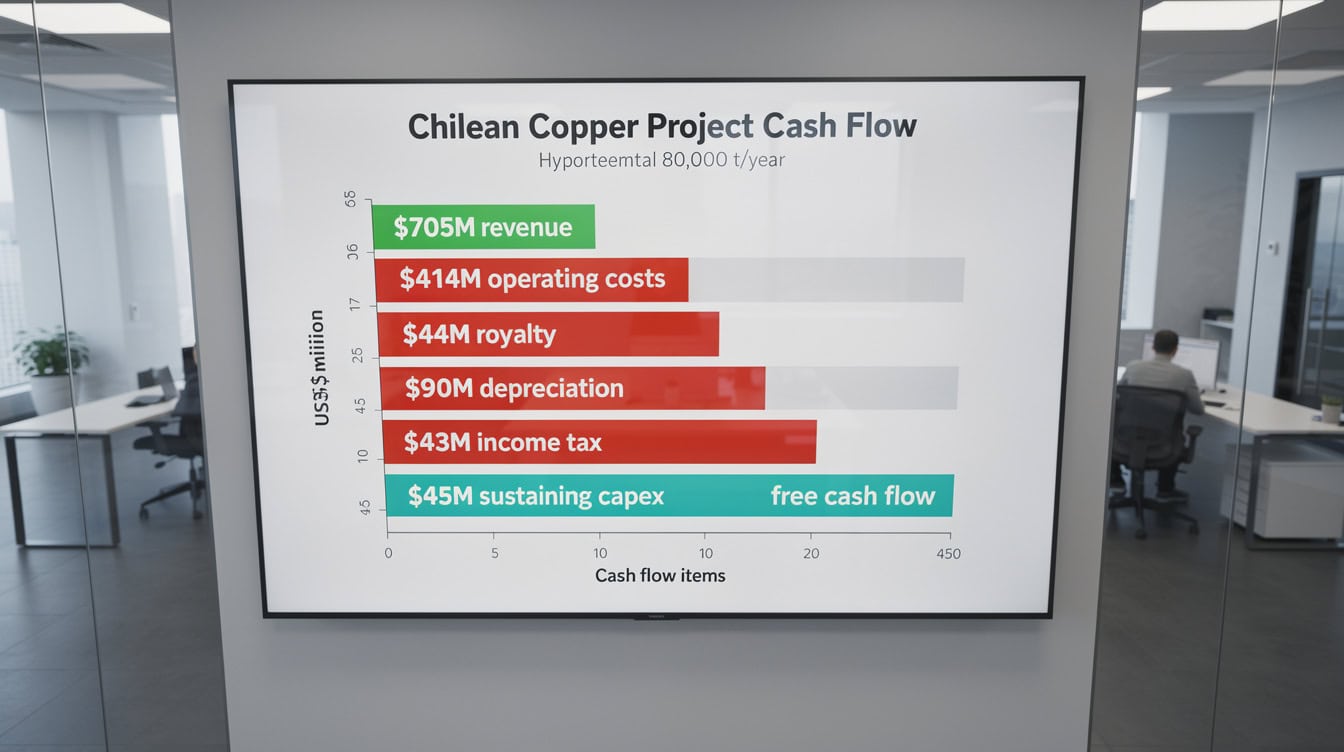
Two projects with identical 10% ARR can have materially different NPVs when cash flow timing differs — ARR cannot detect this.
Common ARR Calculation Errors and How to Avoid Them
ARR looks simple, but four specific errors account for most miscalculations in practice.
Error 1: Using total profit instead of average annual profit
Wrong: ARR = Total 5-year profit / Initial Investment
Right: ARR = (Total 5-year profit / 5) / Initial Investment
Dividing by project years is mandatory. Skipping this step overstates ARR by a factor equal to the project’s duration.
Error 2: Forgetting to subtract depreciation from profit
Depreciation is an accounting expense that reduces profit even though it’s a non-cash charge. Omitting it inflates average annual profit and produces an ARR that no income statement would support.
Error 3: Inconsistent denominator definition
Using initial investment in one project and average investment in another makes comparisons meaningless. Pick one method and apply it consistently across all projects in a capital budget cycle.
Error 4: Ignoring salvage value in depreciation
Straight-line depreciation must use (Cost − Salvage Value), not Cost alone. Using Cost alone overstates annual depreciation, understates profit, and produces a lower ARR than the asset actually delivers.
Error 5: Confusing ARR with simple ROI
Simple ROI = (Net Gain / Cost) × 100, with no time dimension. ARR annualizes the profit figure. For a 3-year project, simple ROI and ARR will produce different numbers even from identical inputs — they answer different questions. When building ARR models in Excel, analysts frequently use the SLN function to compute straight-line depreciation automatically; this function takes exactly 3 arguments — cost, salvage, and life. Source This eliminates the manual calculation error described in Error 4 above.
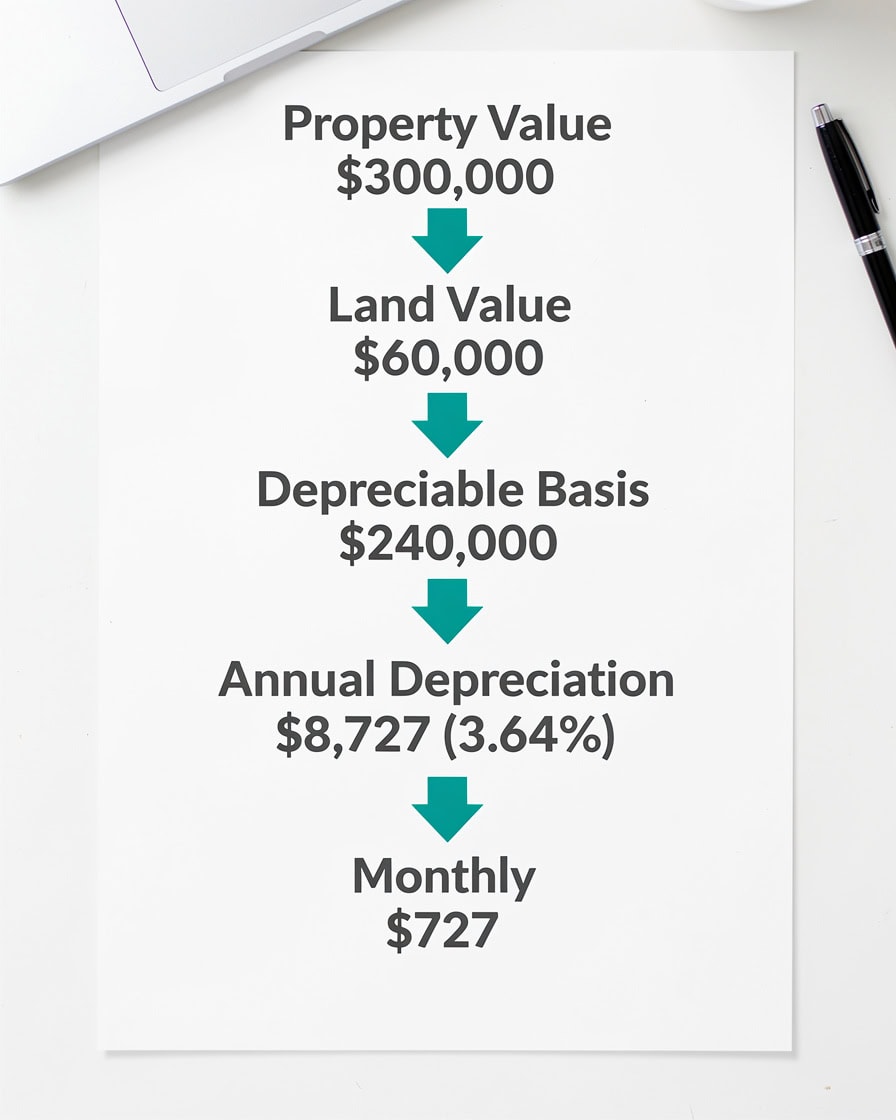
Error 1 — using total profit instead of average annual profit — overstates ARR by a factor equal to the project’s duration.
Downloadable ARR Calculator Template: Features and Scenarios
The EFM ARR Calculator Template gives you a pre-built Excel workbook with five tabs covering the four industry scenarios in this article plus a blank input tab for custom projects.
Template features:
- Automated ARR calculation using both initial investment and average investment denominators, displayed side by side.
- Integrated NPV and IRR columns so you can run all three metrics from a single data entry.
- Straight-line and declining-balance depreciation options with automatic switching.
- Sensitivity table showing how ARR changes as initial investment varies by ±20% in 5% increments.
- Visual dashboard with a traffic-light indicator: green if ARR exceeds your hurdle rate, red if it falls short.
- Pre-loaded scenarios: retail ($250,000), manufacturing ($500,000), SaaS ($180,000), real estate ($1,200,000).
For broader capital budgeting needs, the EFM Preferred Return Template handles waterfall distributions and preferred return thresholds alongside standard return metrics.

The EFM ARR Calculator Template includes sensitivity tables and a visual dashboard — run all four industry scenarios from a single workbook.
Frequently Asked Questions About Accounting Rate of Return
What is a good accounting rate of return?
A good ARR depends entirely on your industry, company hurdle rate, and the risk profile of the project. As a general benchmark, most corporate finance teams set minimum ARR thresholds between 8% and 15% for capital investments, mirroring their weighted average cost of capital (WACC). Manufacturing firms with stable cash flows often accept ARRs as low as 6% to 8% for long-lived machinery. Technology companies, facing faster obsolescence, typically demand 15% or higher. The key rule: ARR must exceed your company’s required rate of return, which you can estimate using the CAPM (Capital Asset Pricing Model) or your WACC. Never use an ARR threshold in isolation without anchoring it to your cost of capital.
How does accounting rate of return differ from simple ROI?
Simple ROI equals (Net Gain / Cost) × 100 and has no time dimension — it measures total return over the entire investment period without annualizing. ARR divides that same profit figure by the number of years to produce an annual rate, making it comparable across projects of different durations. For a 4-year project generating $40,000 total profit on a $100,000 investment, simple ROI is 40% while ARR is 10% per year. Both ignore the time value of money, but ARR is more useful for capital budgeting because it produces an annualized figure you can compare directly to your hurdle rate or WACC.
How do you calculate average annual profit for ARR?
Average annual profit equals total accounting profit over the project’s life divided by the number of years. Accounting profit for each year equals revenue minus operating costs minus depreciation. For example: a 5-year project with total revenue of $600,000, total operating costs of $200,000, and total depreciation of $150,000 produces total profit of $250,000. Average annual profit = $250,000 / 5 = $50,000. If annual figures are uneven, sum all years’ profits and divide by the number of years. Do not use cash flow figures — ARR specifically requires accounting profit, which includes the depreciation deduction.
What is the ARR formula when there is a salvage value?
Salvage value affects ARR in two places. First, it reduces annual depreciation: Annual Depreciation = (Initial Investment − Salvage Value) / Useful Life. Lower depreciation means higher annual profit and a higher ARR. Second, if you use average investment as the denominator, salvage value raises the denominator: Average Investment = (Initial Investment + Salvage Value) / 2. A higher denominator lowers ARR. Example: $200,000 investment, $20,000 salvage value, 5-year life. Annual depreciation = ($200,000 − $20,000) / 5 = $36,000. Average investment = ($200,000 + $20,000) / 2 = $110,000. If annual profit after depreciation is $14,000, ARR on initial investment = 7.0%; ARR on average investment = 12.7%. Always disclose which denominator you used.
When should a company use ARR instead of NPV or IRR?
Use ARR when you need a fast preliminary screen before committing resources to a full discounted cash flow analysis. ARR is appropriate for short-term projects (under 5 years) with stable, predictable cash flows, for comparing multiple proposals quickly during budget season, and for communicating investment performance to managers who think in accounting profit terms rather than present value. Use NPV as your primary accept/reject tool whenever the project has uneven cash flows, a long duration, or significant terminal value. Use IRR when ranking mutually exclusive projects or when your stakeholders want a percentage return figure that accounts for the time value of money. ARR and NPV/IRR should complement each other, not compete.
How does depreciation method affect ARR?
Depreciation method directly changes average annual profit and therefore ARR. Straight-line depreciation spreads the cost evenly, producing consistent annual profit figures. Accelerated methods (declining balance, sum-of-years-digits) front-load depreciation, reducing profit in early years and increasing it in later years. For ARR purposes, the average annual profit is the same under both methods over the full project life — but if you calculate ARR mid-project using only early-year data, accelerated depreciation will produce a lower ARR than straight-line. For a $100,000 asset with a 5-year life and no salvage value, straight-line depreciation is $20,000 per year. A 40% declining-balance method produces $40,000 in Year 1, $24,000 in Year 2, $14,400 in Year 3, and so on — dramatically different year-by-year profit figures even though the total depreciation is the same.
Can ARR be negative, and what does that mean?
Yes, ARR can be negative when average annual accounting profit is negative — meaning the project’s operating costs plus depreciation exceed its revenue. A negative ARR signals that the investment destroys accounting value on an annualized basis and should be rejected unless there are strategic reasons (market entry, regulatory compliance) that justify the loss. For example, if a $100,000 investment generates average annual profit of negative $5,000, ARR = −5%. This is distinct from a project with positive cash flow but negative accounting profit due to high depreciation — a situation where ARR and cash-based metrics like payback period give conflicting signals, reinforcing why you should never rely on ARR alone.
Conclusion
The accounting rate of return formula is a powerful first filter in any capital budgeting process: fast to calculate, easy to explain, and directly comparable to accounting-based performance targets. Its core weakness — ignoring the time value of money — means it must always be paired with NPV or IRR before you commit capital. The four industry examples in this article (retail at 2.0%, manufacturing at 7.0%, SaaS at 2.8%, real estate at 5.25%) show how ARR results vary dramatically by asset life and depreciation schedule, even when the underlying economics look similar.
I recommend downloading the EFM ARR Calculator Template with integrated NPV and IRR comparison to run all four scenarios in Excel, adjust inputs for your own projects, and generate a capital budgeting decision summary in minutes rather than hours.
























































