0 ITEMS

Rolling 13-Week Cash Flow: Variance Rules for Turnarounds
A 13-week cash flow forecast projects every expected cash receipt and payment by week for one quarter, rolls forward each week and is tested against bank actuals, which is why lenders and advisers treat it as the standard control in a turnaround. This guide shows a controller how to build one in six steps, with a worked example in which a base case that looks safe still falls below its cash floor in week 13.
Key Takeaways
- A 13-week forecast lists expected cash receipts and payments by week, so it exposes liquidity gaps that profit-based plans hide.
- Ankura reports that the 13-week forecast became the standard because lenders and bankruptcy courts needed a common language (2026).
- Receipts drive accuracy: model collections from billings with a lag and a collection rate, and set a minimum cash floor before testing any week.
- Worked example (hypothetical manufacturer): base case ends week 13 at USD 126.0 thousand, USD 24.0 thousand under the floor; a downside breaches it in week 7.
- Roll the forecast every week and test cumulative variance: week 2 receipts missed forecast by 12.1%, but cumulative receipts through week 2 were 7.7% under forecast.
A 13-week forecast shows cash by week, not profit
The direct method forecasts cash from the movements themselves, receipts and payments, instead of deriving it from projected profit. A turnaround consultancy describes a 13-week cash flow as built from direct cash movements: cash receipts and cash disbursements (2025).
The forecast is rolling: the finance team drops the completed week and adds a new week at the end, so the view always reaches 13 weeks ahead. Thirteen weeks is roughly one fiscal quarter, which Ankura calls long enough to be meaningful but short enough to forecast with accuracy (2026).
Lenders and courts treat it as the turnaround standard
A turnaround is a period of restructuring operations or debt while cash is scarce, and the forecast becomes the control tool. Ankura writes that the 13-week forecast became the standard because lenders and bankruptcy courts needed a common language, and that in a restructuring the forecast stops being a spreadsheet and turns into a control surface (2026).
These counts show US distress volume rather than forecast use. Epiq data show US commercial bankruptcy filings rose 5% to 31,810 in 2025, and commercial Chapter 11 filings, the US court process for reorganising a business, reached 6,560 from January to September 2026, an 11% increase from 5,895 in the same months of 2025, although the same report shows September 2026 filings 16% below September 2025.
Build the forecast in six steps
- Fix the starting point. Reconcile opening cash to the bank statement, because every later week builds on it.
- Set the floor. Agree the minimum operating cash with the lender or the board, so headroom, which is ending cash minus the floor, can be measured each week.
- Forecast receipts from billings. Apply a collection lag and a collection rate to invoiced sales, customer by customer where the data allows.
- Schedule payments by bank date. Place payroll, suppliers, rent, interest, taxes and adviser fees in the week the cash leaves, not the week the cost accrues.
- Calculate net cash flow, ending cash and headroom. A negative headroom in any week is a funding gap.
- Roll weekly. Each Friday, replace the completed week with actuals, add week 13 and explain every variance.
Receipts deserve scrutiny, because they are the line the finance team controls least. Finance teams that prefer a ready layout can browse the eFinancialModels cash flow projections collection.
Worked example: a manufacturer in turnaround
The example is illustrative: a hypothetical manufacturer, with all figures in USD thousands, and it leaves out capital spending and debt principal. Assume opening cash of 290.0, a minimum operating cash of 150.0, a five-week collection lag and a 96% collection rate. Billings invoiced in weeks -4 to 0 were 470.0, 460.0, 455.0, 440.0 and 430.0, and forecast billings for weeks 1 to 8 are 430.0, 425.0, 420.0, 420.0, 415.0, 415.0, 410.0 and 410.0. Payroll is 250.0 in every odd week, suppliers 240.0 weekly and adviser fees 22.0 weekly. Rent is 48.0 in weeks 1, 5, 9 and 13, interest 36.0 in weeks 4, 8 and 12, and taxes 28.0 in weeks 3, 7 and 11, each paid every fourth week from a different start week.
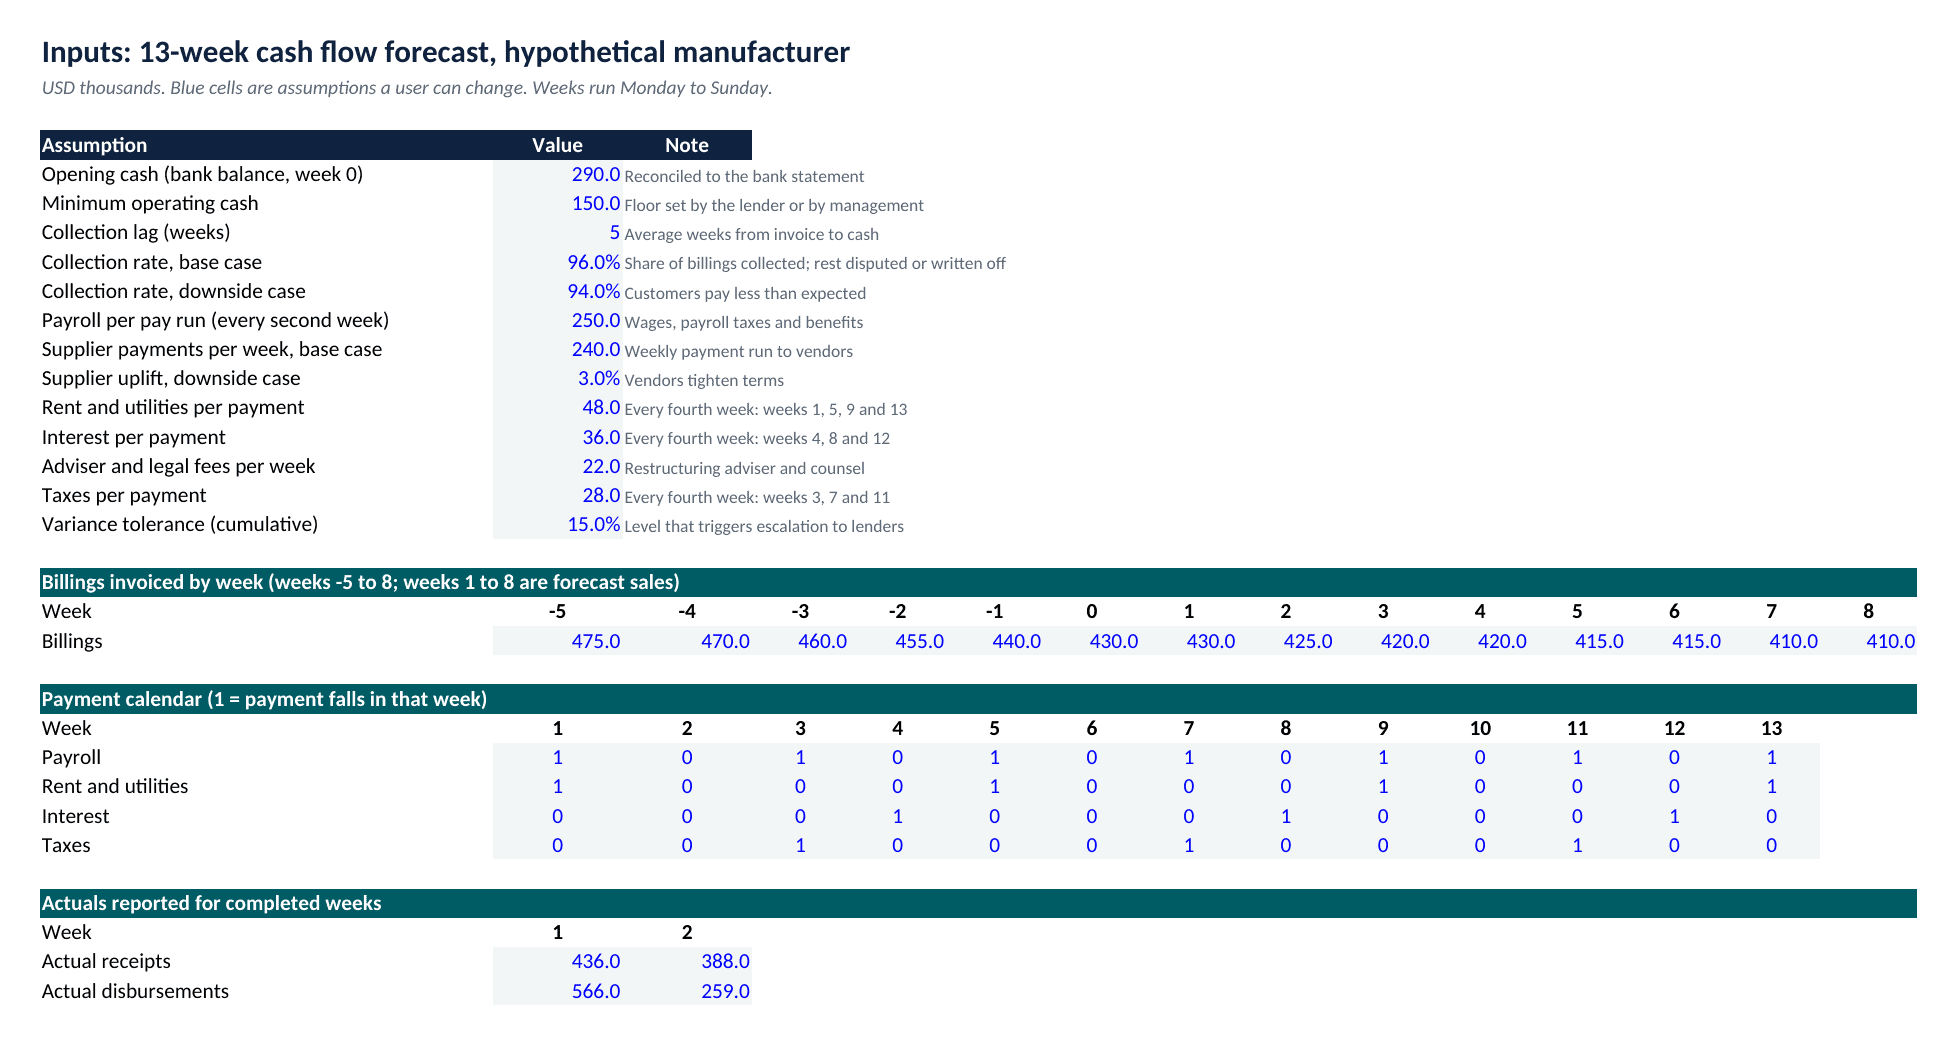
The inputs sheet holds every assumption of the example, and each blue cell can be changed. Source: eFinancialModels Analysis
Week 1 collects the billings invoiced in week -4, 470.0, at the 96% rate: 470.0 x 0.96 = 451.2. Payments that week total 560.0 (payroll 250.0, suppliers 240.0, rent 48.0 and fees 22.0), so net cash flow is 451.2 minus 560.0, or -108.8. Ending cash is 290.0 minus 108.8, or 181.2, which is 31.2 above the floor.
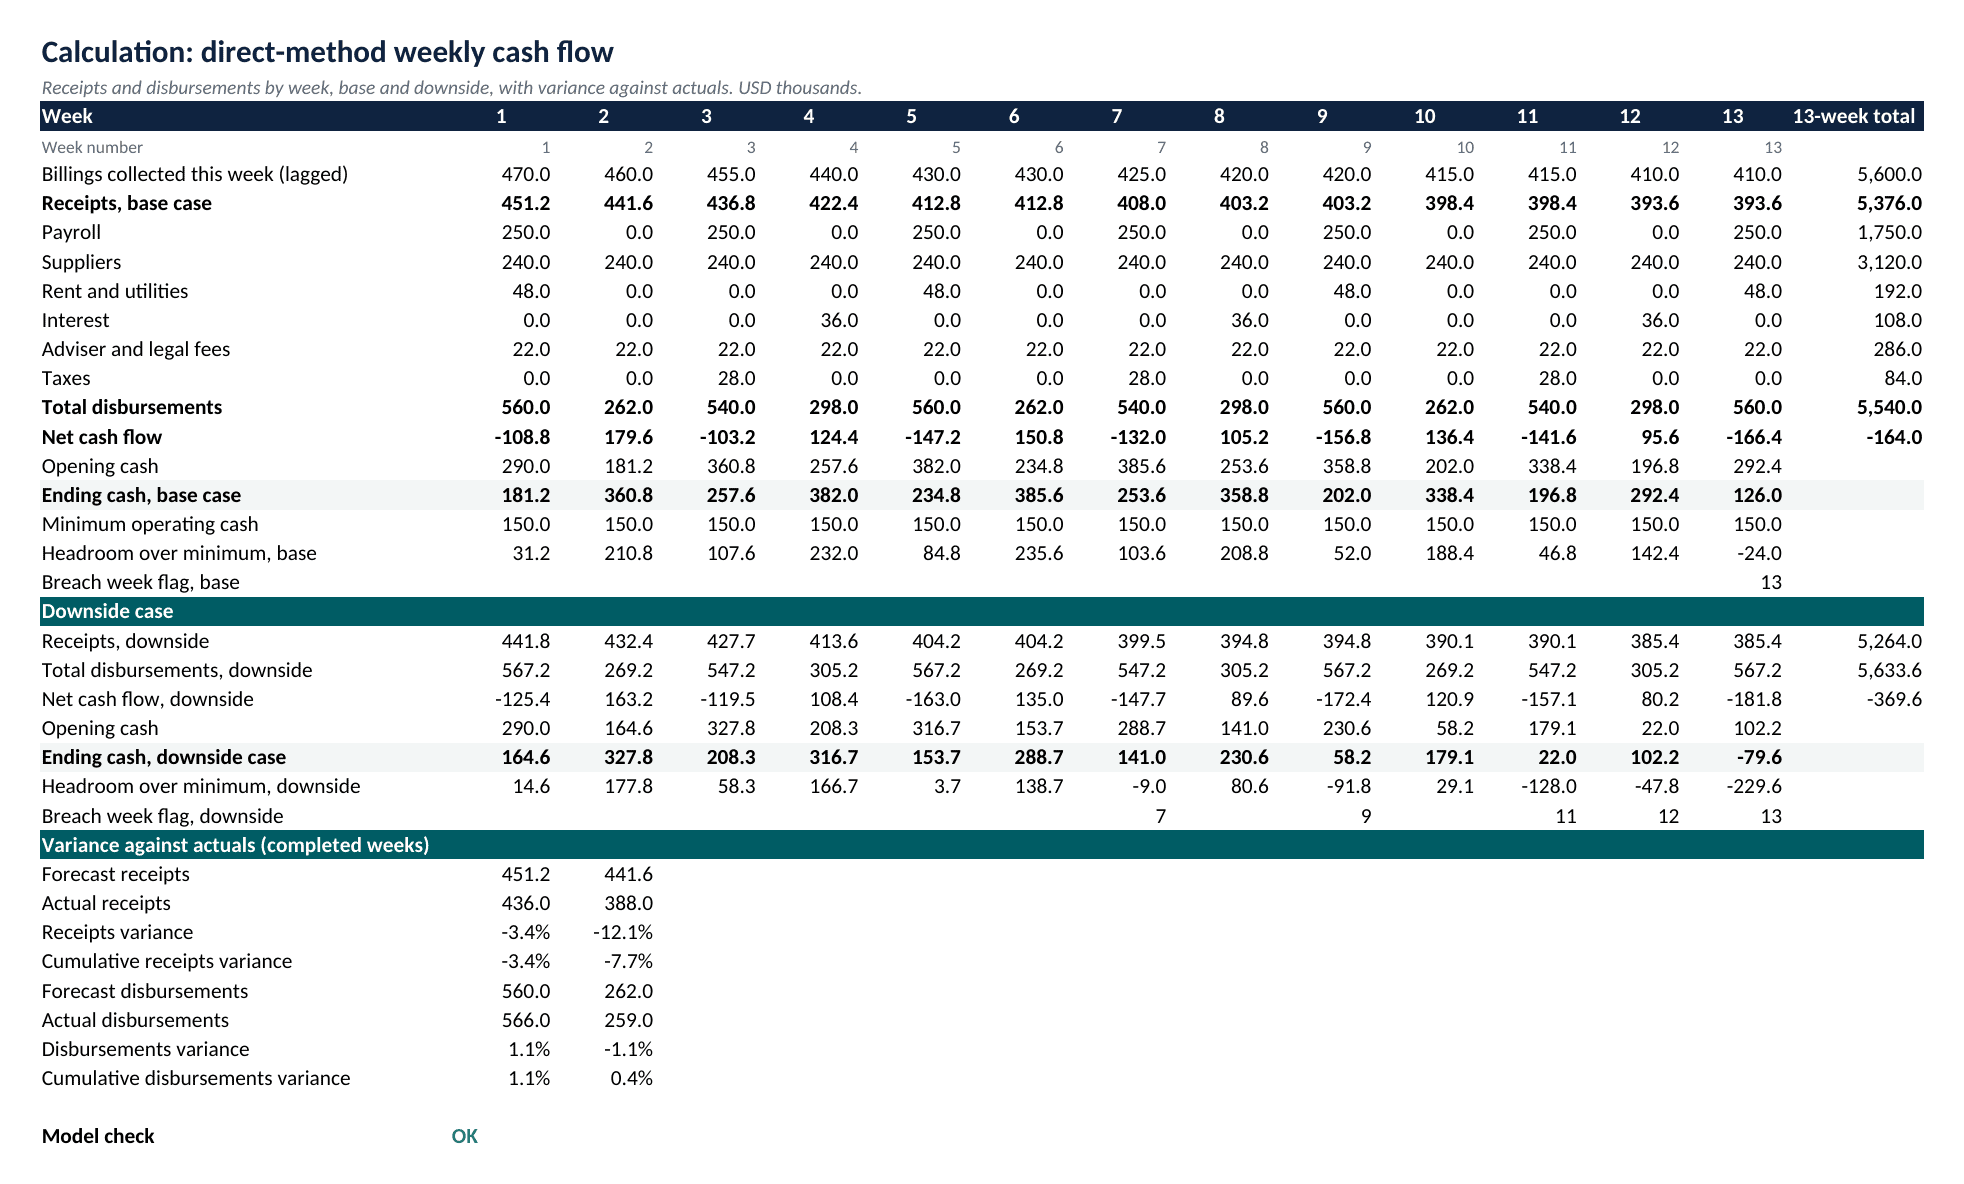
The calculation sheet runs 13 weekly columns for the base and downside cases and the variance check. Source: eFinancialModels Analysis
Base case by week, in USD thousands:
| Week | Receipts | Payments | Net cash flow | Ending cash |
|---|---|---|---|---|
| 1 | 451.2 | 560.0 | -108.8 | 181.2 |
| 2 | 441.6 | 262.0 | 179.6 | 360.8 |
| 3 | 436.8 | 540.0 | -103.2 | 257.6 |
| 4 | 422.4 | 298.0 | 124.4 | 382.0 |
| 5 | 412.8 | 560.0 | -147.2 | 234.8 |
| 6 | 412.8 | 262.0 | 150.8 | 385.6 |
| 7 | 408.0 | 540.0 | -132.0 | 253.6 |
| 8 | 403.2 | 298.0 | 105.2 | 358.8 |
| 9 | 403.2 | 560.0 | -156.8 | 202.0 |
| 10 | 398.4 | 262.0 | 136.4 | 338.4 |
| 11 | 398.4 | 540.0 | -141.6 | 196.8 |
| 12 | 393.6 | 298.0 | 95.6 | 292.4 |
| 13 | 393.6 | 560.0 | -166.4 | 126.0 |
| Total | 5,376.0 | 5,540.0 | -164.0 | 126.0 in week 13 |
Over 13 weeks the base case collects 5,376.0 and pays 5,540.0, a net outflow of 164.0, so cash falls from USD 290.0 thousand to USD 126.0 thousand. The average hides a saw-tooth pattern: headroom is 210.8 in week 2, a week without payroll, and peaks at 235.6 in week 6, yet it is only 31.2 in week 1 and 46.8 in week 11. Week 13 ends USD 24.0 thousand below the floor.
The downside case lowers the collection rate to 94% and raises supplier payments by 3%. Receipts fall to 5,264.0, payments rise to 5,633.6 and week 13 ends at USD -79.6 thousand. The floor is first breached in week 7, and the largest funding gap is USD 229.6 thousand.
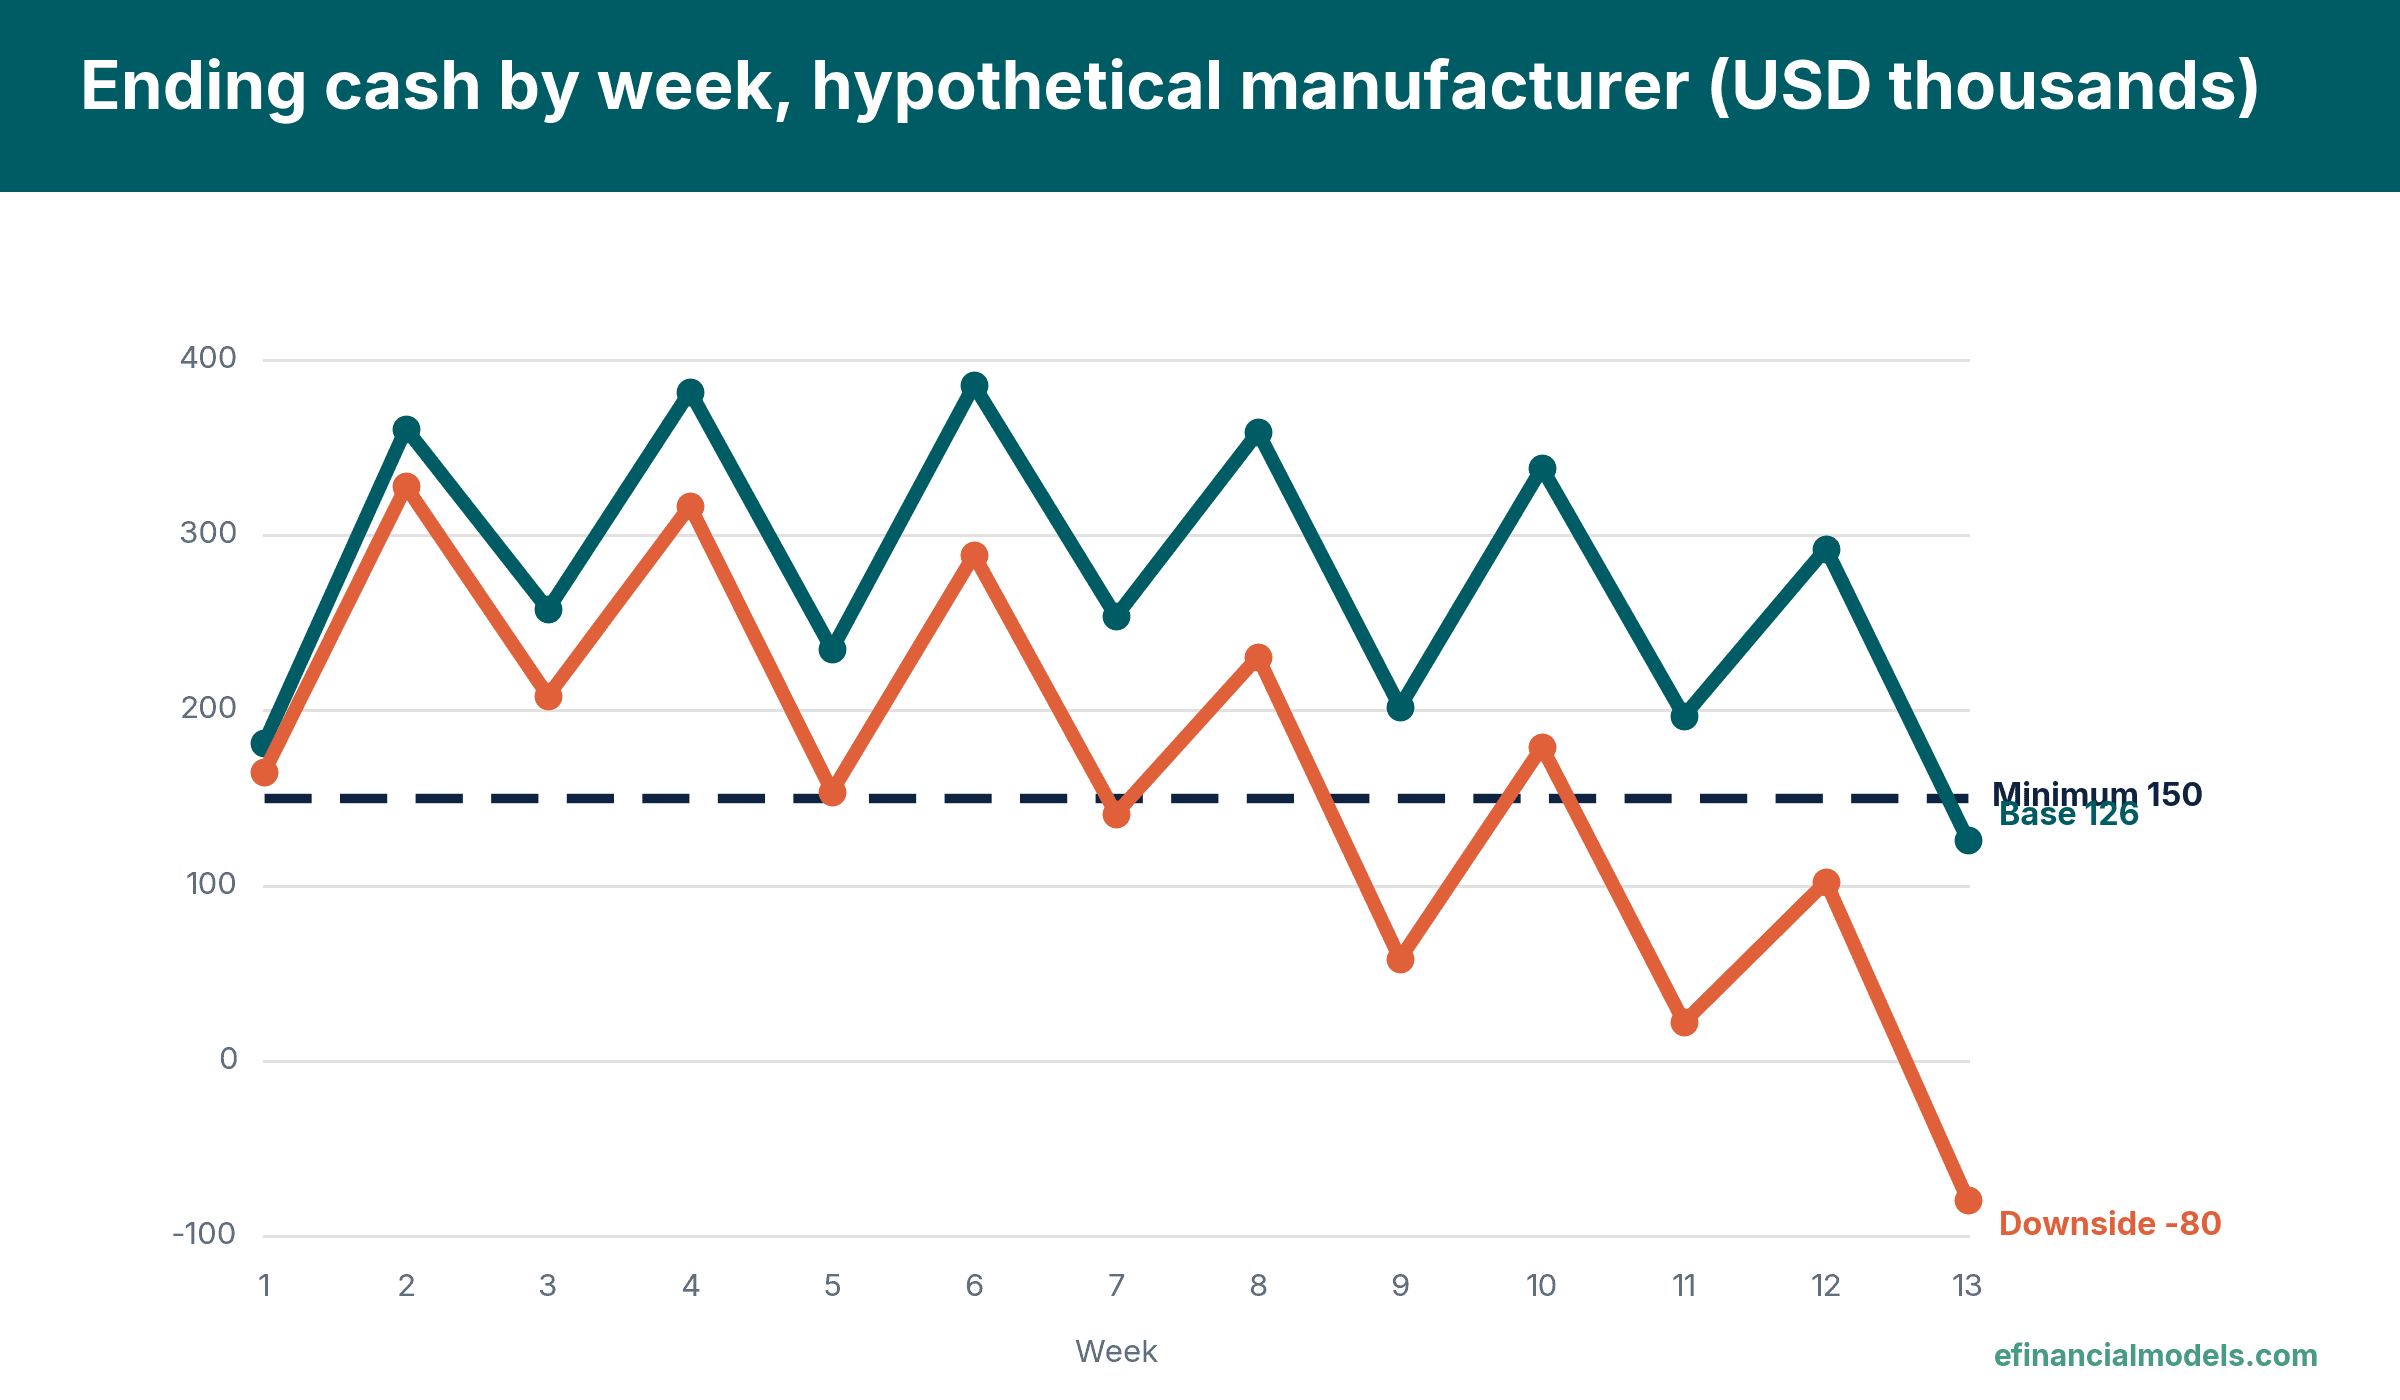
Weekly ending cash for the base and downside cases against the 150.0 minimum, drawn from the example results. Source: eFinancialModels Analysis
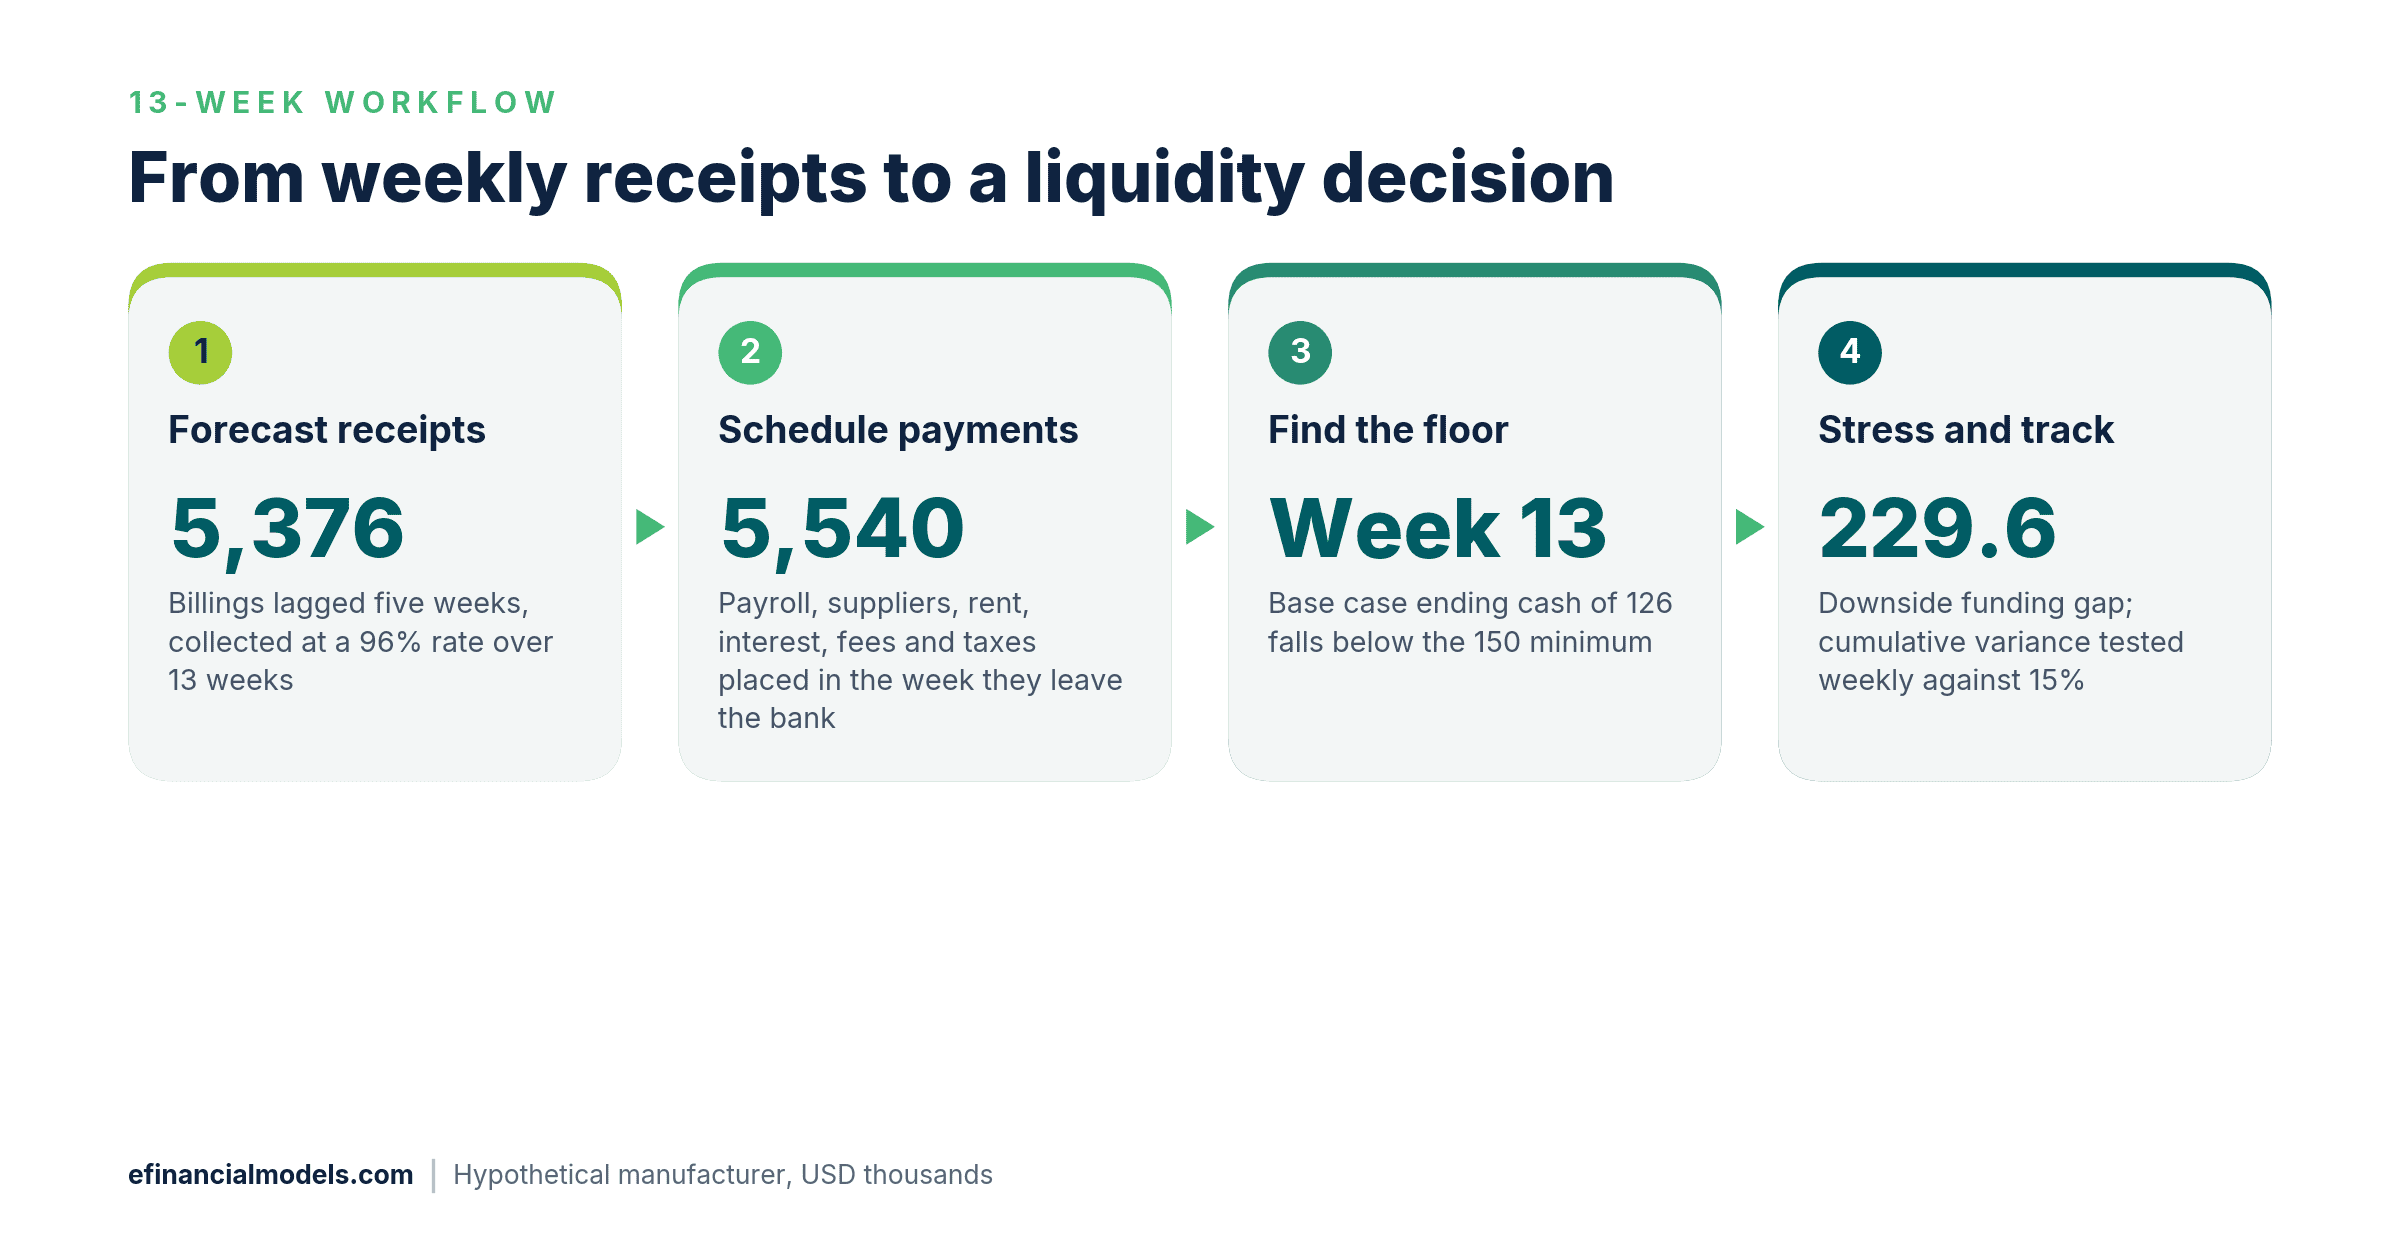
The example as a four-step workflow, in USD thousands. Source: eFinancialModels Analysis
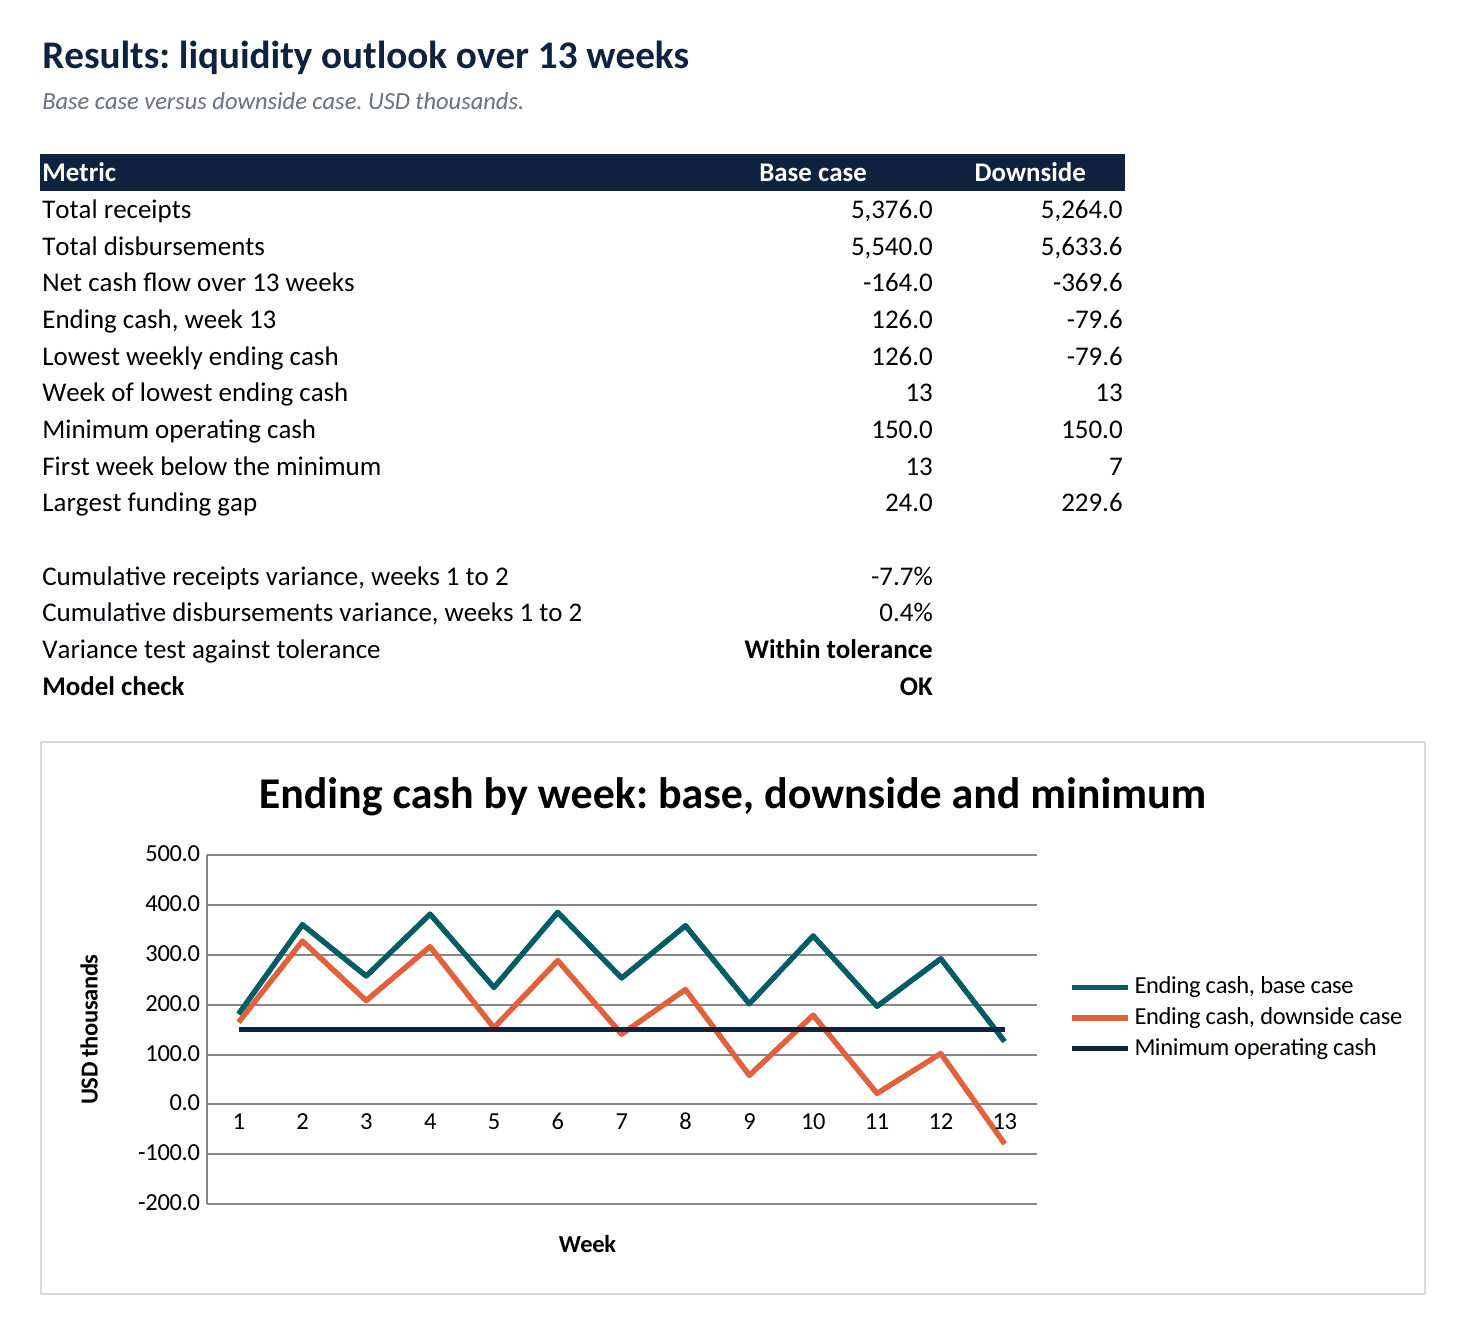
The results sheet summarises totals, the first week below the floor, the funding gap and the variance test. Source: eFinancialModels Analysis
Variance tracking starts after week 1. Actual receipts were 436.0 against a forecast of 451.2 (-3.4%) in week 1 and 388.0 against 441.6 (-12.1%) in week 2. Cumulatively, 824.0 against 892.8 is -7.7%, inside a 15% cumulative tolerance assumed for illustration. A credit agreement or forbearance agreement, in which a lender agrees to hold back its remedies for a set period, sets the real threshold. Actual disbursements over the two weeks were 825.0 against 822.0, a cumulative variance of 0.4%.
Read the output as a decision, not a report
A funding gap is a decision list. The downside gap of 229.6 can be met by faster collections, longer payment terms with non-critical vendors, deferred capital spending, a draw on a revolving credit facility (revolver) or new money, and each option has a lead time, so the week of the first breach sets the deadline. Common errors are forecasting from profit, placing payroll in the wrong week and assuming customers pay evenly.
The controller owns the numbers. Counsel and the restructuring adviser own the reading of covenants and directors’ duties in distress, and a tax adviser owns any payment plan with a tax authority, so this guide leaves those questions to them.
Frequently Asked Questions
Who should own the 13-week forecast, and how often should it change?
One accountable person, usually the controller or a treasury lead, should own the file and sign off every version. Sales supplies the billing and collection views, purchasing supplies the supplier calendar and payroll supplies the pay dates. The cadence is weekly: the same day each week, replace the completed week with bank actuals, add a new week 13 and send the explained variances to the CFO and lender.
How does it differ from a budget or a three-statement forecast?
A budget is an annual plan that starts from revenue and cost targets, and a three-statement forecast derives cash from projected profit and balance sheet changes. The 13-week forecast starts from cash itself and ignores accruals, so it can show a shortfall in a profitable month, which is the case that most often surprises a lender. Teams that want the longer-range view can pair it with a monthly budget model.
What should the finance team do when the forecast shows a funding gap?
Quantify the gap by week, rank the levers by speed and cost, and start the slowest one first. As indicative practitioner assumptions, collection pushes and vendor terms can work within days, while asset sales and new financing often take weeks. Share the gap and the plan with the lender before the breach week, because lenders react better to a disclosed shortfall than to a surprise at a covenant test.
How can receipts be forecast when customers pay erratically?
Forecast the largest customers one by one, using their payment history and any written promise to pay, and treat disputed invoices separately with a later date or a haircut. Group small customers into a pool with a historical collection curve. Review the largest accounts weekly with the credit team and keep a short list of the invoices that drive most of the movement.
Conclusion
A 13-week forecast turns a turnaround from guesswork into a weekly cash routine: reconcile the bank, forecast receipts with a lag, schedule payments by date, test headroom against a floor and track cumulative variance. Finance teams that want a custom financial model built to their own specification can brief the eFinancialModels Expert Financial Modeling Services team.