0 ITEMS

How to Calculate ROI (and What It Really Tells You)
Return on investment (ROI) is net profit divided by the cost of the investment, and it shows how much profit each dollar invested earned, but not how fast, how safely or against which alternative. In the hypothetical Project A below, a 200,000 investment earns an ROI of 65.0% over four years, which equals 13.3% a year.
Key Takeaways
- ROI equals net profit divided by the cost of the investment; in the hypothetical example, a profit of 130,000 on 200,000 invested is 65.0%.
- Annualised ROI converts a multi-year return into a yearly rate, an approximation that assumes end-of-period gains and lets projects of different lengths be compared.
- ROI ignores timing and risk, so payback period and net present value should sit beside it before capital is committed.
- Return on invested capital (ROIC) creates value only when it exceeds the weighted average cost of capital.
- Define cost and gain the same way for every option, use one time horizon, and test each result against a benchmark return.
ROI Is Net Profit Divided by the Cost of the Investment
Return on investment (ROI) is a metric used to denote how much profit has been generated from an investment, and Harvard Business School Online writes the formula as ROI = (Net Profit / Cost of Investment) x 100, which expresses the ratio as a percentage. This guide uses the percentage form throughout. Net profit is every cash gain the investment produced minus every cost it required, so the cost side should include the purchase price, installation, training and any overhead the project adds.
A closely related measure is the rate of return (ROR), which Fidelity describes as a measure of an investment’s gain or loss over a specified period of time. ROR is usually quoted for an asset over one period, while ROI is usually quoted for a project over its whole life, but both divide a gain by a starting amount. For a hypothetical share bought at 50,000, sold at 56,000 and paying 2,000 of income, ROR is (56,000 – 50,000 + 2,000) / 50,000 = 16.0%.
Annualised ROI Converts a Multi-Year Return Into a Yearly Rate
A simple ROI hides how long the return took, so a gain earned in two years and the same gain earned in ten years look identical. Fidelity notes that the compound annual growth rate (CAGR) gives an apples-to-apples comparison by annualizing the average rate of return, and it gives the formula as (Ending Value / Beginning Value)^(1 / n) – 1, where n is the number of years. For a project, the ending value is the cost plus the net profit, so annualised ROI = (1 + ROI)^(1 / n) – 1, with ROI written as a ratio such as 0.65 for 65.0%. It treats the whole return as arriving at the end of the period, a simplification that the timing-aware measures later in this guide refine.
Worked Example: Two Projects of the Same Cost
All amounts are in USD, every input is a hypothetical assumption, and the cash gains are before tax and financing, with no residual value. A business can spend 200,000 on one of two projects. Project A, a packaging line, returns net cash gains of 70,000, 80,000, 90,000 and 90,000 over four years. Project B, a software rollout, returns 150,000 in each of its first two years and nothing after that.
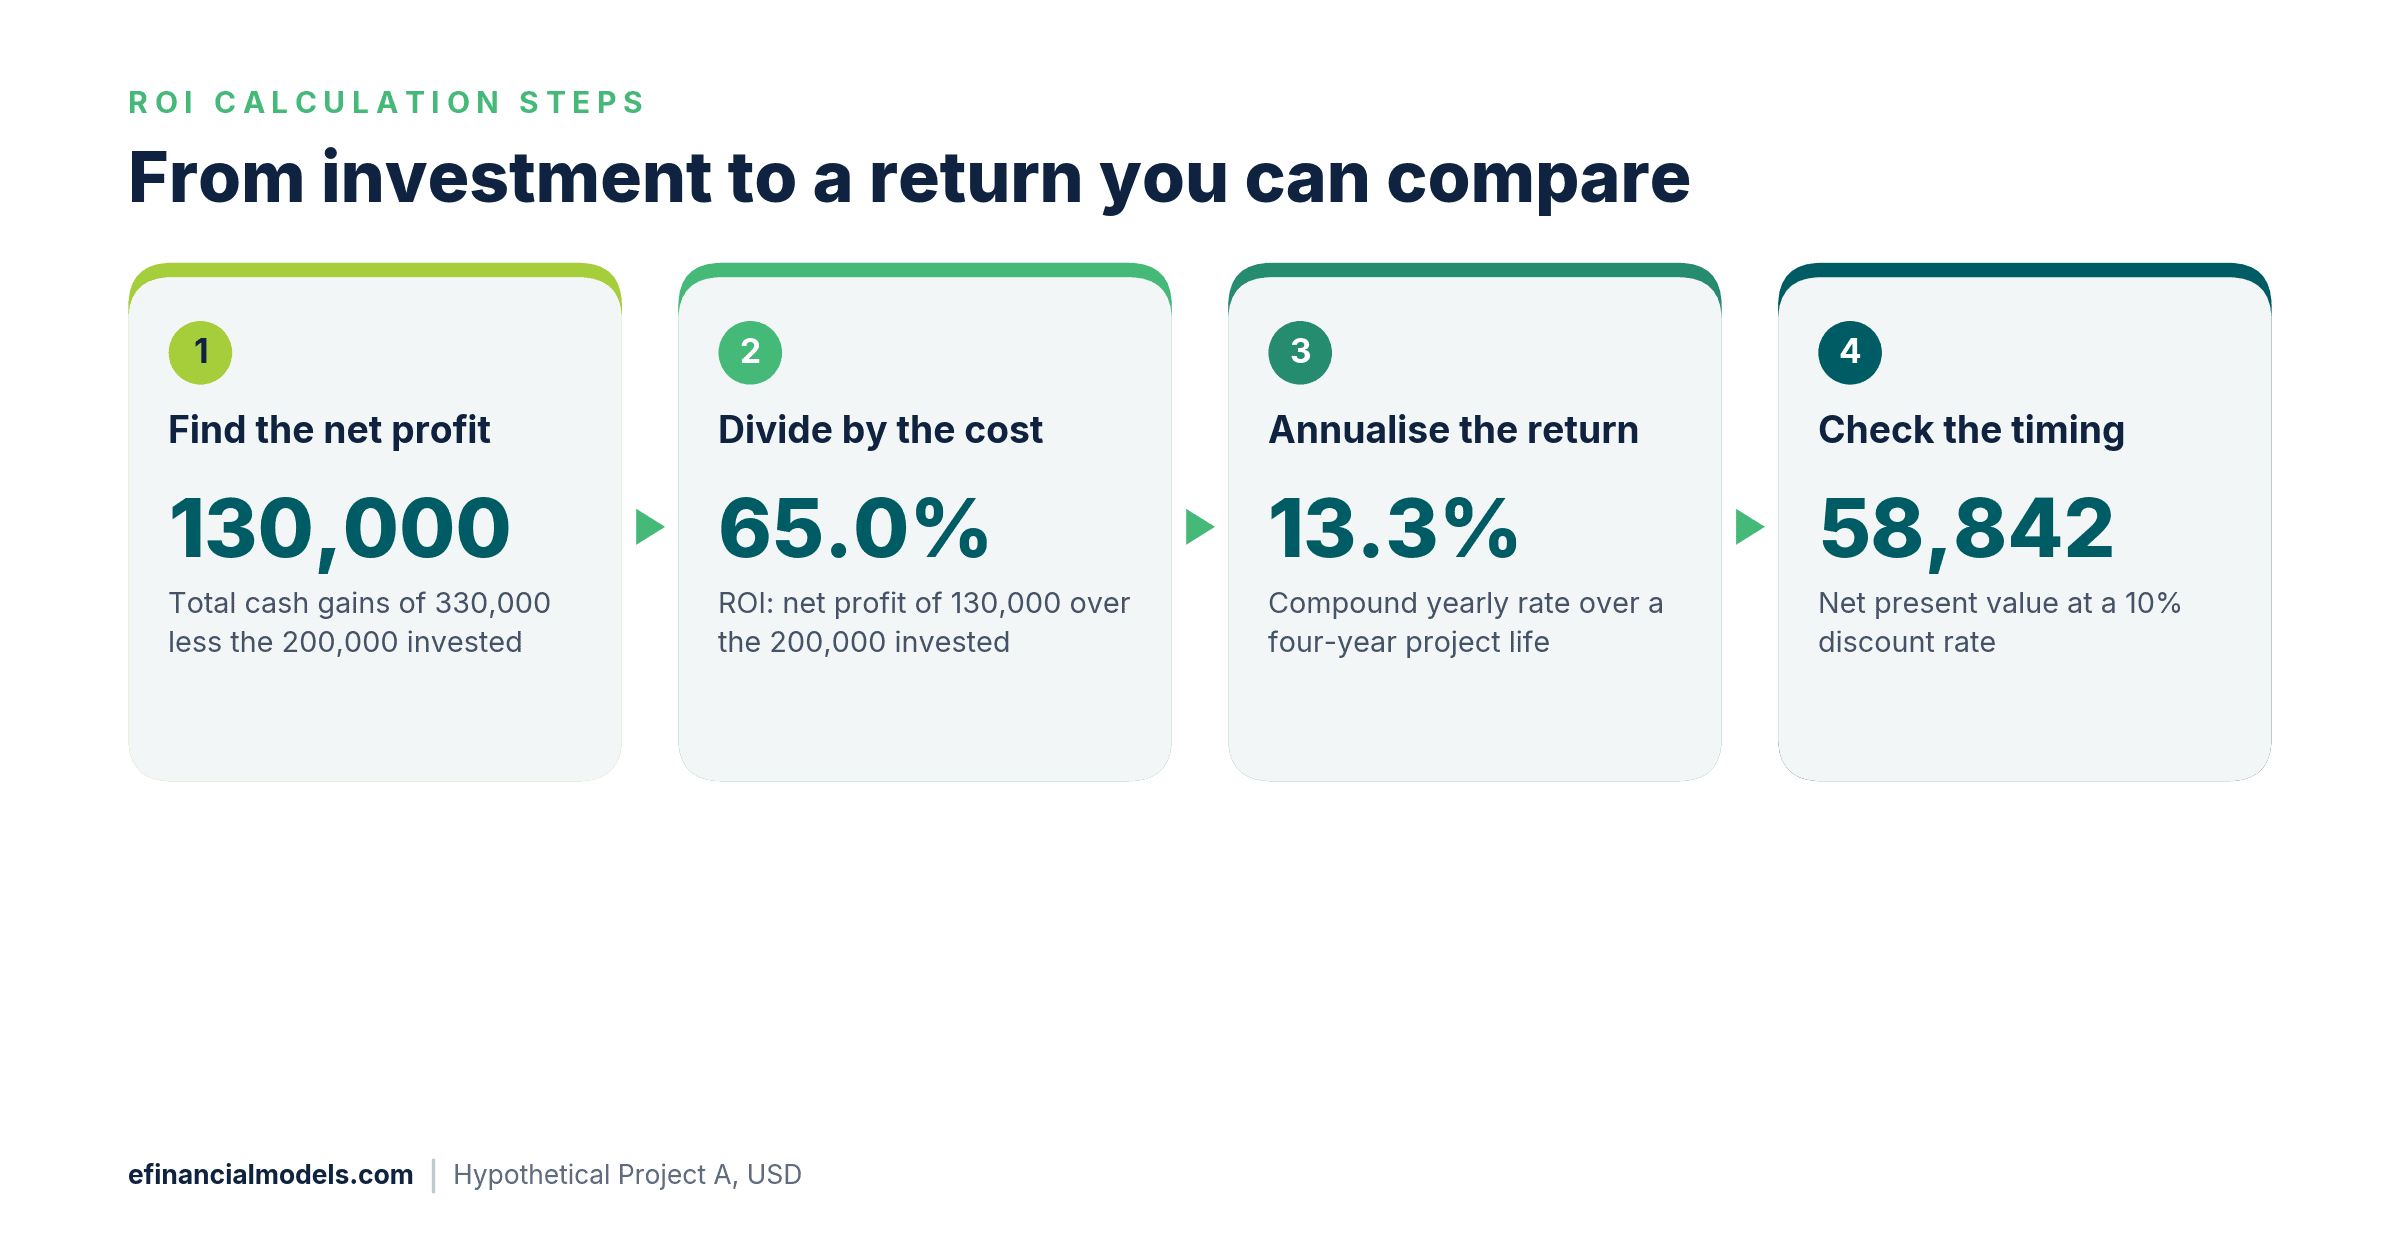
The four calculation steps in order, drawn by eFinancialModels from the worked example.
Project A’s gains total 330,000, so its net profit is 330,000 minus 200,000, or 130,000, and its ROI is 130,000 divided by 200,000, or 65.0%. Project B’s gains total 300,000, a net profit of 100,000 and an ROI of 50.0%.
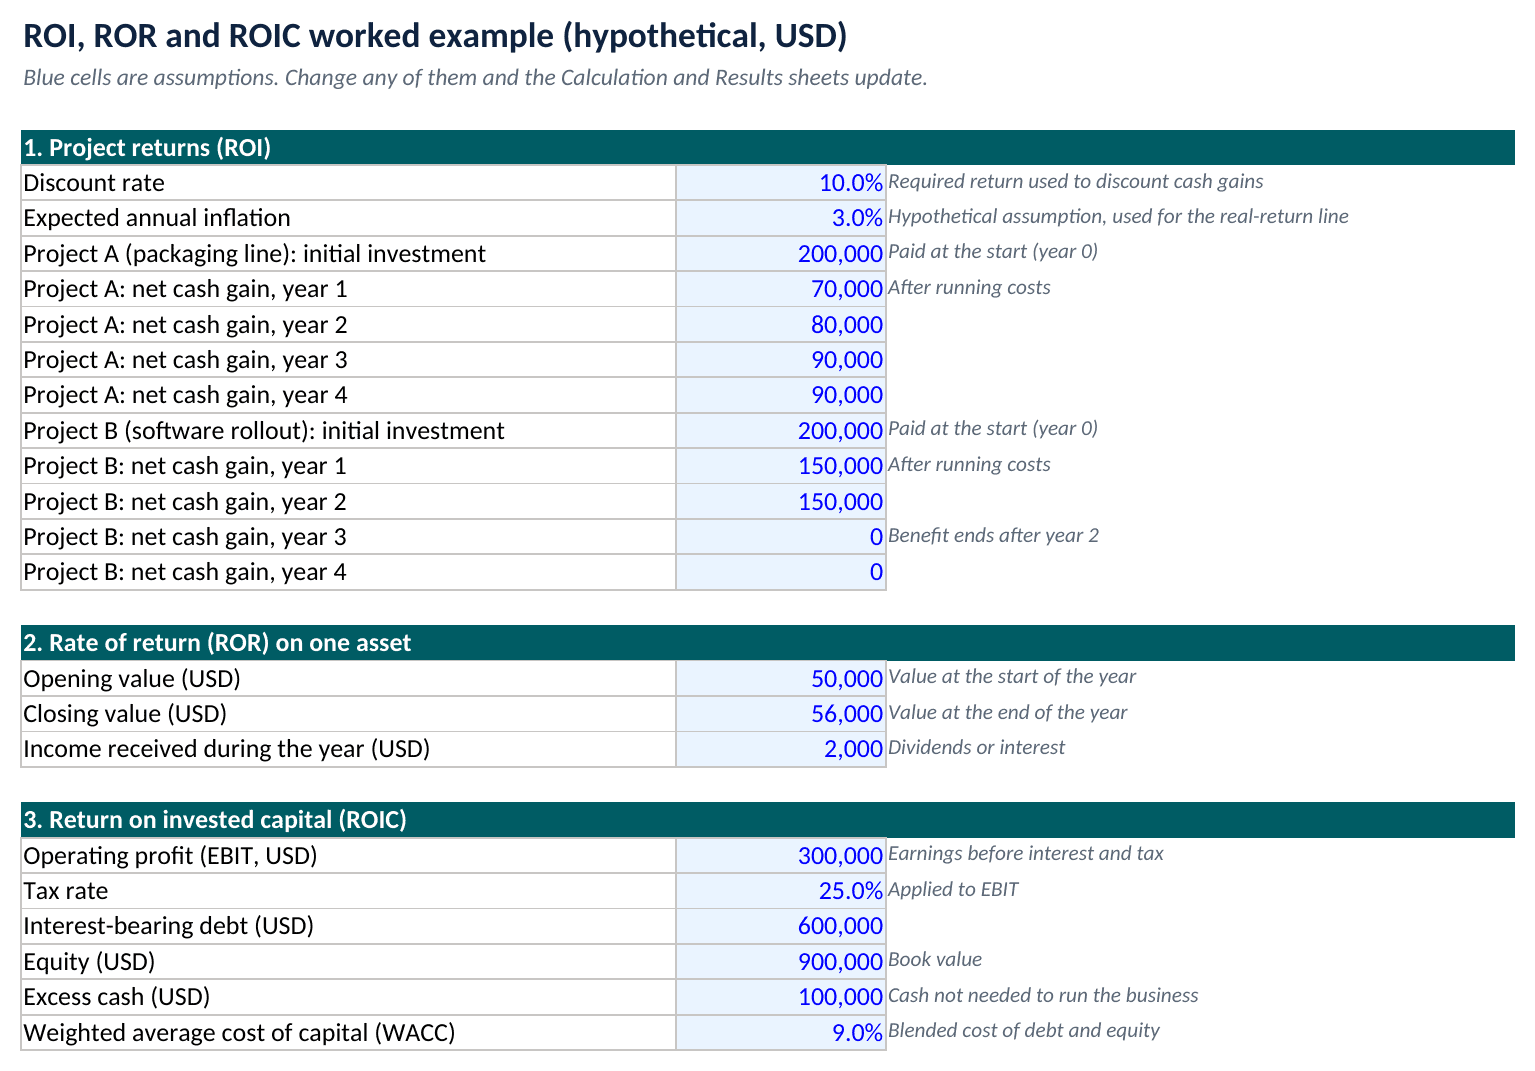
Inputs sheet of the worked example: each blue cell is an assumption that can be changed. Source: eFinancialModels Analysis
Annualising changes the ranking. Project A’s yearly growth factor is the number that gives 1.65 when multiplied by itself four times, which is 1.1334, so its annualised ROI is 13.3% after rounding. Project B’s factor gives 1.50 when multiplied by itself twice, which is 1.2247, so its annualised ROI is 22.5% after rounding. Removing an assumed 3% inflation rate, by dividing 1 plus the yearly return by 1.03, leaves a real return of 10.0% for Project A and 18.9% for Project B. Payback tells the same story. The payback period, the time until cumulative cash gains repay the cost, is 2.56 years for Project A and 1.33 years for Project B, assuming cash arrives evenly through each year. The two figures are 2 + 50,000 / 90,000 and 1 + 50,000 / 150,000.
Net present value (NPV) is the sum of future cash gains discounted back to today minus the initial cost, and Harvard Business School Online explains that it accounts for the time value of money. At a 10% discount rate, which is the yearly return the owner requires from this kind of project, Project A’s NPV is 58,842 and Project B’s is 60,331.
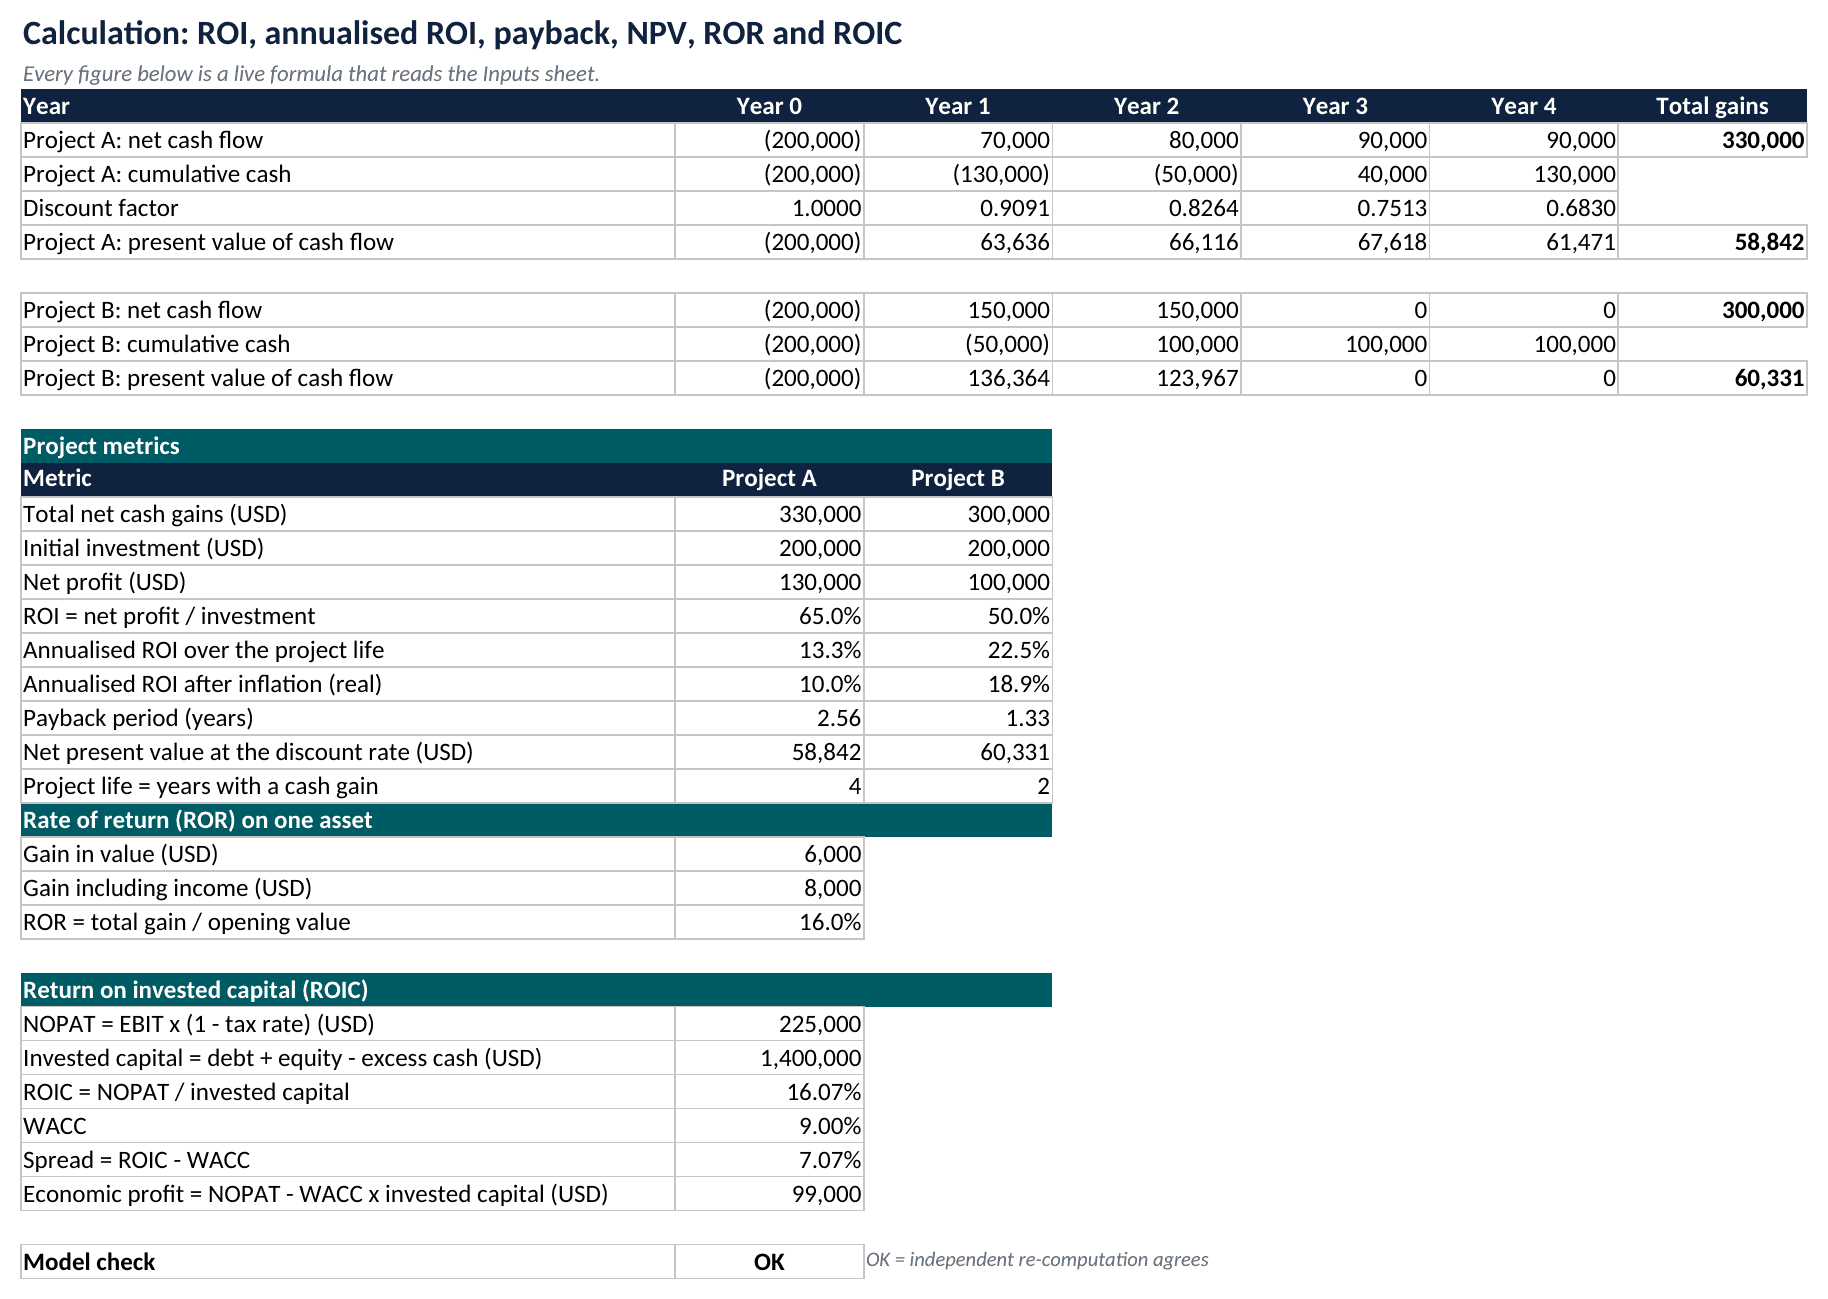
Calculation sheet: live formulas turn the inputs into ROI, payback, net present value, ROR and ROIC. Source: eFinancialModels Analysis
| Measure | Project A | Project B |
|---|---|---|
| Net profit (USD) | 130,000 | 100,000 |
| ROI | 65.0% | 50.0% |
| Annualised ROI | 13.3% | 22.5% |
| Payback period (years) | 2.56 | 1.33 |
| NPV at a 10% discount rate | 58,842 | 60,331 |
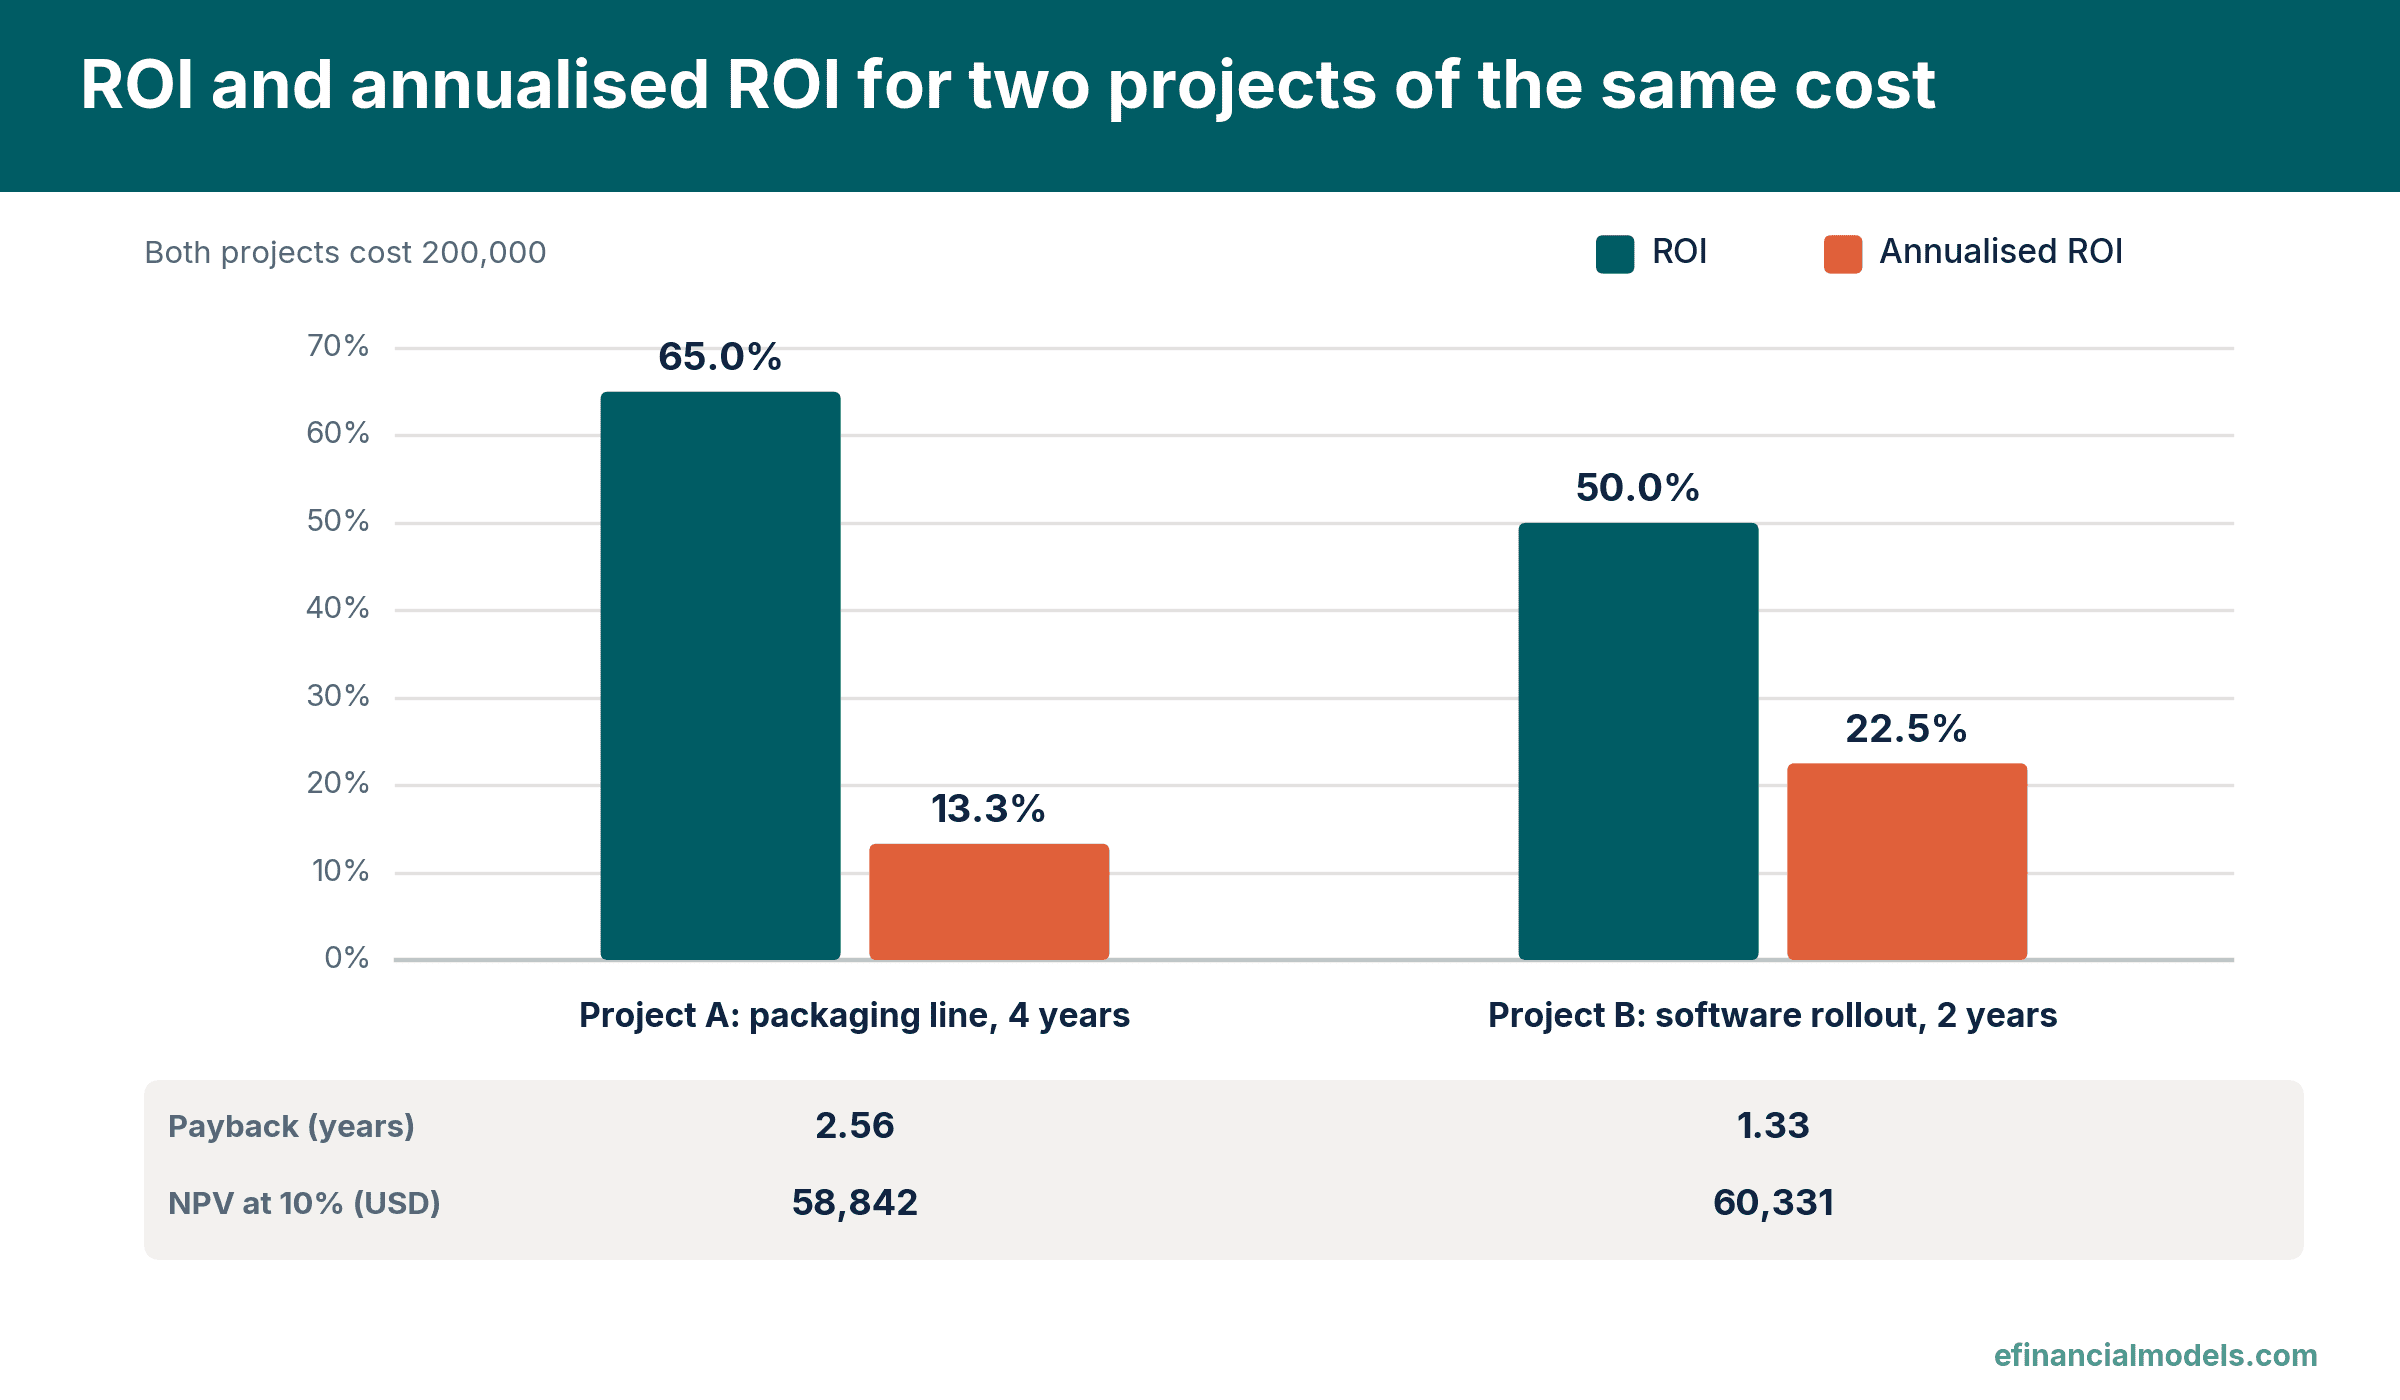
Project A leads on ROI, while Project B leads on annualised ROI, payback and net present value. Source: eFinancialModels Analysis
Project B has the lower ROI but the higher yearly return, the faster payback and an NPV 1,489 higher. Project A still produces the larger absolute profit, so the choice also depends on what the money could earn once Project B frees it early.
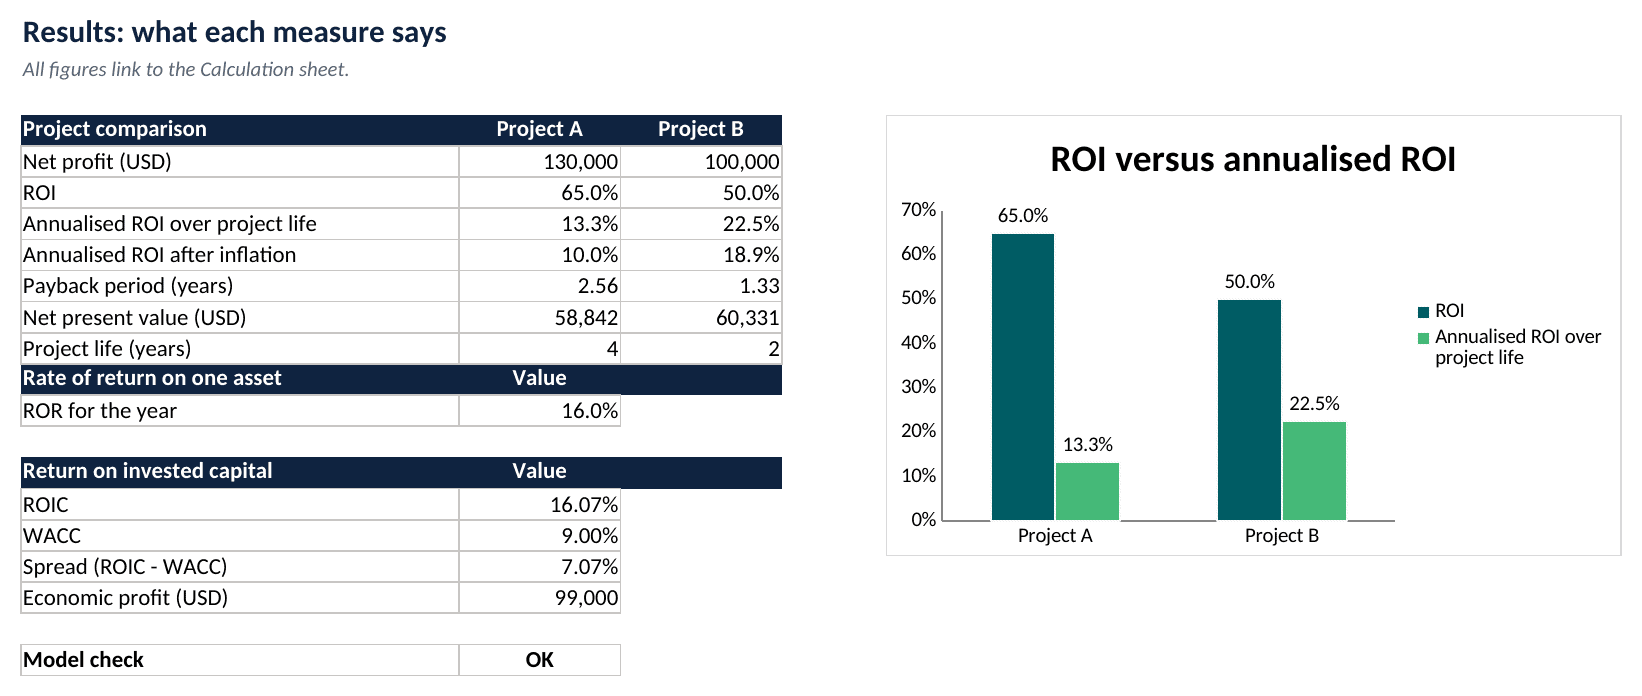
Results sheet: the two projects side by side, the ROIC spread and the model check cell. Source: eFinancialModels Analysis
ROI Cannot See Timing, Risk or Scale
ROI is a ratio of totals, so it is blind to three things. It ignores timing, which payback and NPV capture. It ignores risk, because a guaranteed return and a speculative one of the same size look identical. It ignores scale, because a small investment can show a striking ROI yet add little profit.
The internal rate of return (IRR) is the discount rate at which a project’s NPV equals zero, according to Harvard Business School Online, and it gives a second timing-aware check. Ready-made structures are listed in the eFinancialModels Return on Investment (ROI) templates and NPV templates pages.
ROIC Shows Whether the Business Earns More Than Its Capital Costs
Return on invested capital (ROIC) is after-tax operating profit divided by the capital invested in operations. An article by Elizabeth Collins on Aswath Damodaran’s pages at New York University’s Stern School of Business states that a company creates value only if its ROIC is higher than its weighted average cost of capital (WACC), the blended return that lenders and shareholders require.
Operating profit is earnings before interest and tax (EBIT), and the after-tax figure is net operating profit after tax (NOPAT), so NOPAT = EBIT x (1 – tax rate). Invested capital is usually interest-bearing debt plus equity minus excess cash that the operations do not need.
Assume a hypothetical business with EBIT of 300,000, a 25% tax rate, interest-bearing debt of 600,000, equity of 900,000 and excess cash of 100,000. In this hypothetical example, NOPAT is 225,000 and invested capital is 1,400,000, so the assumed business earns an ROIC of 16.07%. Against an assumed WACC of 9.00%, the spread is 7.07 percentage points, and the economic profit, NOPAT minus WACC times invested capital, is 225,000 minus 126,000, or 99,000.
In Damodaran’s WACC data, the all-firm WACC for 5,994 US firms as of January 2026 was 6.96%. In the same dataset, the cost of equity, the return shareholders require, was 8.02% and the pre-tax cost of debt, the rate lenders charge, was 5.29%. This is a market-wide benchmark, and a growth-stage business may face a higher WACC, so the example above assumes 9.00%.
Frequently Asked Questions
Is a high ROI always a good sign?
No. A high ROI can come from a tiny cost base, a very short horizon or an optimistic forecast, and none of these guarantees a large or lasting profit. In an illustrative comparison, a 200% ROI on 1,000 earns 2,000, while a 20% ROI on 100,000 earns 20,000. The ratio should be read together with the absolute profit, the time taken and the confidence behind the forecast gains.
How is ROI calculated for marketing or software spending?
The same formula applies, but the gain must be the extra profit the spending caused, not total sales. For a campaign, subtract product and delivery costs from the extra revenue, then subtract the campaign cost and divide by that cost. The harder step is attribution, so a before-and-after comparison or a holdout group of customers who never saw the campaign gives a more defensible gain than a platform’s own conversion count.
What is a good ROI for a small business?
No single figure suits every business, because the right hurdle depends on the cost of the money used, the risk of the project and the alternatives available. A practical test sets the minimum annualised return at the owner’s borrowing rate or required return plus a margin for risk. Projects below the line are rejected or redesigned, and the hurdle is reviewed when interest rates change.
Should financing costs and taxes be included in ROI?
It depends on the question being asked. ROI on the project itself is usually measured before financing, so a sound project is not rejected because of how it is paid for. ROI to the owner counts interest, fees and tax, because those reduce the profit that actually remains. Whichever version is used, it should be named in the analysis and applied identically to every option.
Conclusion
ROI answers one narrow question: how much profit an investment earned per dollar of cost. It becomes reliable when cost and gain are defined the same way for every option, the return is annualised, and the result is checked against payback, NPV and the WACC. Readers who want to test their own figures can use the free eFinancialModels Return on Invested Capital (ROIC) Calculator, an editable Excel template that calculates net operating profit after tax, invested capital and ROIC over 10 years from income statement and balance sheet figures and the income tax rate.