
0 ITEMS

Vertically Integrated Cannabis Operations Model — Three-Scenario P&L with IRC 280E, Cost per Pound & 36-Month Cash Flow | Excel Template
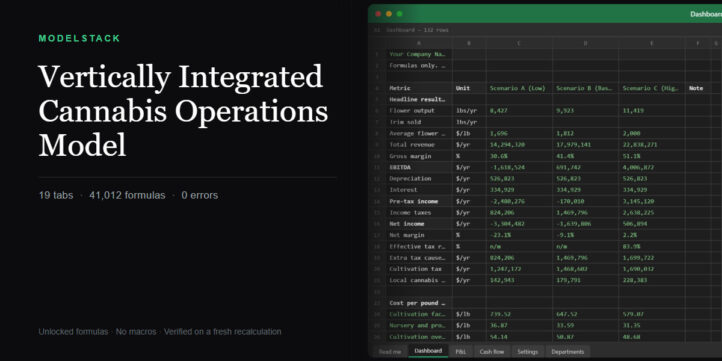
Three-scenario operating model for a vertically integrated cannabis operator: cultivation sites, nursery, clone and tissue culture lab, packaging, distribution, marketing and G&A, with cultivation tax, IRC 280E and state income tax built in. Every department rolls up by ID into a COGS vs operating-expense P&L, cost per pound, breakeven price and a 36-month cash flow ramp with equity, a loan schedule and a year-end balance sheet. Measured from the file itself: 19 tabs, 41,012 formulas, 0 formula errors on a fresh recalculation, and all 13 built-in data checks at zero. All cells unlocked, no password protection, no macros. A free PDF of every sheet is available as a preview.
| Agriculture, Financial Model |
| Break-Even, Budget, Cash Flow Projections, Cost Calculation, Cost Projections, Dashboard, Excel, Financial Model, Scenario Analysis, Sensitivity Analysis |
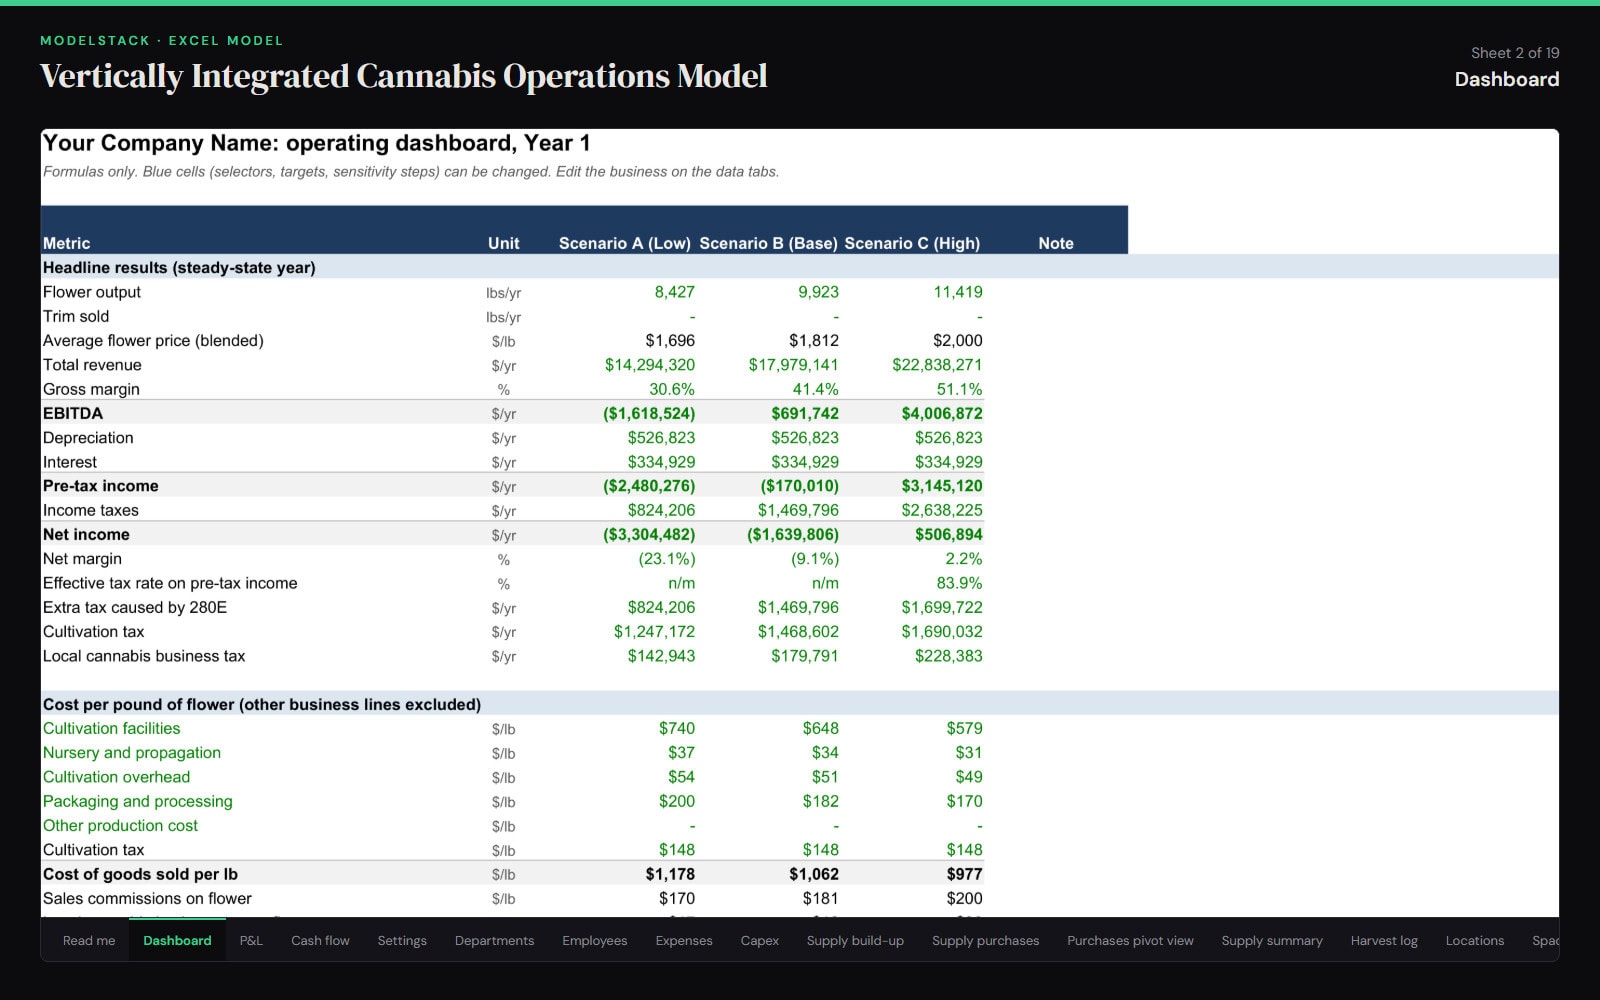
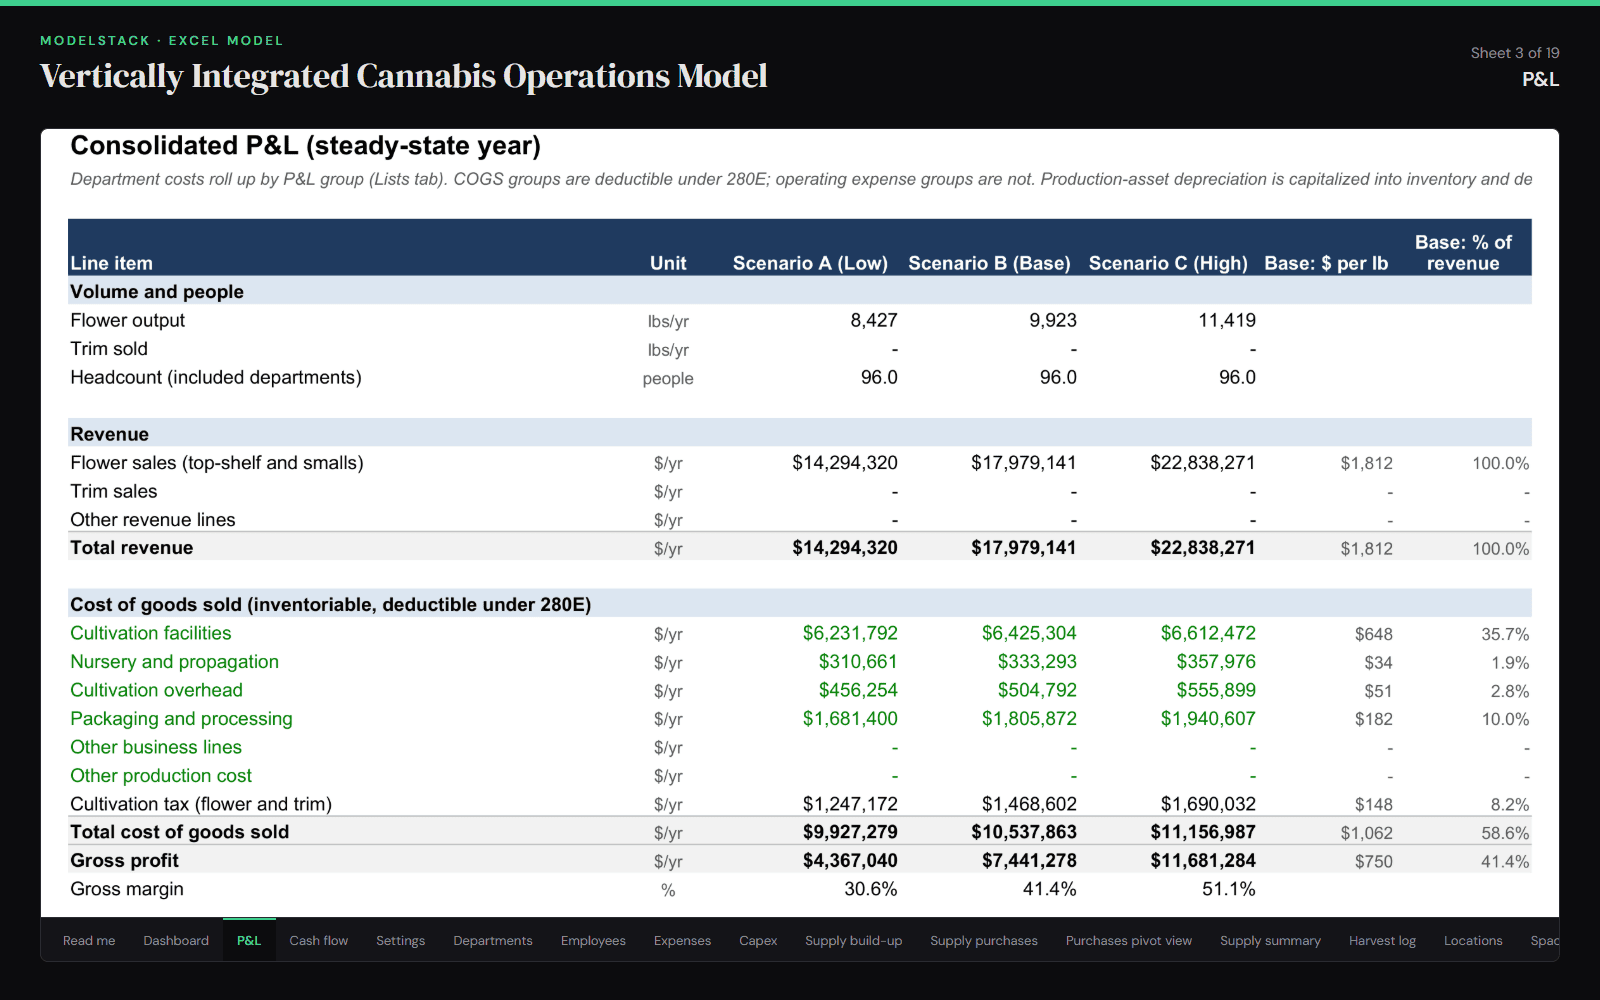
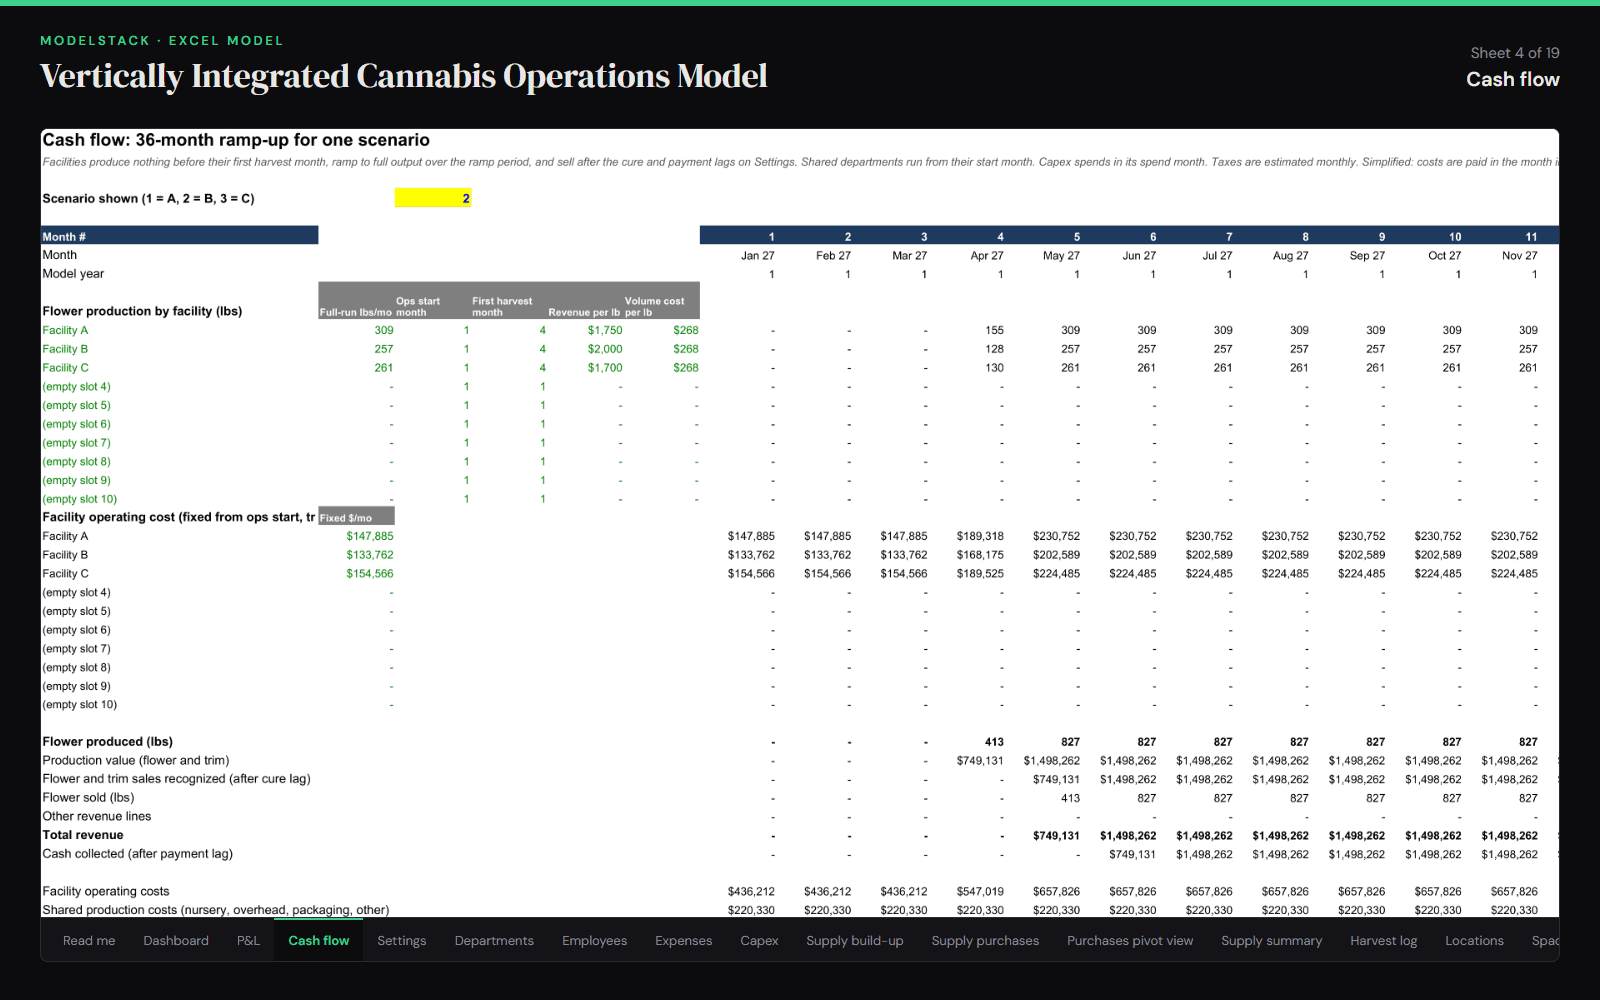
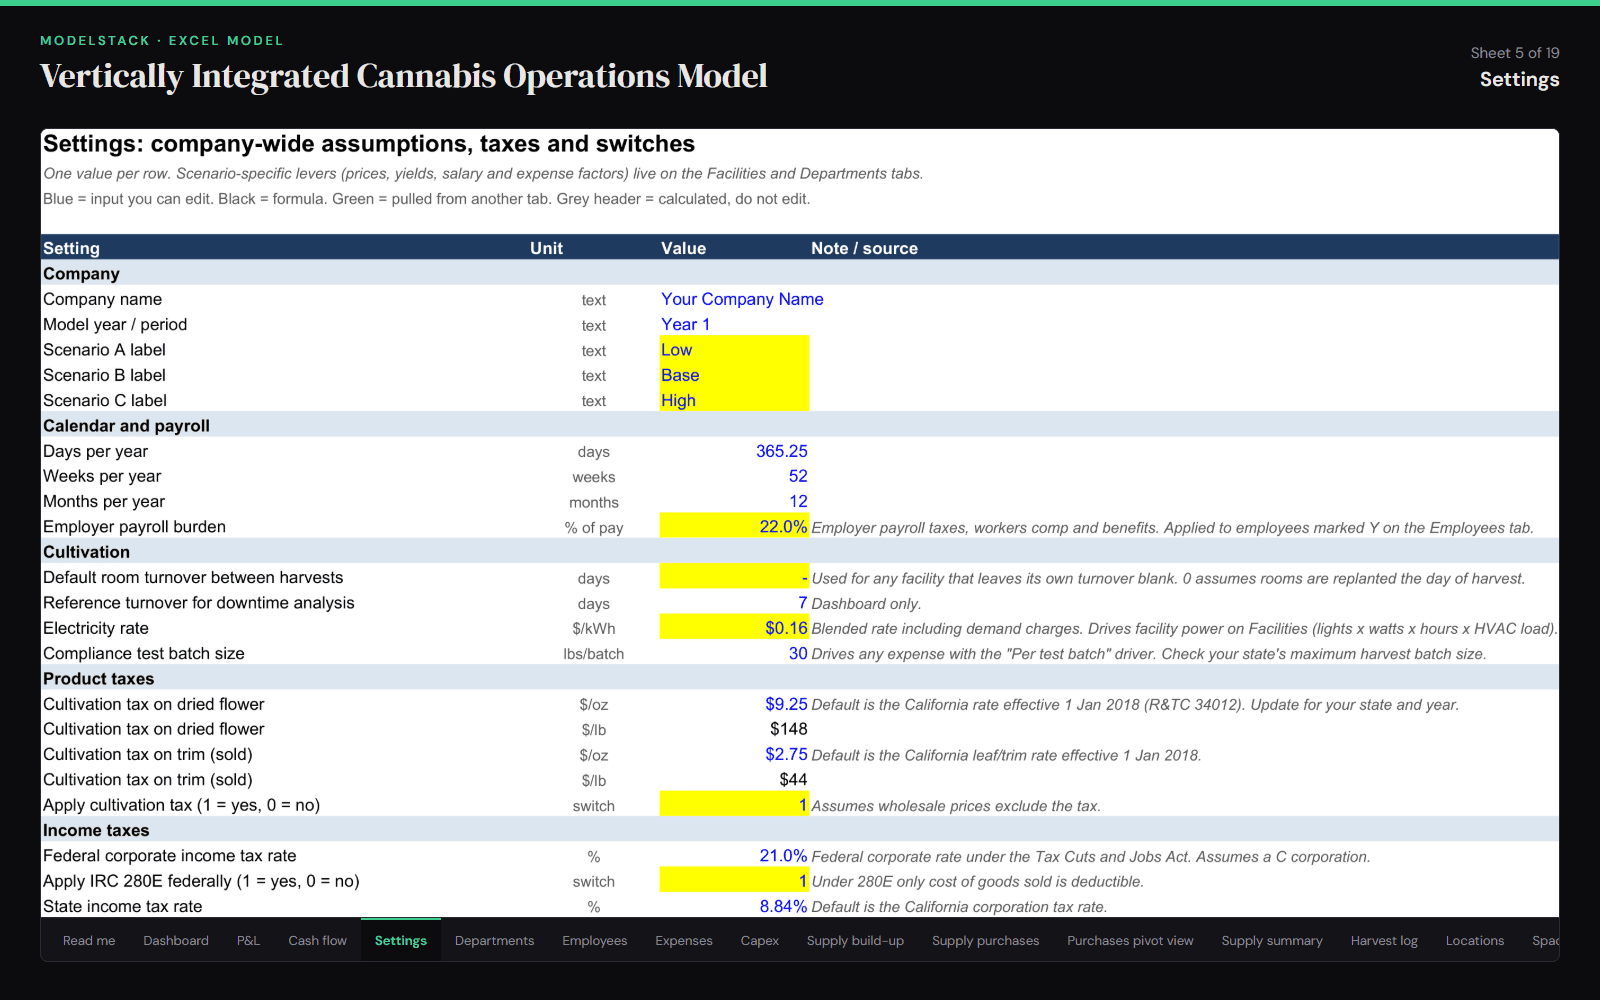
A three-scenario operating model for a vertically integrated cannabis business: cultivation sites, nursery, clone and tissue culture lab, packaging, distribution, marketing and G&A, with cultivation tax, IRC 280E and state income tax built in.
What is inside: 19 tabs, 41,012 formulas. Read me, Dashboard, P&L, Cash flow, Settings, Departments, Employees, Expenses, Capex, Supply build-up, Supply purchases, Purchases pivot view, Supply summary, Harvest log, Locations, Space allocation, Facilities, Other revenue, Lists.
How it works
You type only on the data tabs (blue cells). Every employee, expense, supply item, capex line and facility carries a Dept ID, and the calculation tabs roll everything up by that ID into ten P&L groups. Groups 1 to 6 are cost of goods sold, so they stay deductible under 280E. Groups 7 to 10 are operating expense, so they do not. Nothing on the Dashboard or P&L is typed in.
- Low / Base / High scenarios side by side on every result, driven by per-department salary and expense factors and per-facility prices and yields.
- IRC 280E and state tax. Federal taxable income adds back non-deductible operating expense. A switch decides whether state tax follows 280E (California does not by default). The model reports the extra tax 280E causes.
- Cultivation and local cannabis taxes per ounce of flower and trim, plus a gross-receipts local tax.
- Cost per pound and per gram by P&L group, the all-in cost before interest and tax, and breakeven flower price both pre-tax and after tax.
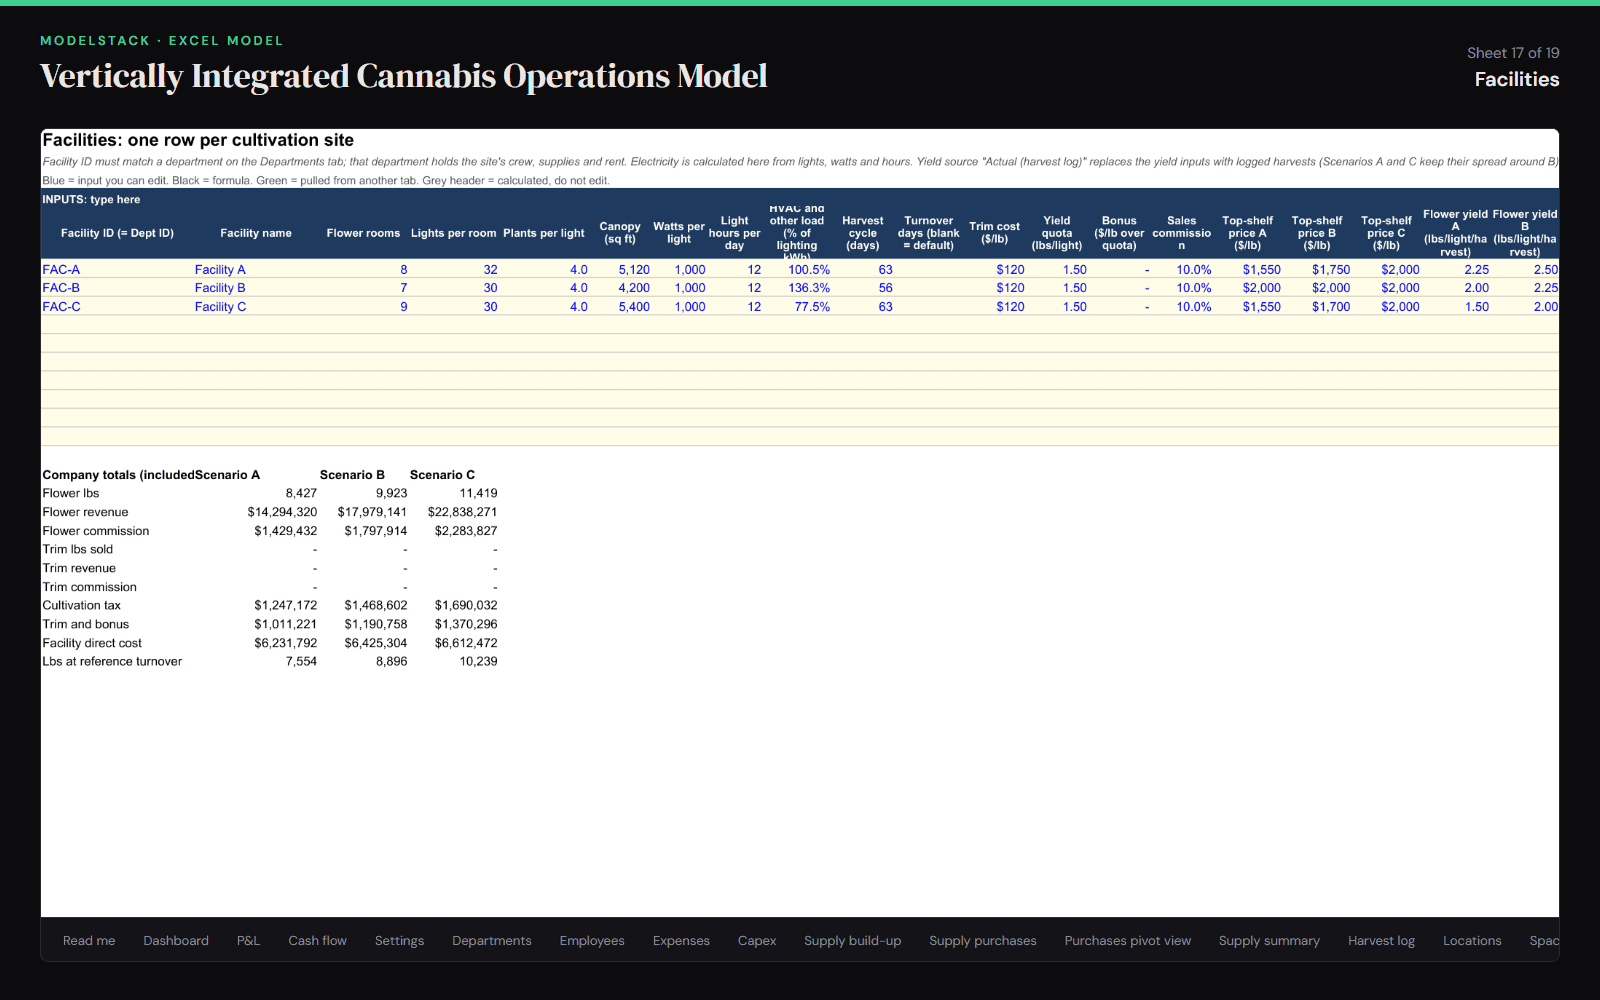
- Facilities: one row per grow, with rooms, lights, plants, canopy, watts, light hours and HVAC load (which drive electricity), harvest cycle, turnover, trim cost, commission, top-shelf price and yield by scenario, smalls and trim. Canopy benchmarks in grams per watt and grams per square foot.
- Supply build-up vs actuals: about 20 categories of grow, nursery and lab supplies estimated per light, plant, room or pound, an invoice log for actual purchases, and a per-department switch between the estimate and annualized actuals.
- Harvest log: set a facility’s yield source to actuals and the model uses logged yield per light, smalls share and trim ratio.
- 36-month cash flow ramp for the scenario you choose: facilities start, reach first harvest and ramp on their own schedules, sales lag harvest by the cure period and cash lags sales by payment terms. Includes capex, equity, a loan schedule, monthly tax estimates, peak funding need and a simplified year-end balance sheet.
- Rent and building bills entered once per location and split across departments by square feet or percent. Straight-line depreciation by asset class; production-asset depreciation is deductible under 280E.
- Sensitivity: base-case EBITDA by flower price and yield, plus the EBITDA cost of room downtime.
Capacity: 250 employees, 150 expenses, 150 capex items, 400 supply items, 1,000 purchases, 500 harvests, 25 departments, 15 locations, 10 facilities and 10 other revenue lines. Formulas are pre-filled to those limits.
Sample data. The workbook ships with illustrative data for a fictional three-site operator so every formula has something to show. Tax defaults follow California (C corporation, 280E on, state tax not following 280E, 1% local tax) and every rate is a labelled input on Settings.
Verified before publication. The workbook was recalculated from scratch under LibreOffice and audited on the recalculated values: 0 formula errors, and every row of the Dashboard’s data-checks section at zero. Every formula is visible and every cell is unlocked. There are no macros, no hidden sheets and no password protection.
Format: a single .xlsx workbook for Excel. Results are planning estimates, not tax, legal or accounting advice.
Similar ProductsOther customers were also interested in...



 eFinancialModels
Electric Vehicle (EV) Charging Station Financial M...
With this comprehensive 5- or 10-year monthly tool, investors can assess the viability of setting up... Read more

Financial Model for Mobile App | Mobile App Busine...
The Mobile App Financial Plan Template in Excel allows you to develop financial projections when lau... Read more

 HenrySheykin
Food Truck Financial Model Excel Template
The Food Truck Financial Model helps entrepreneurs, founders, business owners, consultants, and anal... Read more

Green Hydrogen Production from Wind Energy Financi...
The Green Hydrogen from Wind Financial Model aims to comprehensively forecast a horizon of 40 years ... Read more

Simple Mutual Non-Disclosure Agreement Template
Protect your business secrets with ease using our Simple Mutual Non-Disclosure Agreement Template. S... Read more

Solar Energy Financial Model
The Solar Energy Financial Model Spreadsheet Template in Excel assists you in preparing a sophistica... Read more

 Peter Graf
The Customer-Centric Financial Model for Restauran...
Starting a restaurant without a financial plan is like driving a car blindfolded. You wouldn´t do i... Read more
You must log in to submit a review.