
0 ITEMS

Payment Fraud & Scam Loss Analyzer Financial Model – ACH, Instant Payments, APP, Chargebacks, Threshold Tuning & Control ROI
A decision-focused payment-fraud economics model for banks, fintechs, payment processors, credit unions, merchant acquirers and advisory teams that need to connect fraud detection performance with monetary losses, false positives, investigation capacity and control-investment economics.








Payment Fraud & Scam Loss Analyzer Financial Model
🔍 Turn fraud signals into an economic decision system – not just another risk dashboard.
Payment fraud teams often have plenty of alerts but still struggle to answer the questions that matter to management: Which risk threshold should we use? How much fraud are we actually capturing? What is the cost of false positives? How much loss is prevented versus retained? Do we have enough investigators? Are our controls economically justified? And how do those answers change under worse or better fraud conditions?
This premium Excel model connects those questions in one transparent, editable workflow. It combines transaction-level fraud indicators, weighted rule scoring, threshold optimization, detection-performance metrics, fraud-loss economics, APP reimbursement analysis, card/VAMP-style monitoring, investigation-capacity planning, scenario analysis, sensitivities and a five-year control-investment business case.
🎯 What decisions can this model support?
The workbook is built for fraud-risk, payments operations, financial-crime, finance and advisory teams that want to move from isolated fraud KPIs to quantified business decisions.
- Fraud-control planning: define editable rule thresholds, score weights and intervention assumptions before changing operating policy.
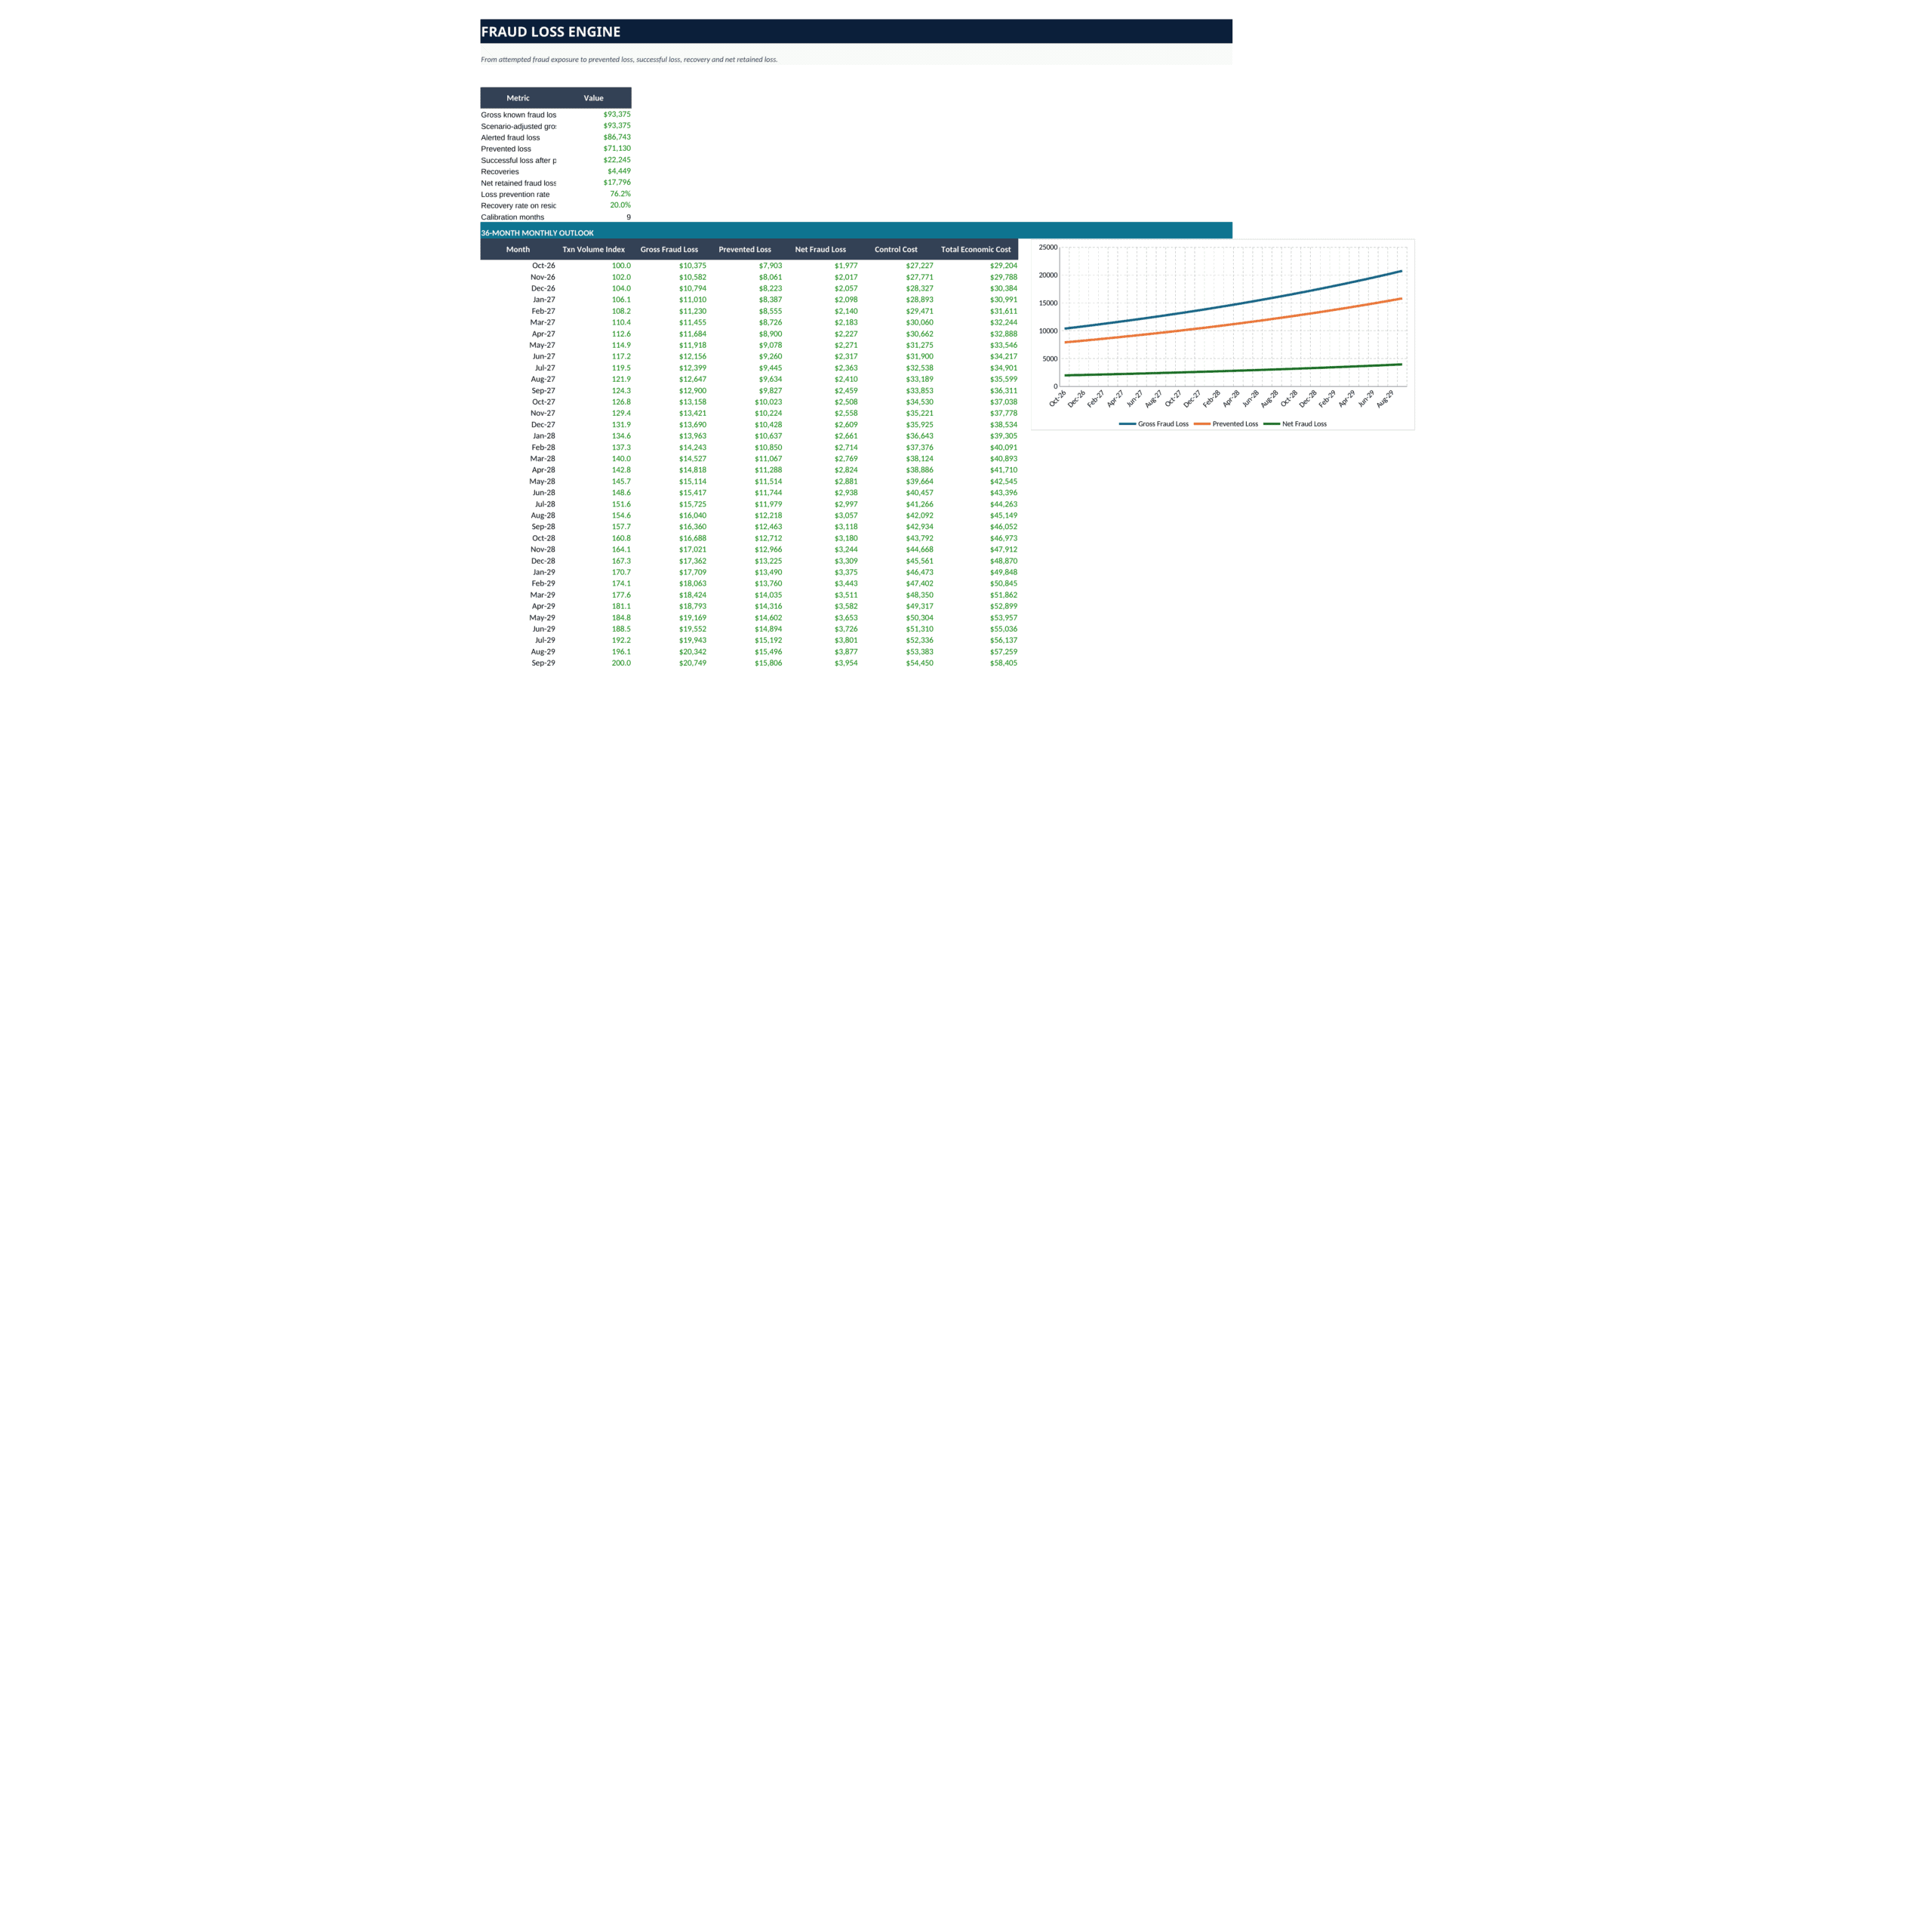
- Forecasting: convert calibrated fraud experience into a 36-month monthly outlook for gross fraud loss, prevented loss, net fraud loss, control cost and total economic cost.
- Profitability / cost impact: quantify the financial effect of analyst staffing, technology, verification, remediation and false-positive friction.
- Cash-flow and budget planning: build an annual control-cost view and a five-year control-investment outlook to understand the timing and scale of required spend.
- Pricing / threshold tuning: compare alert thresholds against fraud capture, false positives, review cost and net economic benefit to identify the modeled optimum.
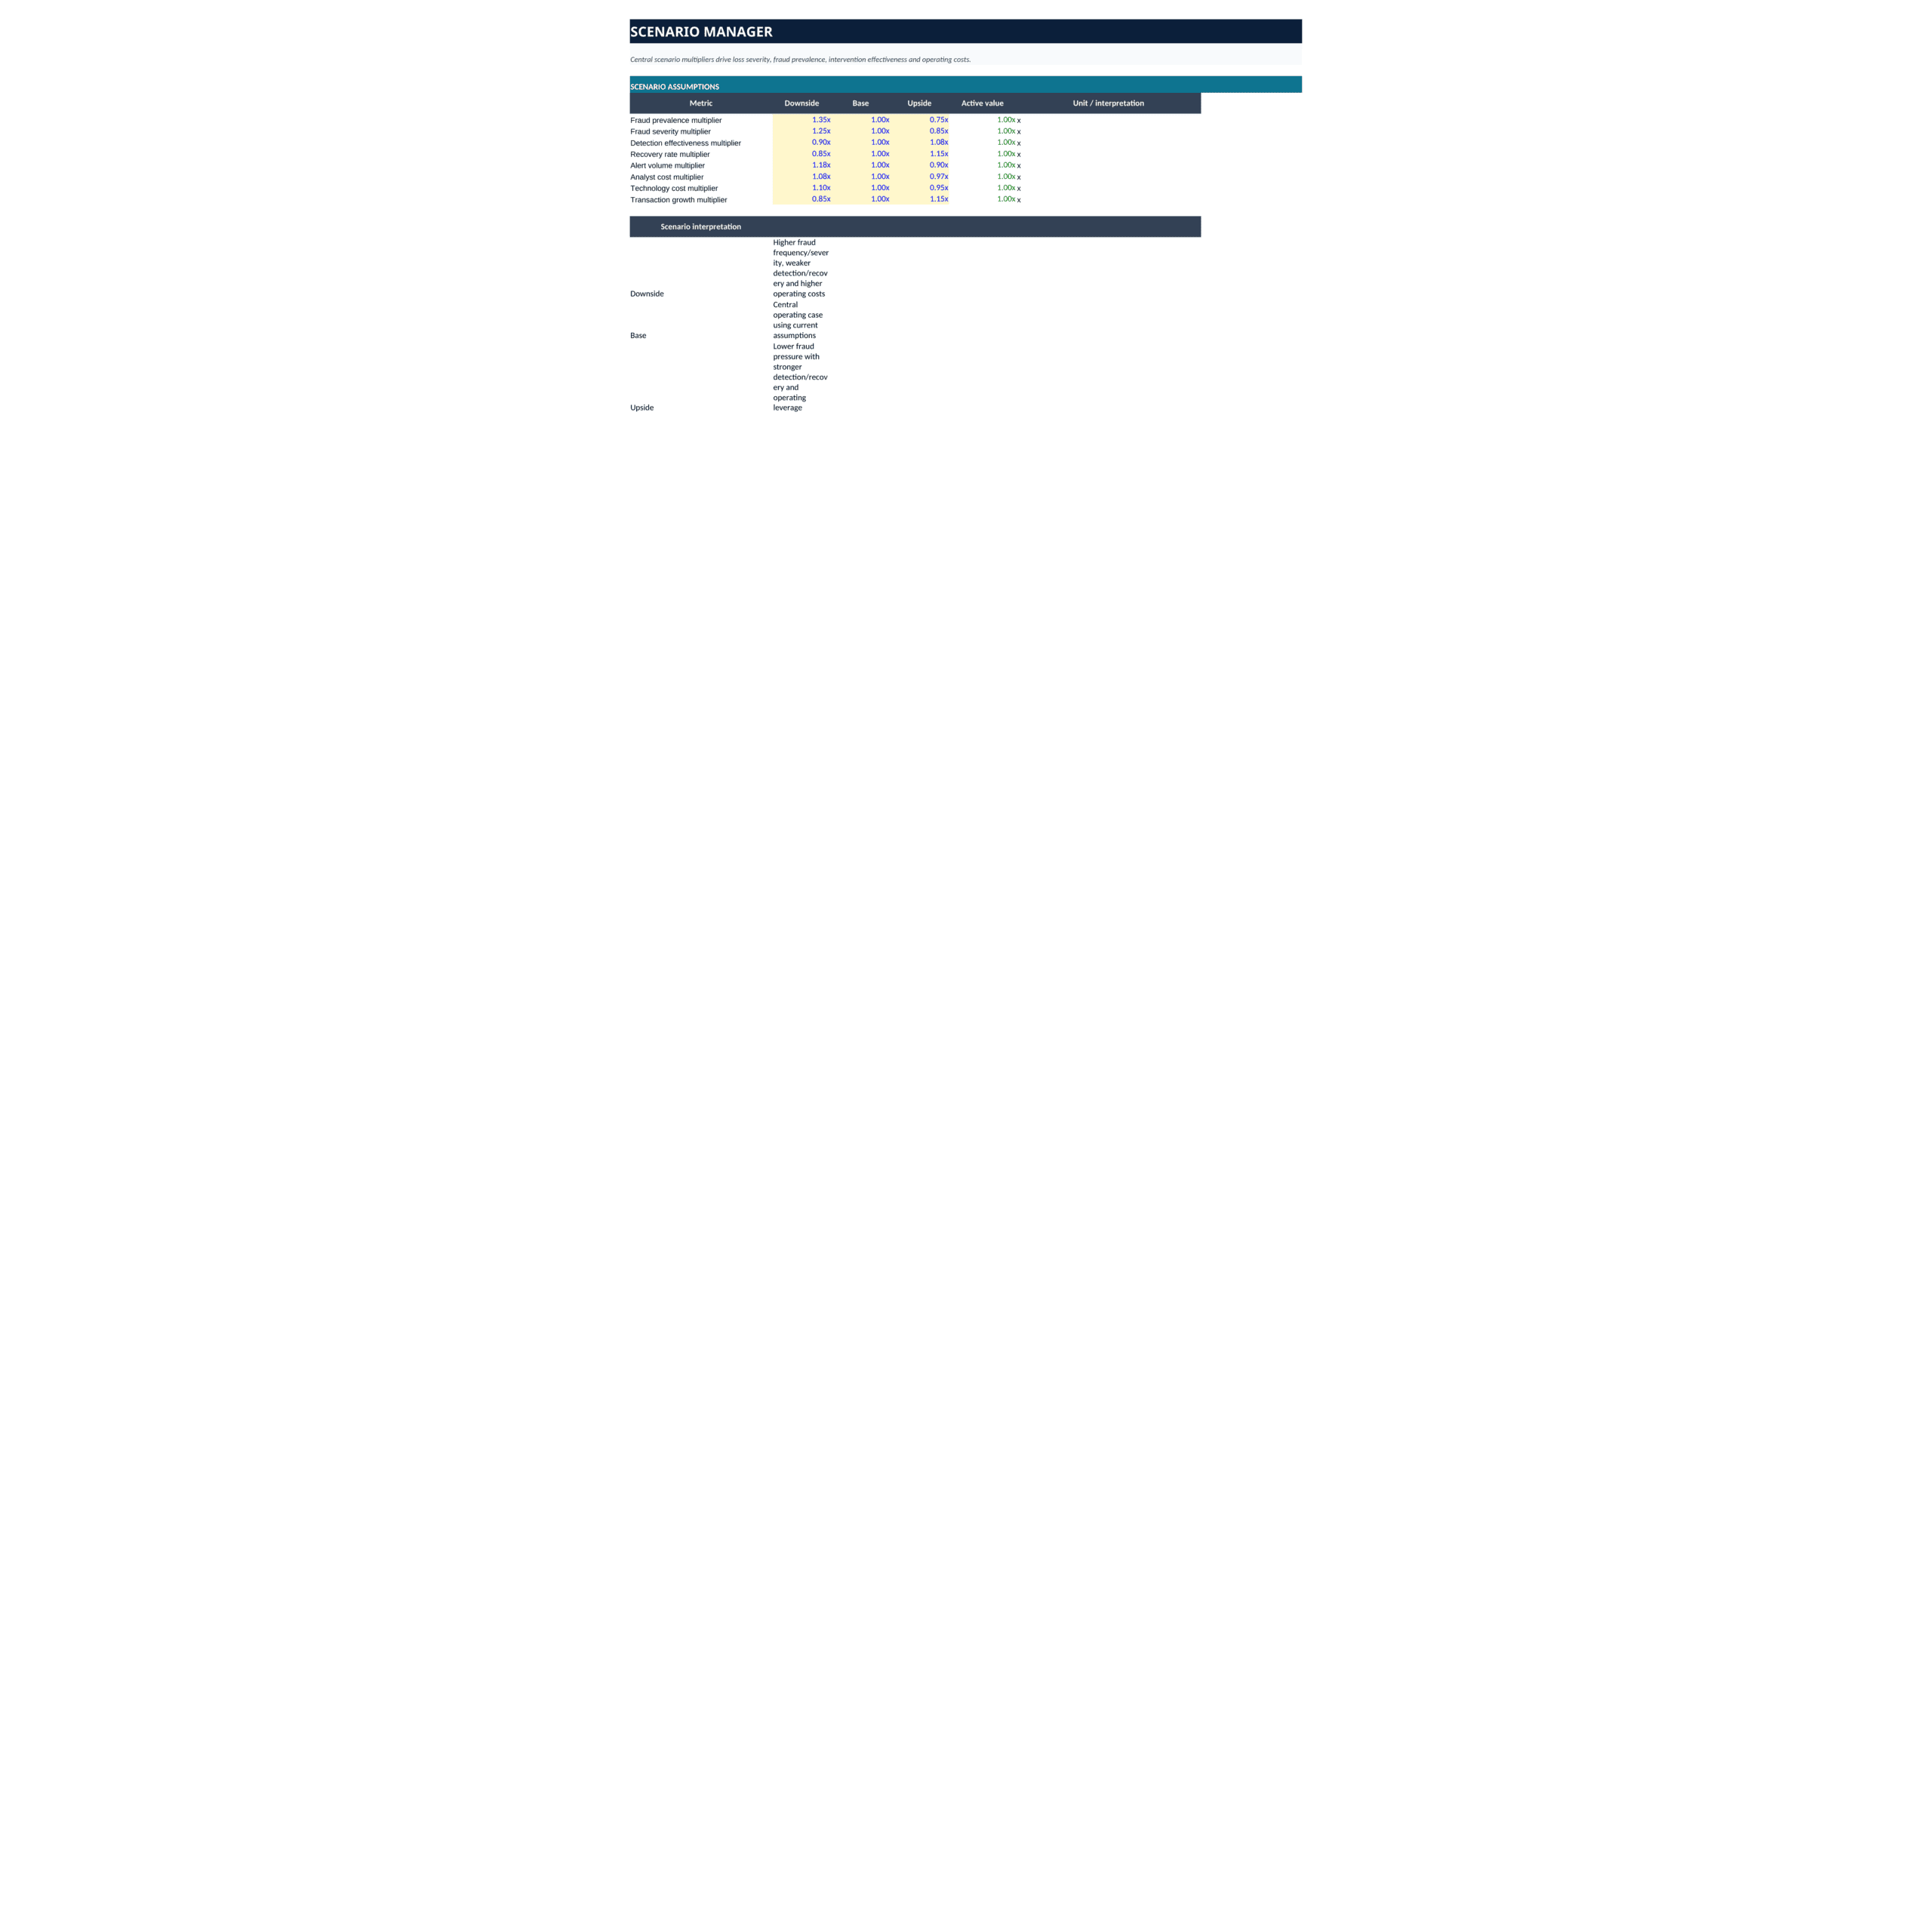
- Scenario planning: stress fraud prevalence, severity, detection effectiveness, recovery rates, alert volumes, analyst cost, technology cost and transaction growth under Downside, Base and Upside cases.
- Sensitivity analysis: test how retained fraud loss changes as fraud prevalence and detection effectiveness move, and how threshold economics respond to different false-positive costs.
- Operational planning: translate alert volumes into review hours, required FTEs, utilization, backlog and SLA status.
- Payment-rail analysis: compare ACH, instant payments, APP and wire fraud cases, losses, prevented losses and retained exposures.
- Control-investment valuation: assess annual net benefit, control ROI, payback and five-year discounted net benefit / NPV.
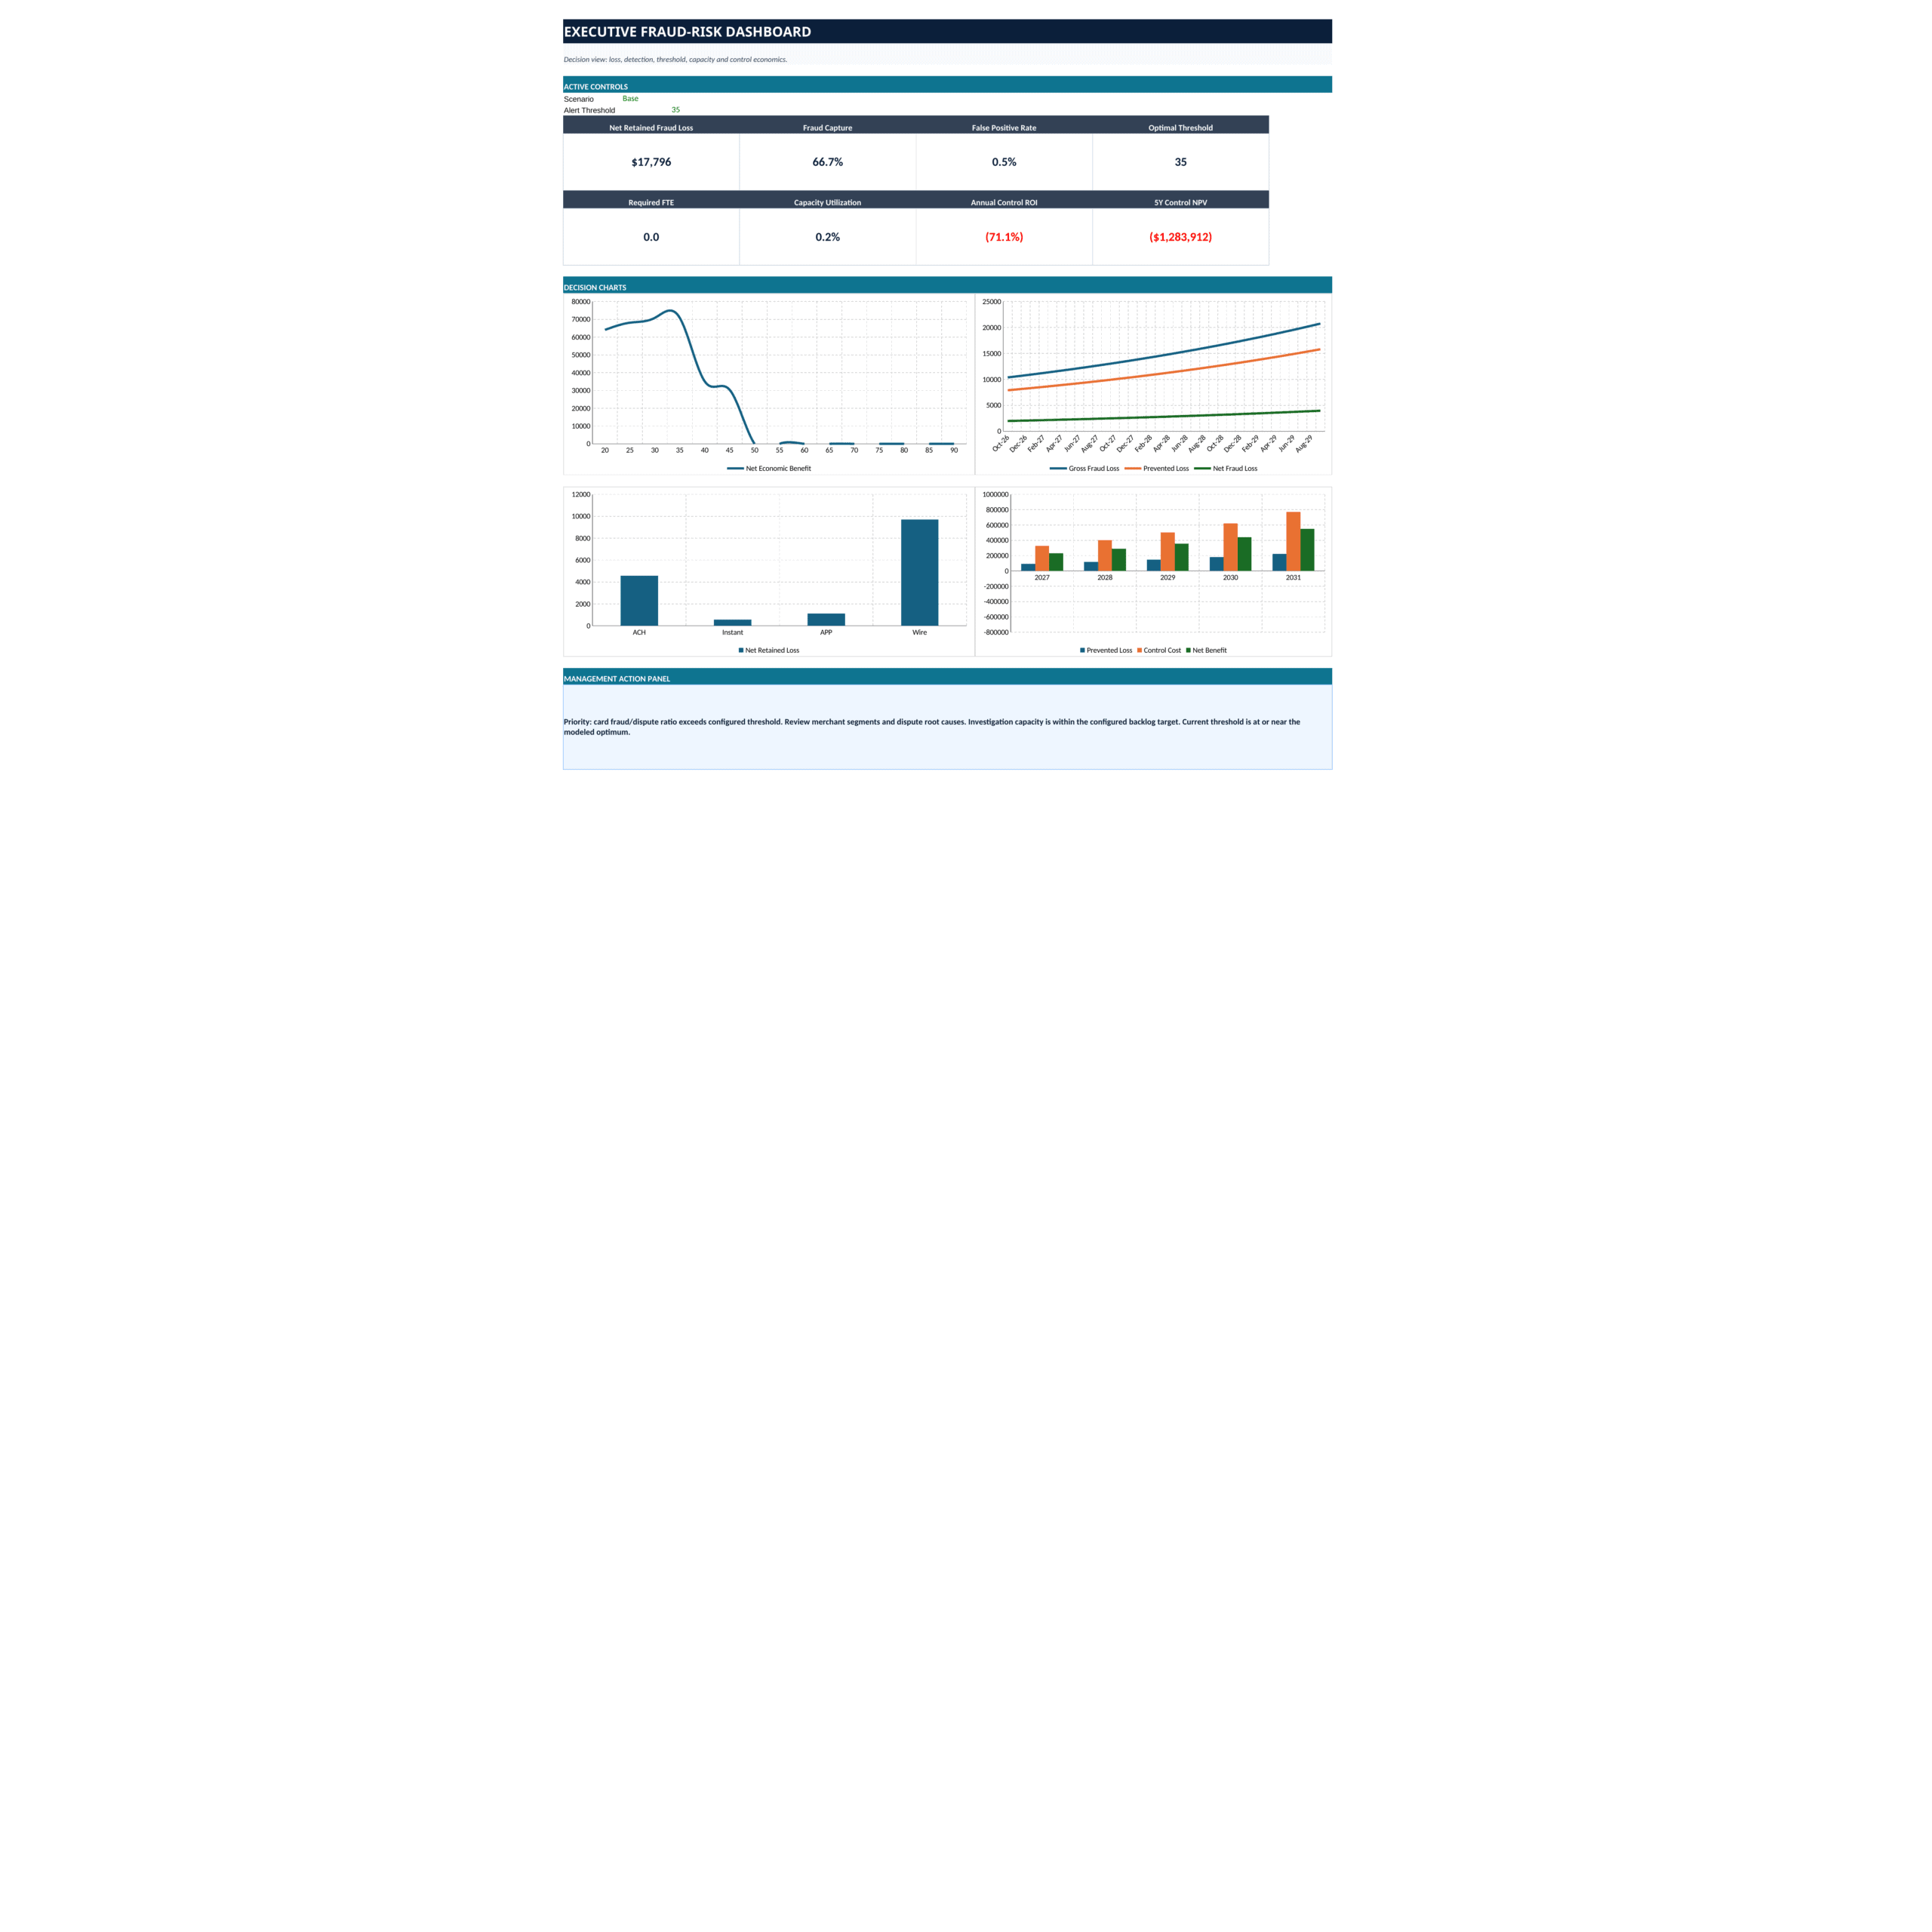
- Executive reporting: communicate fraud loss, capture performance, threshold position, staffing and investment economics through a compact management dashboard.
🧭 Model workflow
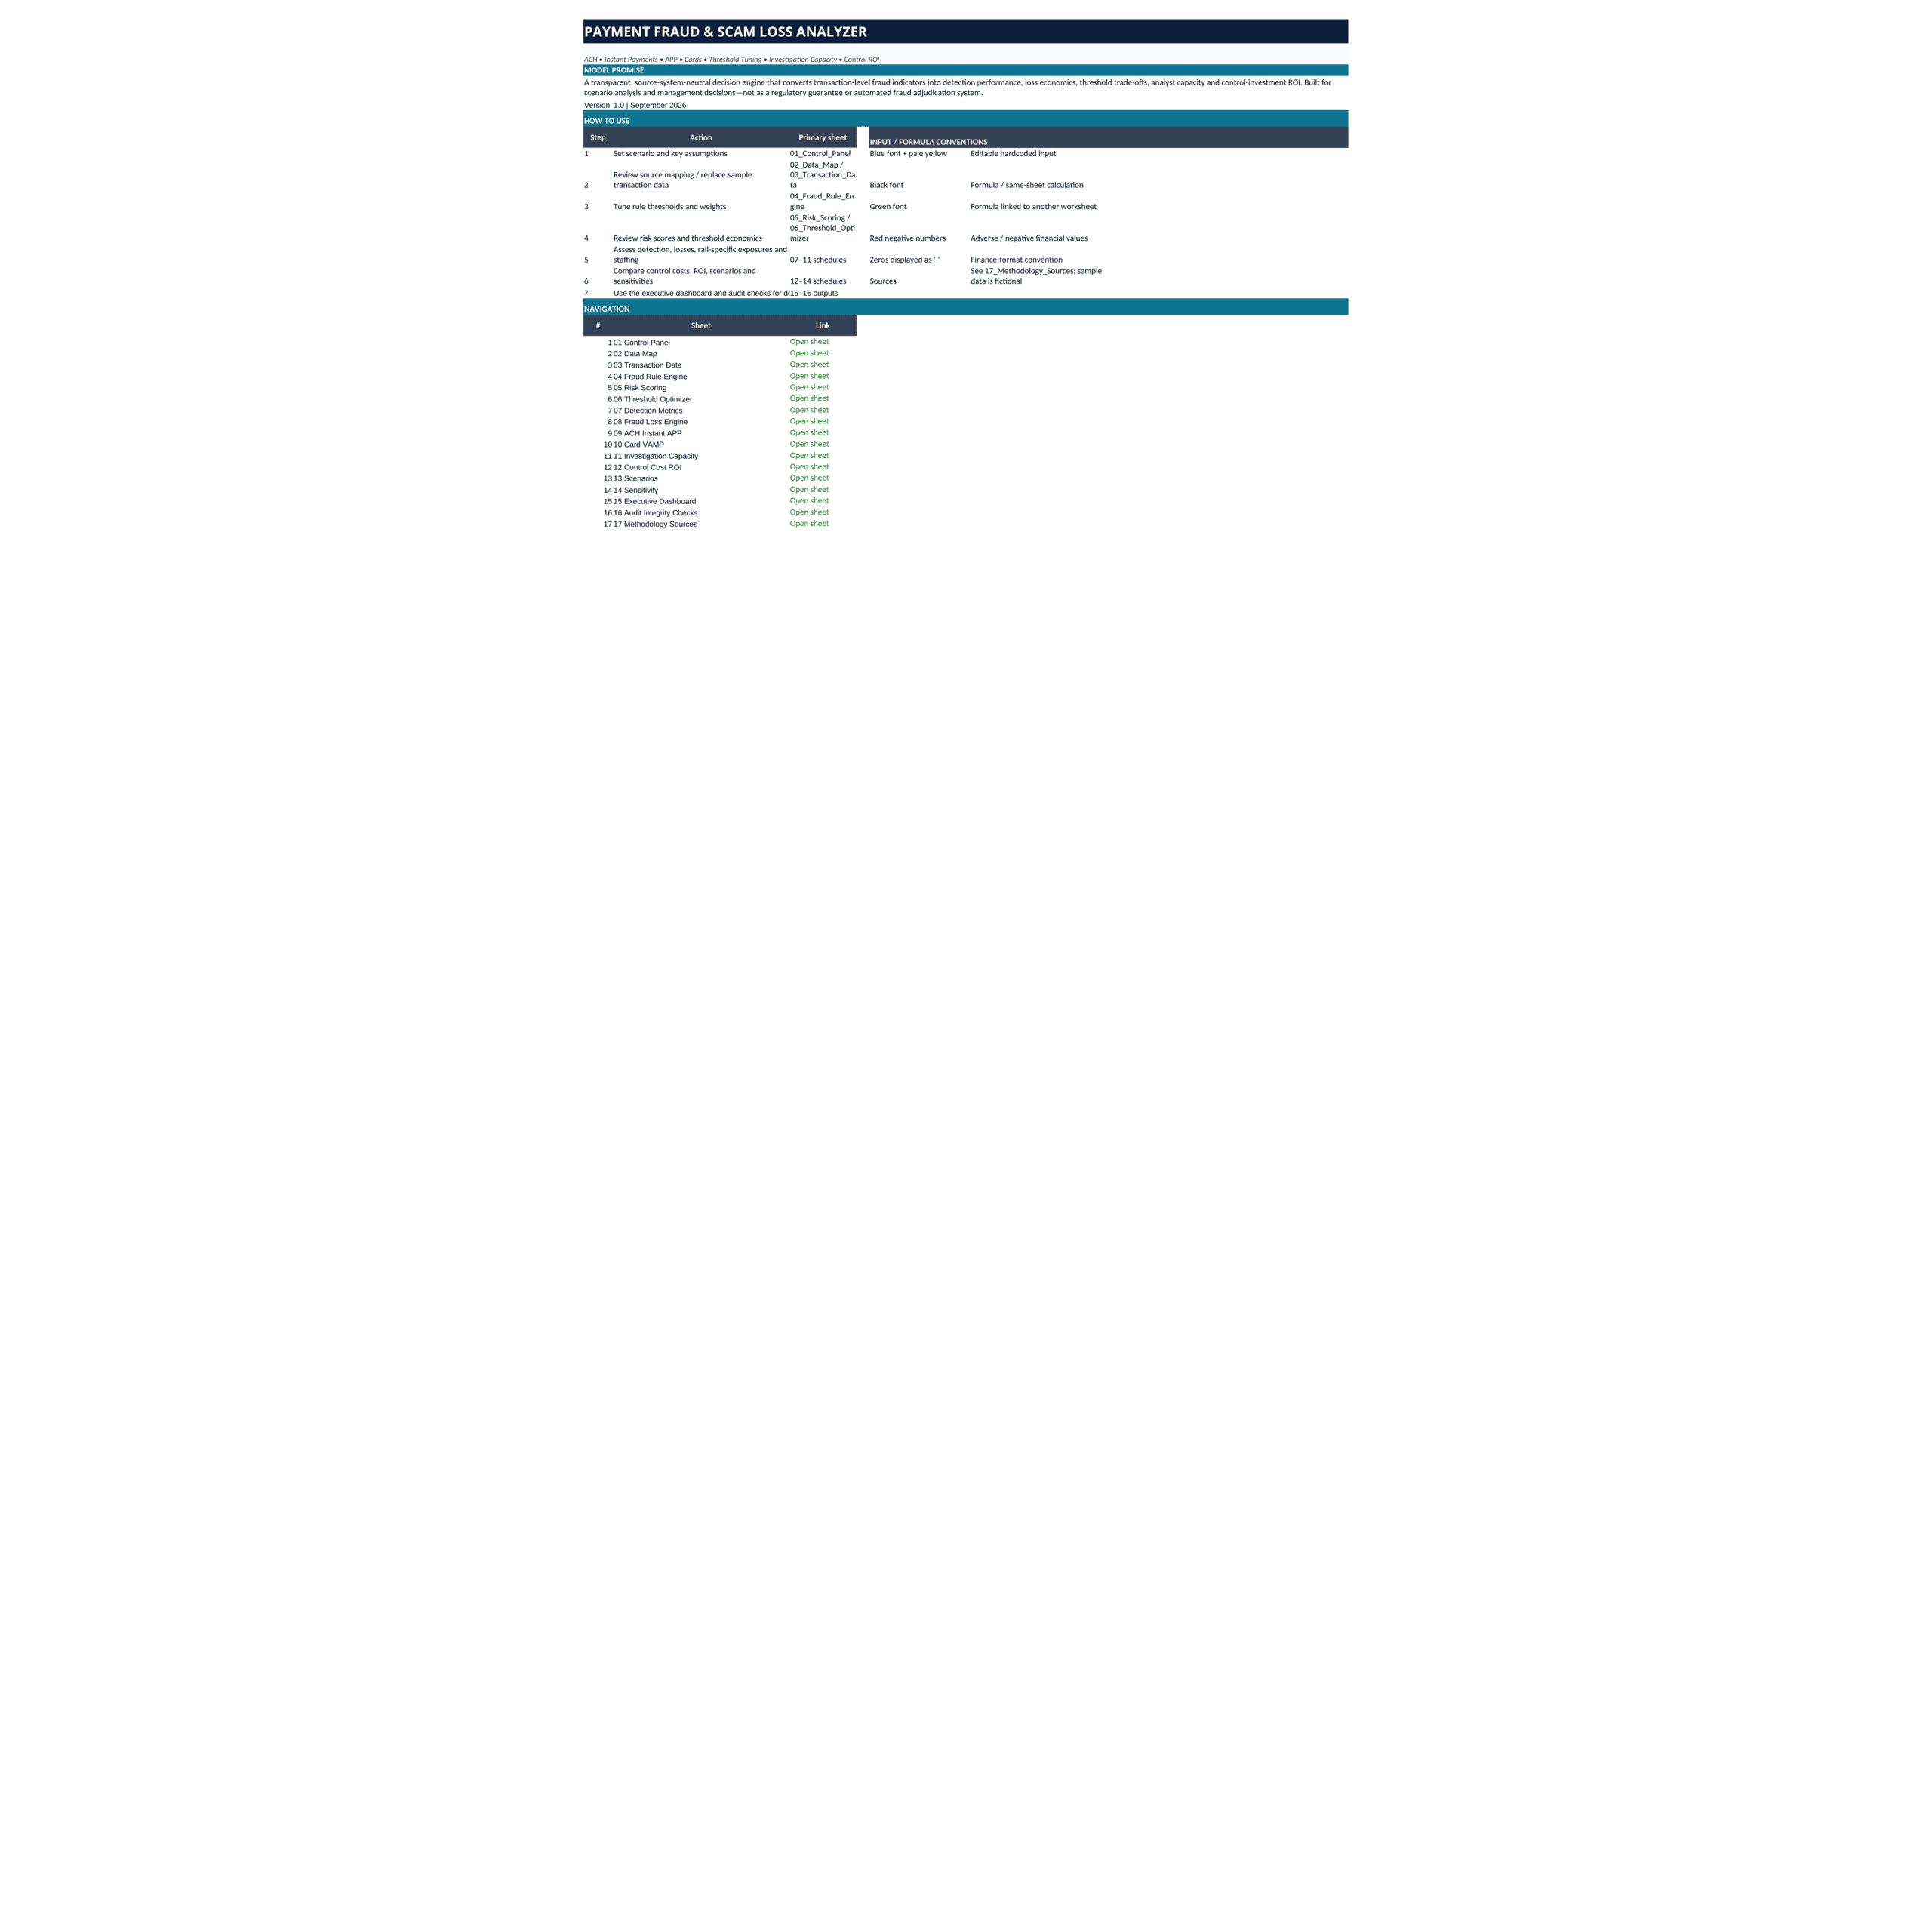
The workbook follows a clear decision sequence. Start in 01_Control_Panel to choose the active scenario and edit operational assumptions. Use 02_Data_Map to understand the required import fields, then replace or extend the fictional sample in 03_Transaction_Data. The sample includes 240 transactions across multiple payment rails and is designed to demonstrate every calculation.
04_Fraud_Rule_Engine applies transparent rule logic to indicators such as transaction amount, 24-hour velocity, account age, historical deviation, new beneficiaries, geography and device anomalies. Each rule has an editable weight. 05_Risk_Scoring converts those rule points into a 0-100 risk score, classifies alerts and enhanced-review cases, and compares the model decision with the known sample fraud outcome.
⚙️ Threshold optimization and detection quality
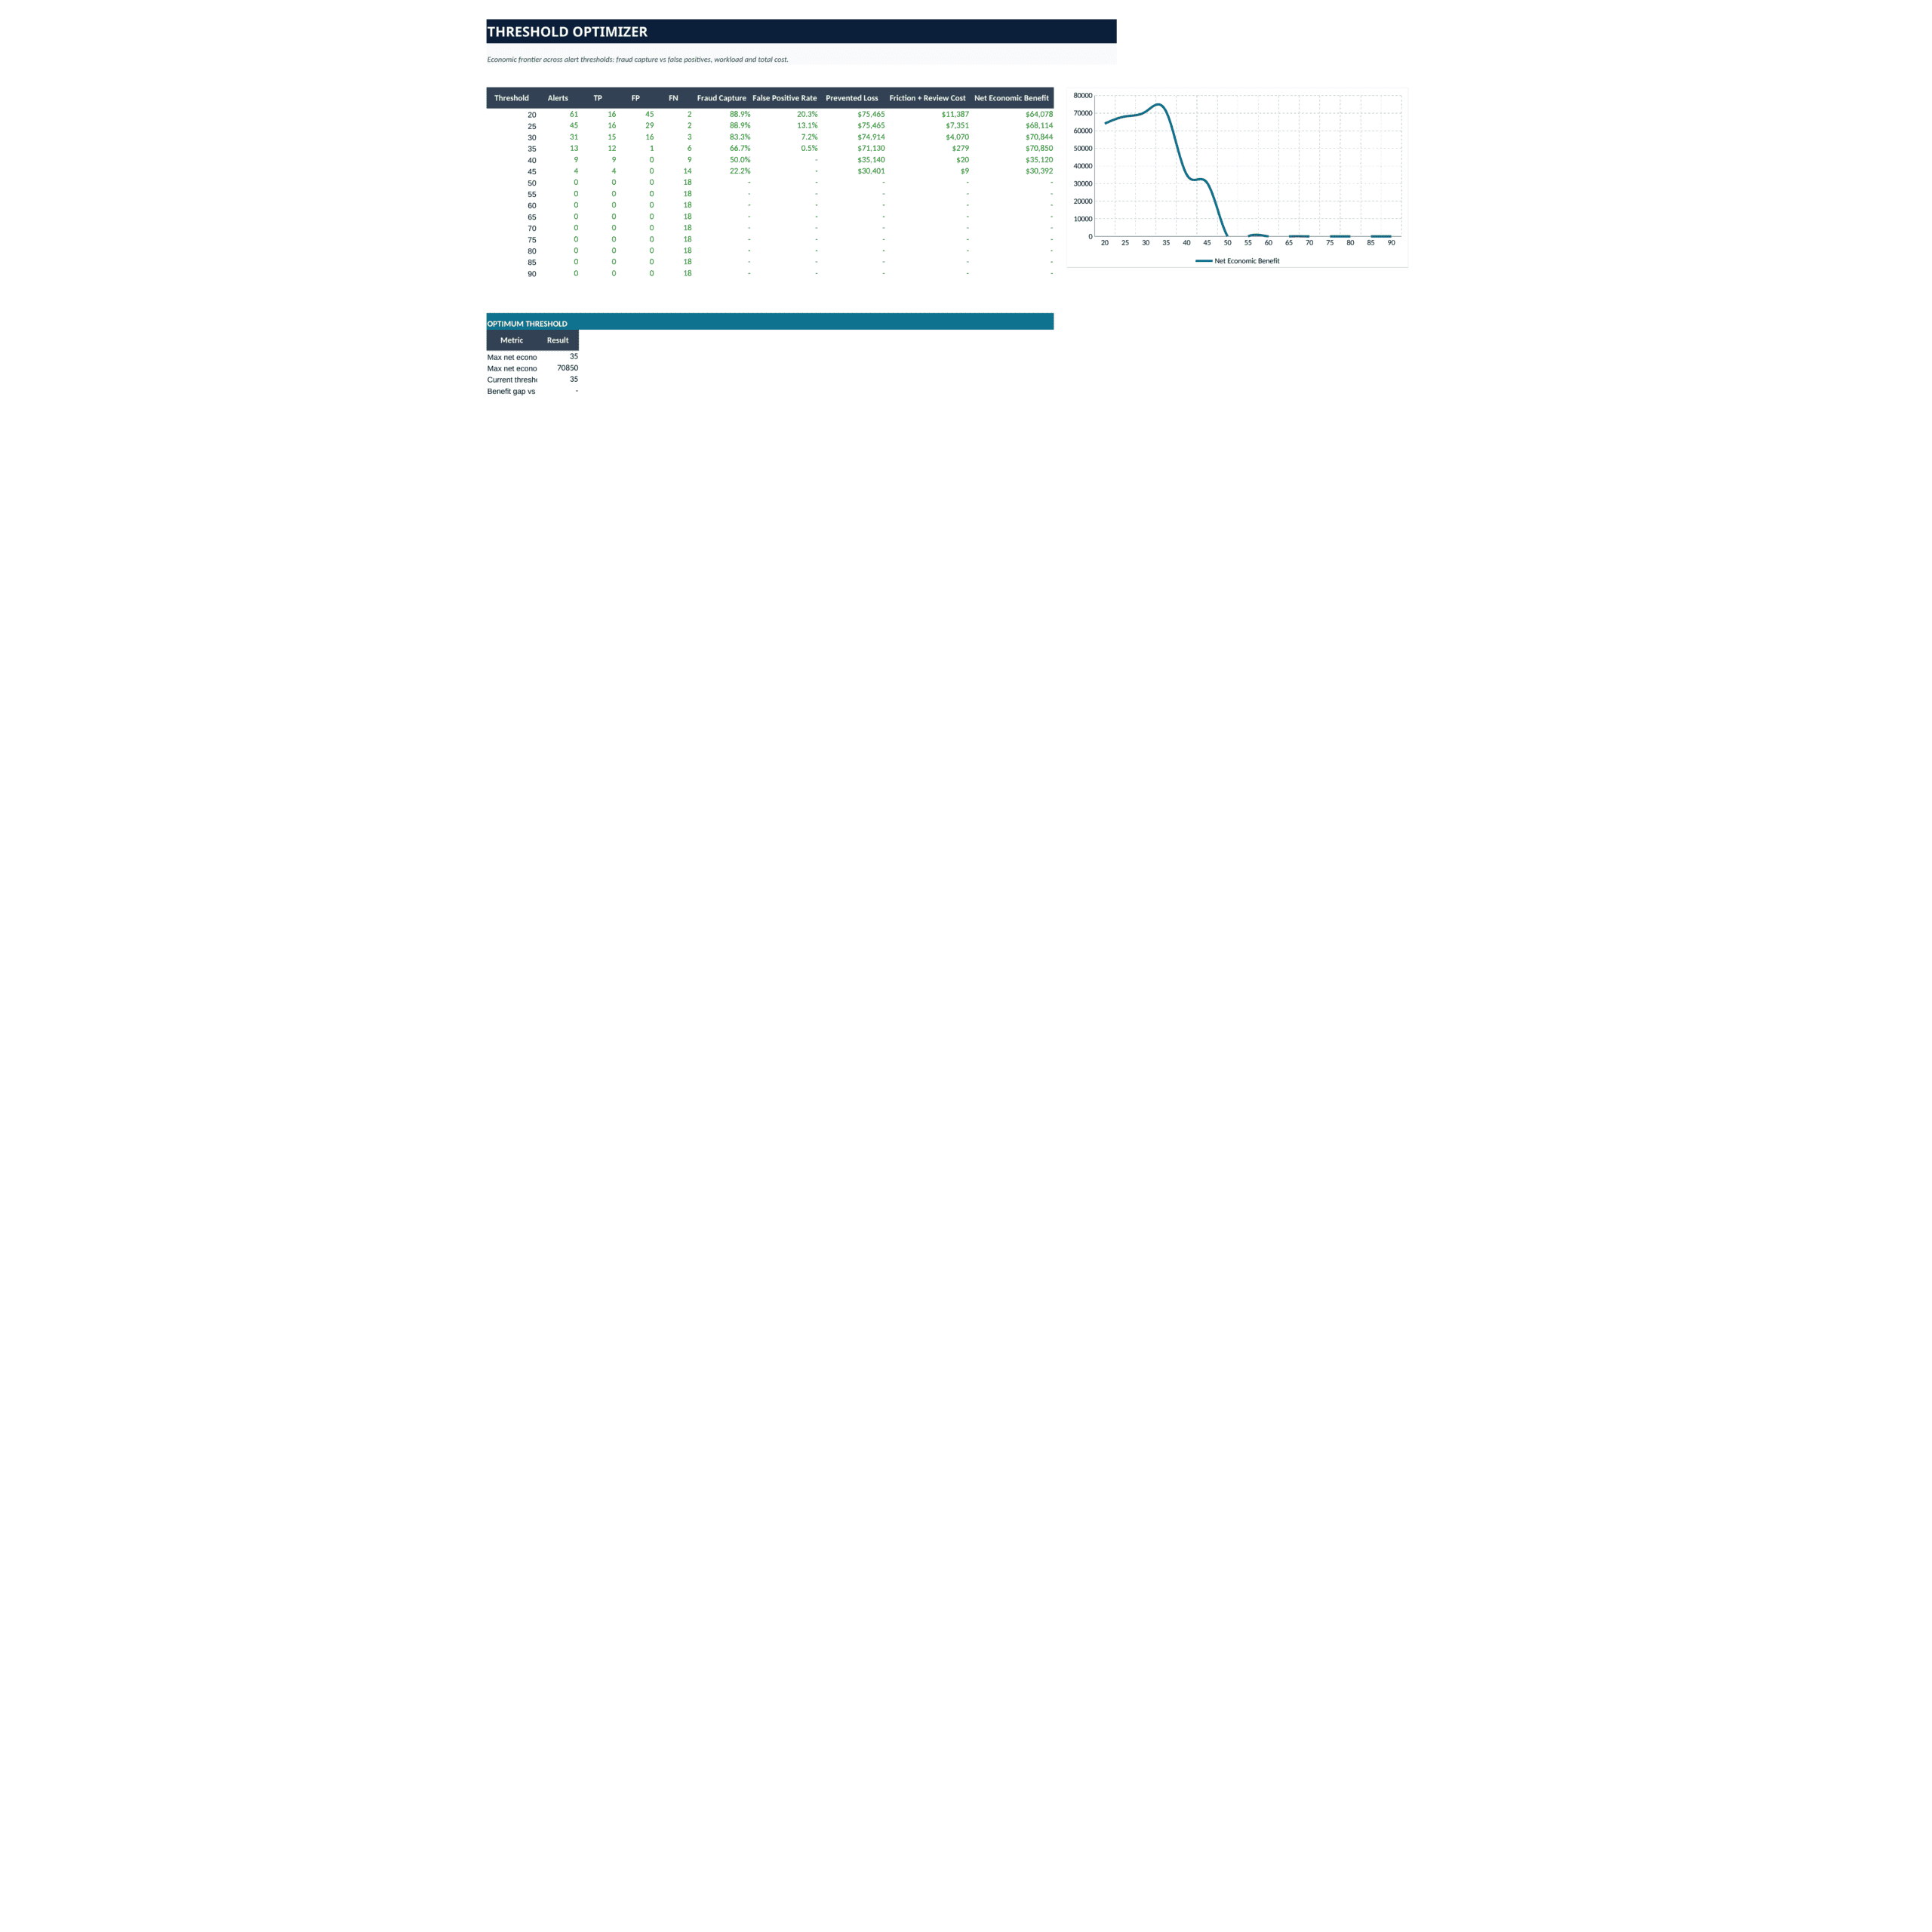
06_Threshold_Optimizer tests multiple alert cut-offs and calculates alert volume, true positives, false positives, false negatives, fraud capture, false-positive rate, prevented loss, review/friction cost and net economic benefit. The current workbook identifies a modeled optimum from the tested threshold range and shows the benefit gap versus the active setting.
07_Detection_Metrics provides the confusion matrix and core performance KPIs: fraud prevalence, alert rate, precision, recall / fraud capture, false-positive rate, specificity, F1 score and monetary loss capture. Management interpretation fields help distinguish strong versus weaker areas without hiding the underlying math.
💸 Fraud-loss economics
08_Fraud_Loss_Engine bridges gross known fraud loss to scenario-adjusted loss, alerted fraud loss, prevented loss, successful loss, recoveries and net retained fraud loss. It also includes the 36-month outlook so users can see how fraud economics evolve as transaction volumes and scenario assumptions change.
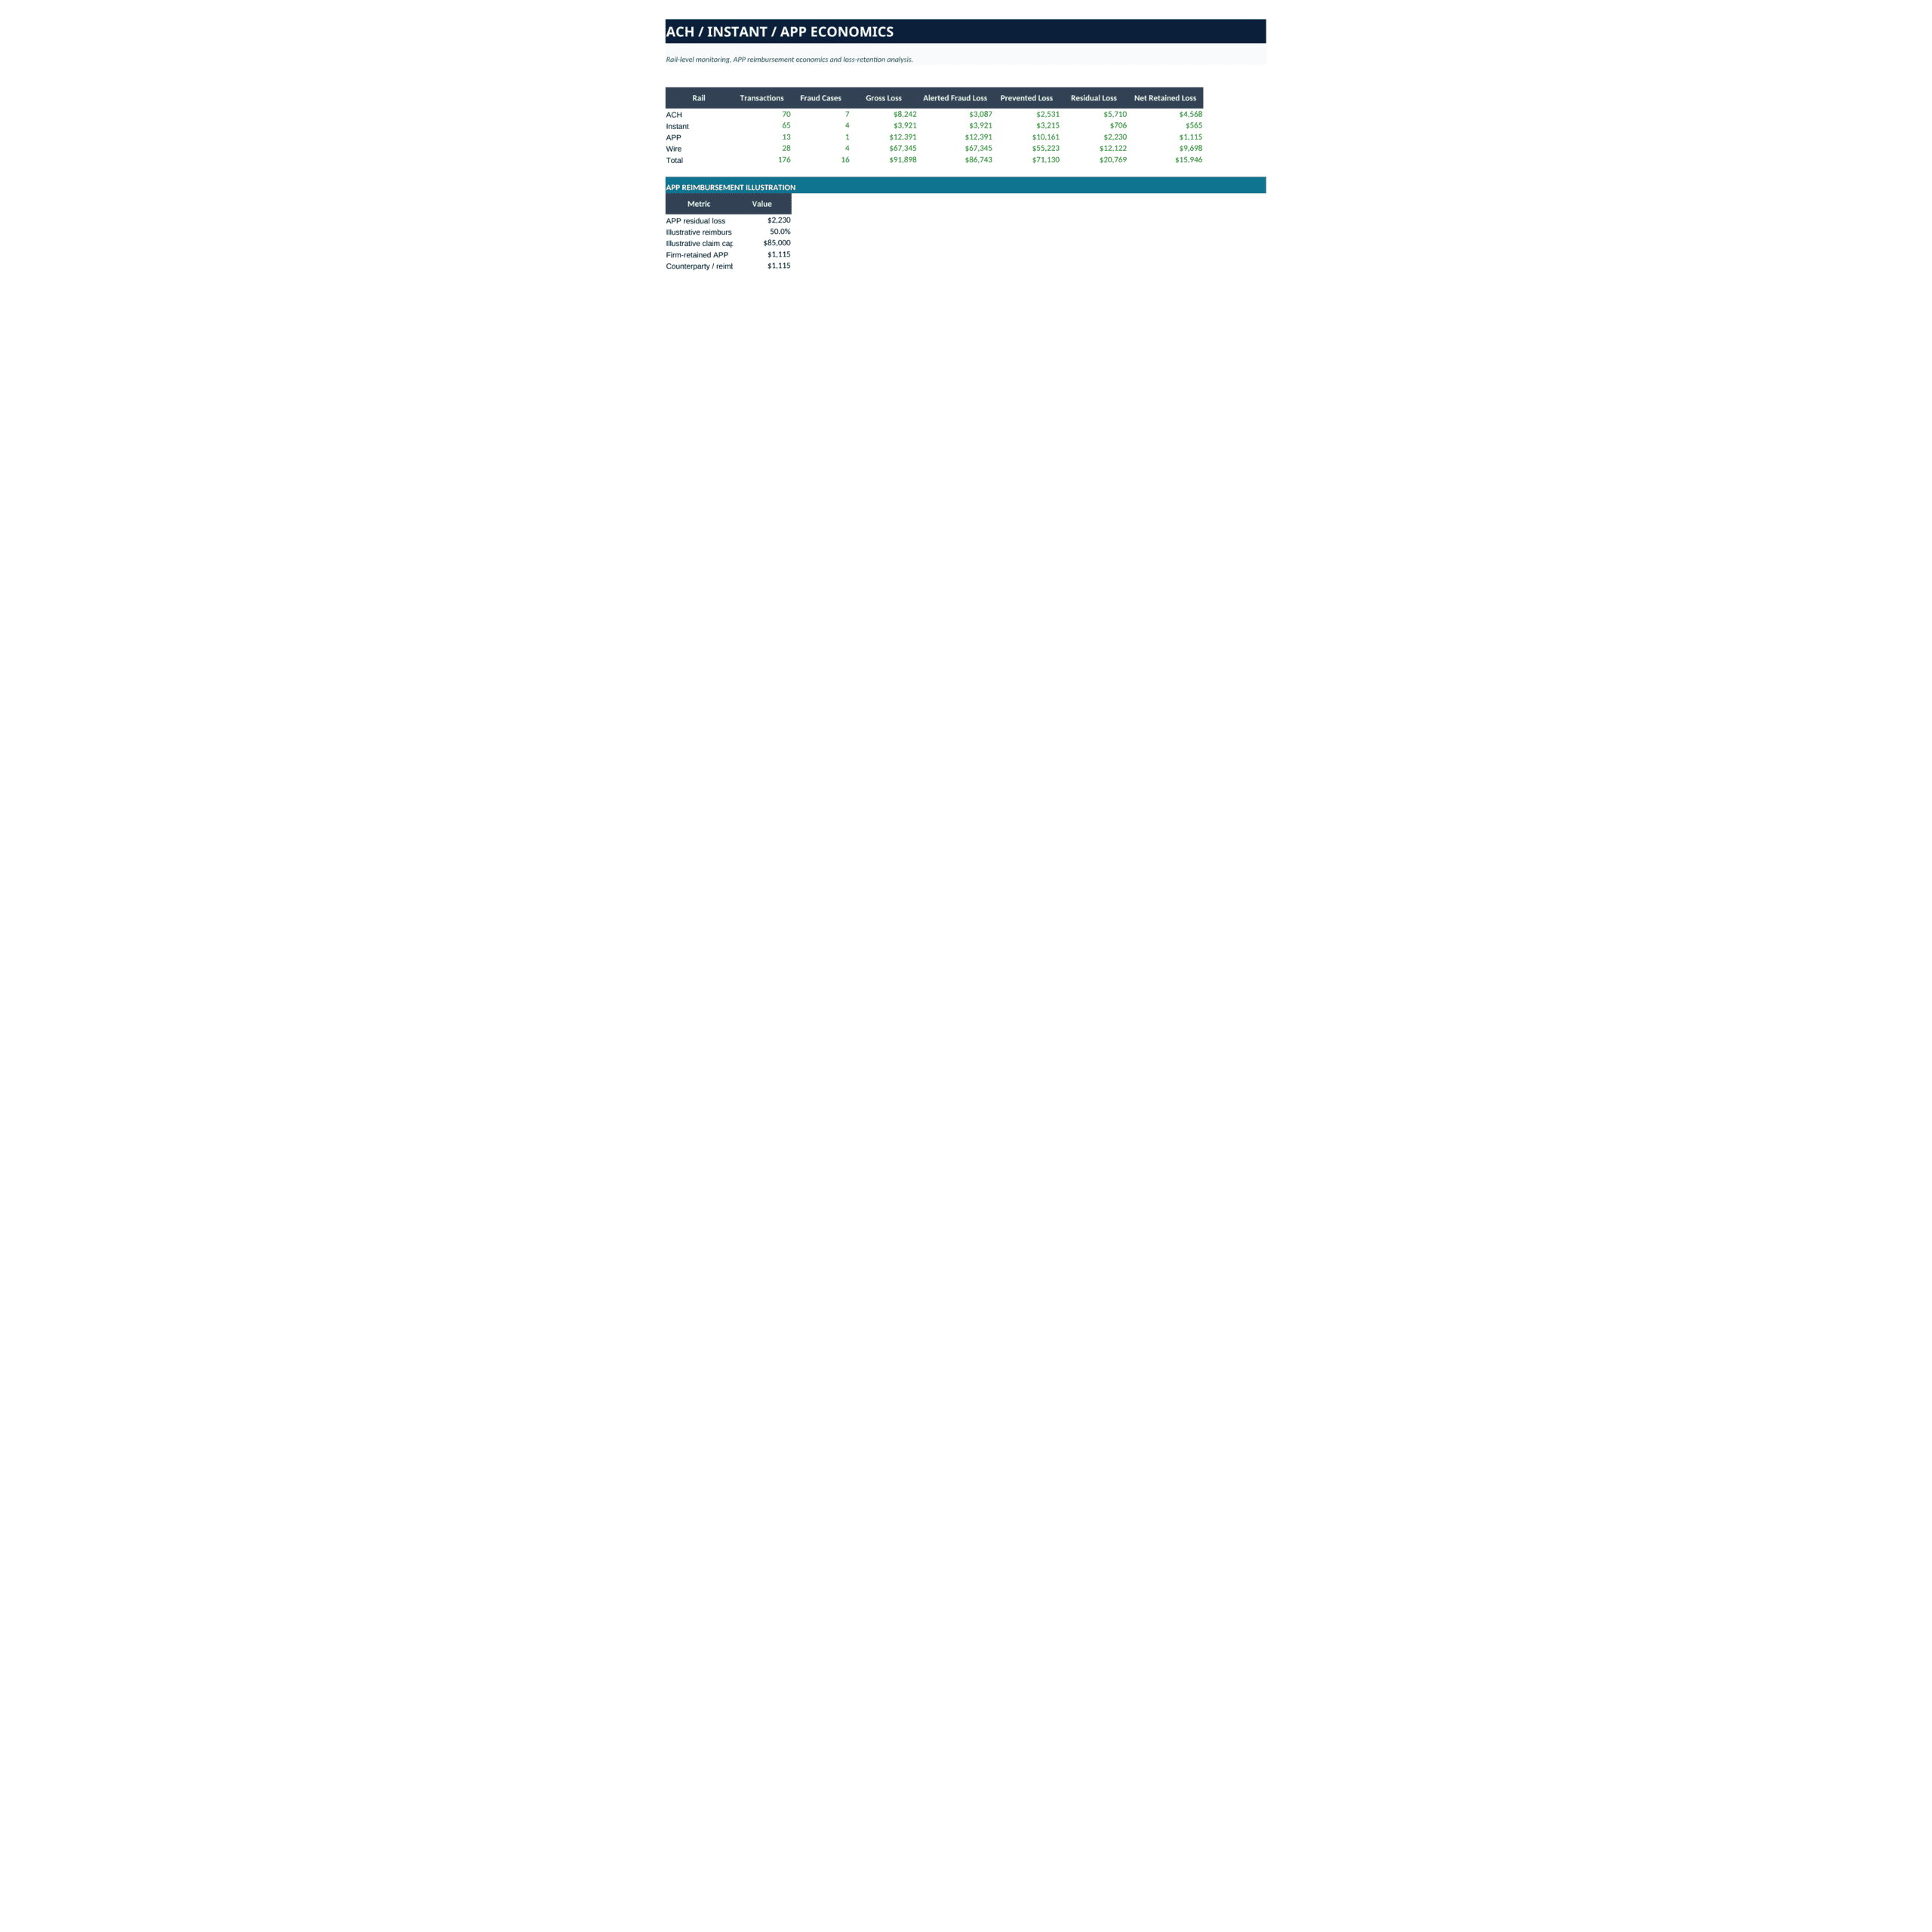
09_ACH_Instant_APP breaks out transactions, fraud cases, gross loss, alerted loss, prevented loss, residual loss and net retained loss by ACH, instant payments, APP and wire activity. A separate APP section models editable reimbursement sharing, claim-cap assumptions and the resulting firm-retained exposure.
10_Card_VAMP adds a focused card fraud / dispute monitor with card transaction counts, fraud cases, illustrative disputes, a VAMP-style ratio, configured threshold, headroom or breach and dispute-handling cost. The status panel converts those values into an operating action signal.
👥 Investigation capacity and control ROI
11_Investigation_Capacity converts alerts and enhanced reviews into case hours, productive hours, required FTEs, utilization, excess or surplus capacity, backlog days and SLA status. A monthly capacity outlook lets operations teams see whether growth or stressed scenarios create a staffing problem.
12_Control_Cost_ROI brings the economics together. It calculates analyst cost, technology cost, verification cost, remediation cost, total annual control cost, annual prevented loss, false-positive friction, annual net benefit, ROI and payback. The five-year outlook extends gross fraud exposure, prevented loss, control cost, friction cost and discounted net benefit through 2031 in the current sample setup.
📊 Scenarios, sensitivities and dashboard
13_Scenarios contains explicit Downside, Base and Upside multipliers. 14_Sensitivity includes two-way tables for fraud prevalence versus detection effectiveness and alert threshold versus false-positive cost. 15_Executive_Dashboard presents the active scenario and threshold alongside KPI cards for retained fraud loss, fraud capture, false-positive rate, optimal threshold, required FTE, capacity utilization, annual control ROI and five-year control NPV, supported by four decision charts and an action panel.
✅ Controls, transparency and editability
16_Audit_Integrity_Checks independently checks rule-weight totals, score bounds, confusion-matrix reconciliation, fraud-case and gross-loss totals, recovery constraints, threshold bounds, APP loss logic, card denominator validity, capacity positivity, control costs, scenario multipliers, sensitivity bounds and optimizer recomputation. 17_Methodology_Sources documents the calculation approach and the dated source references used for the model framework.
Editable assumptions are centralized and visually distinguished from formulas. The model uses fictional sample data so every schedule, sensitivity and chart is populated immediately, while the import map makes it straightforward to replace the sample with institution-specific data.
👤 Intended users
This model is designed for banks, credit unions, fintechs, payment processors, merchant acquirers, fraud-risk teams, payment operations teams, financial-crime functions, CFO / COO teams, consultants and advisors who need a transparent Excel layer for fraud economics and control decisions.
📦 Delivered files
- Client-ready Excel workbook with 18 worksheets
- Full-sheet 18-page PDF preview, one page per worksheet
- 13 buyer-facing PNG screenshots plus a matching screenshot ZIP
The result is a practical fraud analyzer that links detection quality to loss prevention, operating workload and investment economics – giving decision-makers a single place to test what changes, what it costs and whether it is worth it.
Similar ProductsOther customers were also interested in...



 eFinancialModels
Electric Vehicle (EV) Charging Station Financial M...
With this comprehensive 5- or 10-year monthly tool, investors can assess the viability of setting up... Read more

Financial Model for Mobile App | Mobile App Busine...
The Mobile App Financial Plan Template in Excel allows you to develop financial projections when lau... Read more

 HenrySheykin
Food Truck Financial Model Excel Template
The Food Truck Financial Model helps entrepreneurs, founders, business owners, consultants, and anal... Read more

Green Hydrogen Production from Wind Energy Financi...
The Green Hydrogen from Wind Financial Model aims to comprehensively forecast a horizon of 40 years ... Read more

Simple Mutual Non-Disclosure Agreement Template
Protect your business secrets with ease using our Simple Mutual Non-Disclosure Agreement Template. S... Read more

Solar Energy Financial Model
The Solar Energy Financial Model Spreadsheet Template in Excel assists you in preparing a sophistica... Read more

 Peter Graf
The Customer-Centric Financial Model for Restauran...
Starting a restaurant without a financial plan is like driving a car blindfolded. You wouldn´t do i... Read more
You must log in to submit a review.