0 ITEMS

Investment Appraisal: NPV, IRR & Payback in 5 Steps

A project is worth funding when its net present value is positive at the required return, its internal rate of return beats that required return and its payback fits the owner’s payback limit. This guide runs all three measures on one illustrative USD 120,000 production line, with an Excel worked example shown sheet by sheet.
Key Takeaways
- Approve a project when net present value (NPV) is positive and the internal rate of return (IRR) beats the required return, then check payback.
- NPV measures value created in money, IRR gives a percentage return and payback measures speed of recovery, so each answers a different question.
- In the illustrative USD 120,000 example at 12 percent, NPV is USD 32,099.5, IRR is 21.9 percent and simple payback is 2.90 years.
- Excel’s NPV function treats the first value as the end of period 1, so the Year 0 outlay must be added separately.
- A 20 percent fall in cash inflows cuts the example’s NPV to USD 1,680, so test a downside case before approving.
NPV, IRR and Payback Answer Three Different Questions
Net present value (NPV) is the sum of a project’s future cash flows, each reduced to today’s value at the discount rate, minus the cash spent up front. The discount rate is the annual return a project must earn to justify its risk, so a positive NPV means the project earns more than that required return. Templates for this measure sit in the eFinancialModels NPV models collection.
The internal rate of return (IRR) is the discount rate at which NPV equals zero. It is a percentage, not a profit amount, and it is judged against the required return. The IRR models at eFinancialModels apply the same test.
The payback period is the time a project needs to recover its outlay from its cash flows. Discounted payback does the same after discounting each cash flow, so it is always longer. Neither version shows the value created after the outlay is recovered, which is why the payback period models are best read next to NPV.
Five Steps Run the Appraisal
- List the cash flows. Enter the outlay at Year 0 as a negative number, then the net cash flow after tax for each later year. Use cash, not accounting profit, and include one-off costs such as installation.
- Choose the discount rate. Match the rate to the project’s risk, as the next section explains.
- Compute NPV. Divide each year’s cash flow by one plus the rate, raised to the year number, add the results and subtract the Year 0 outlay. Excel’s NPV function discounts every value it receives, so the outlay is added outside the function, according to Microsoft Support.
- Compute IRR. The IRR function needs at least one positive and one negative value, as the Microsoft Support IRR page states. Accept the project when IRR is above the discount rate.
- Compute payback and decide. Add cash flows year by year until the running total reaches zero, then interpolate: whole years before recovery plus the unrecovered amount divided by that year’s cash flow. Compare the result with the payback limit the owner has set.
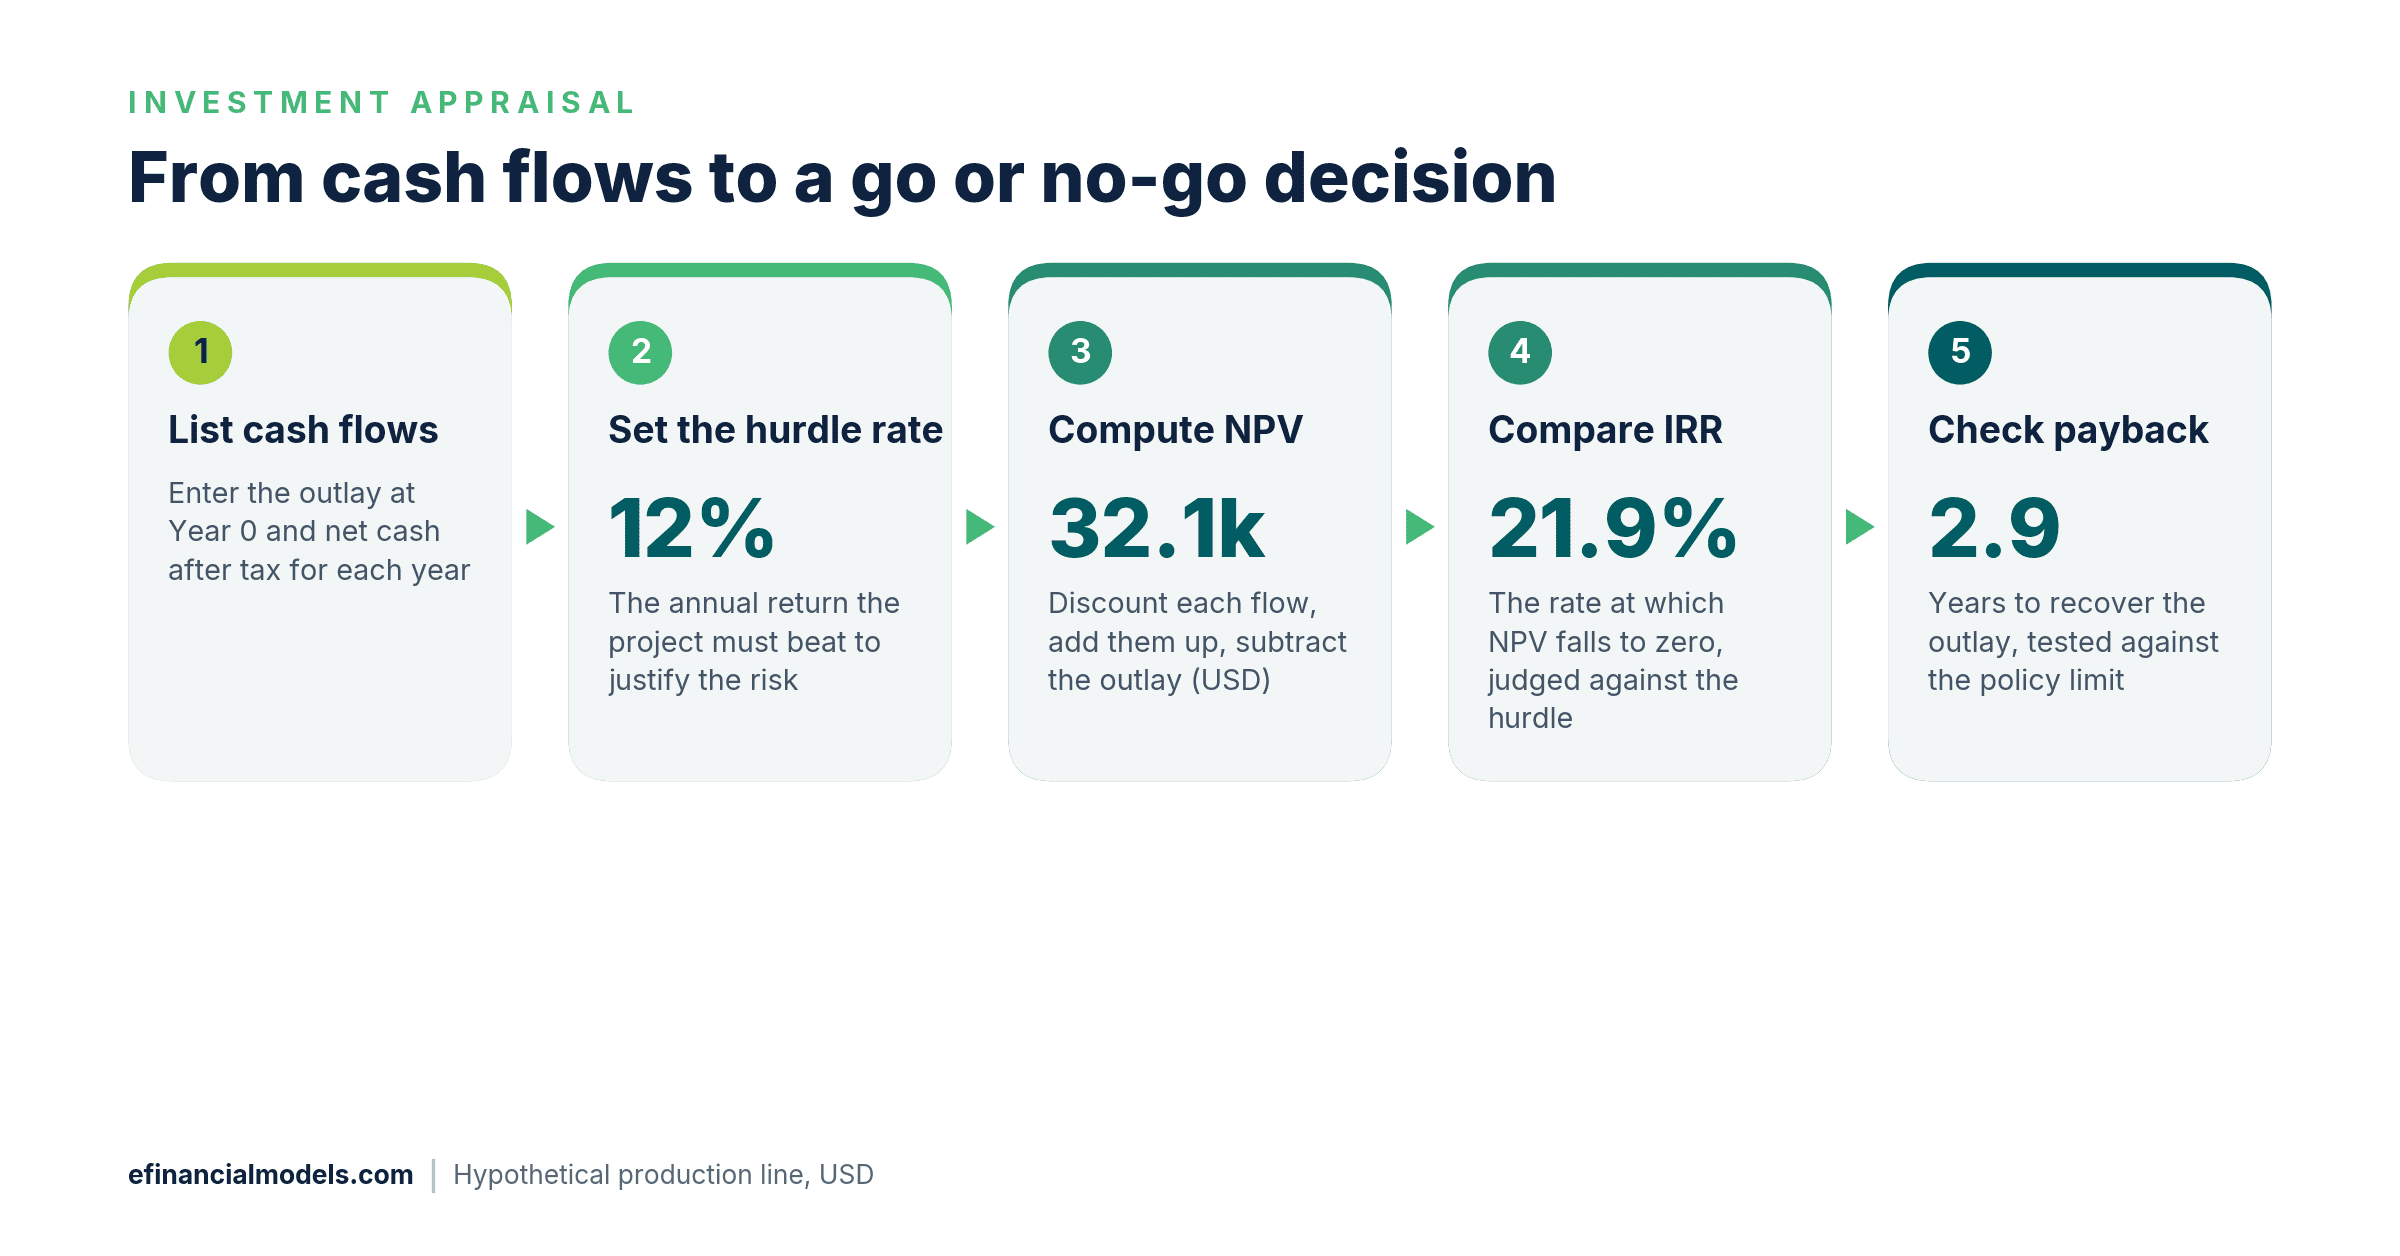
The five appraisal steps in order, drawn by eFinancialModels from the example below.
Choose a Discount Rate That Matches the Project’s Risk
A discount rate is built from the risk-free rate, the return on government debt with no default risk, plus a premium for the risk of the project, and a market benchmark already bundles both parts. The US Treasury publishes daily par yield curve rates, and a required return below the current government yield for a similar term would pay less than a bond with no default risk.
Damodaran’s January 2026 data put the cost of capital, the blended return that owners and lenders require, at 6.96% for the Total Market, against 4.36% for its Utility (General) group and 9.34% for its Software (System & Application) group (Damodaran, January 2026). Listed companies are larger and safer than a growth-stage business, so the example adds an assumed margin of about five percentage points for size and project risk and rounds to a 12 percent hurdle rate, the minimum return a project must clear. That margin is an assumption, not a market figure.
Riskier projects deserve higher rates. Replacing a machine in a proven process carries less risk than launching a new product, and each can carry its own rate.
Worked Example: A USD 120,000 Production Line
Assume a fictional manufacturer buys a production line for USD 120,000 at Year 0. Assume net cash flows after tax of USD 35,000, 42,000, 48,000, 48,000 and 40,000 in Years 1 to 5, a 12 percent discount rate and a payback limit of 3.5 years, set by the owner as a cash-recovery rule. Every figure is an illustrative assumption.
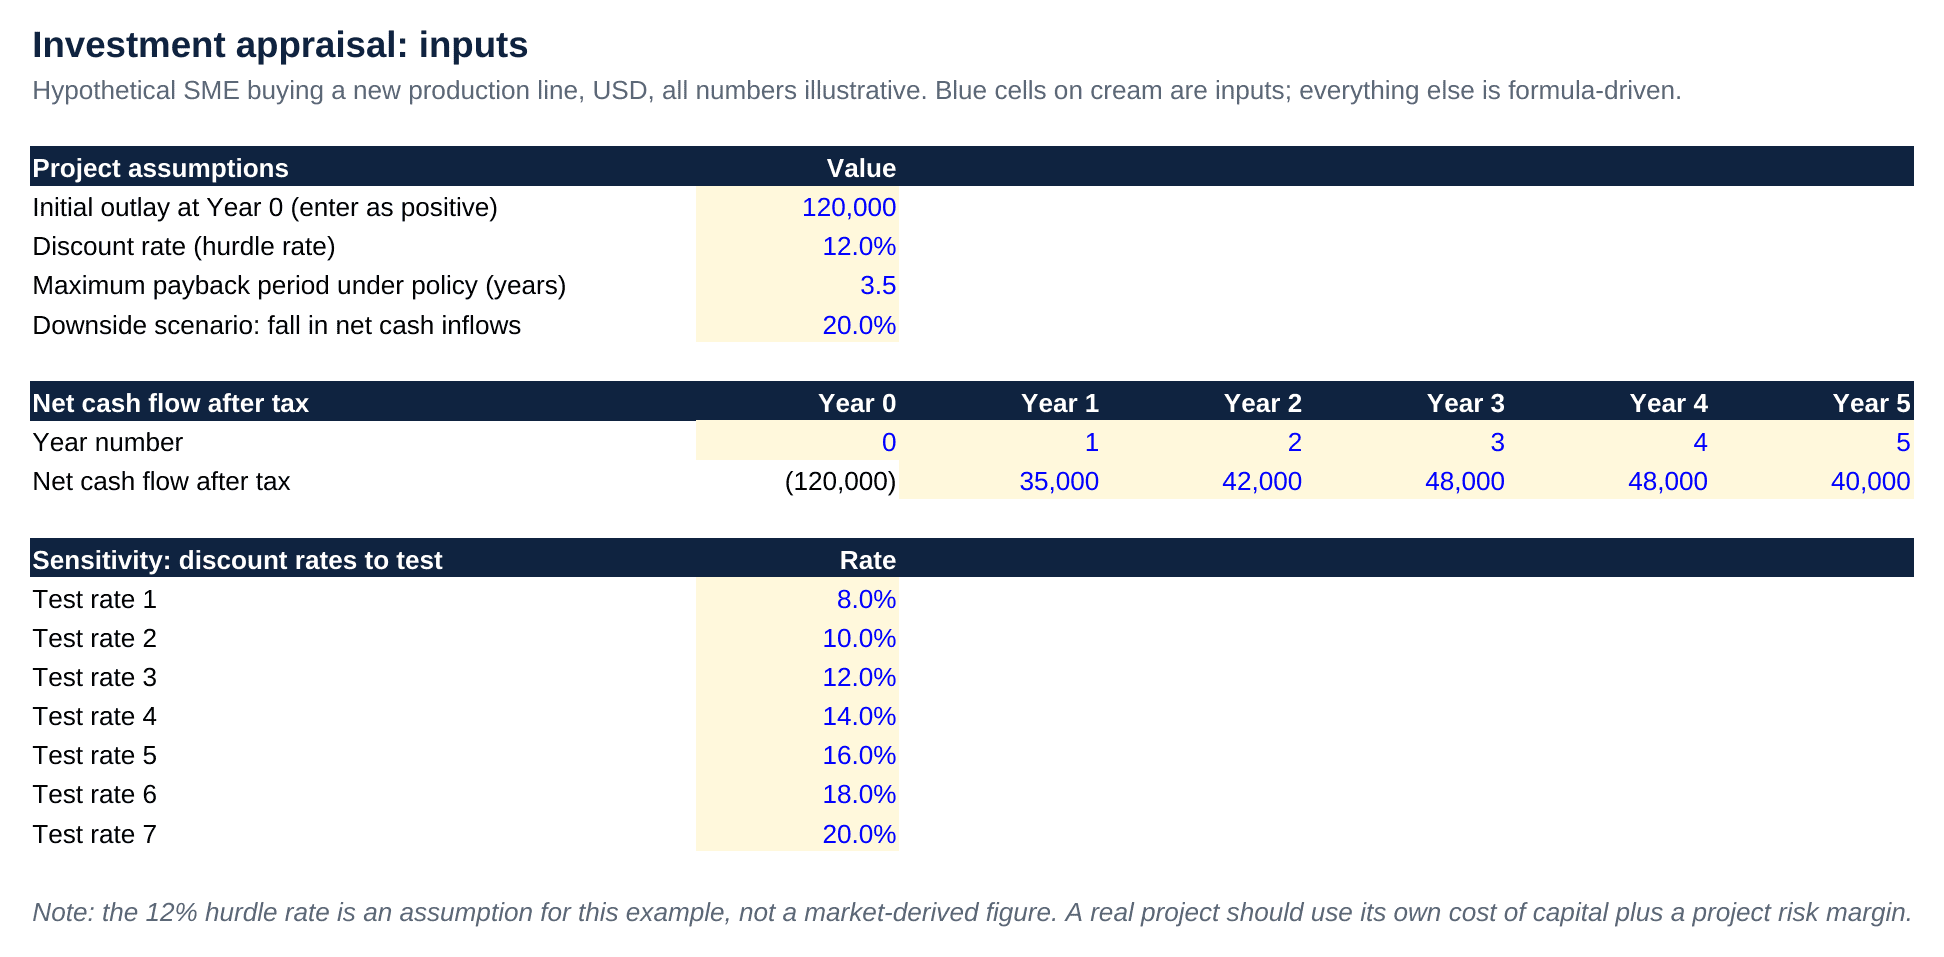
Inputs sheet of the worked example: each blue cell on cream is an assumption the owner can change. Source: eFinancialModels Analysis
The calculation sheet discounts each cash flow and keeps two running totals, in USD:
| Year | Net cash flow | Discounted at 12% | Cumulative cash | Cumulative discounted |
|---|---|---|---|---|
| 0 | -120,000.0 | -120,000.0 | -120,000.0 | -120,000.0 |
| 1 | 35,000.0 | 31,250.0 | -85,000.0 | -88,750.0 |
| 2 | 42,000.0 | 33,482.1 | -43,000.0 | -55,267.9 |
| 3 | 48,000.0 | 34,165.4 | 5,000.0 | -21,102.5 |
| 4 | 48,000.0 | 30,504.9 | 53,000.0 | 9,402.4 |
| 5 | 40,000.0 | 22,697.1 | 93,000.0 | 32,099.5 |
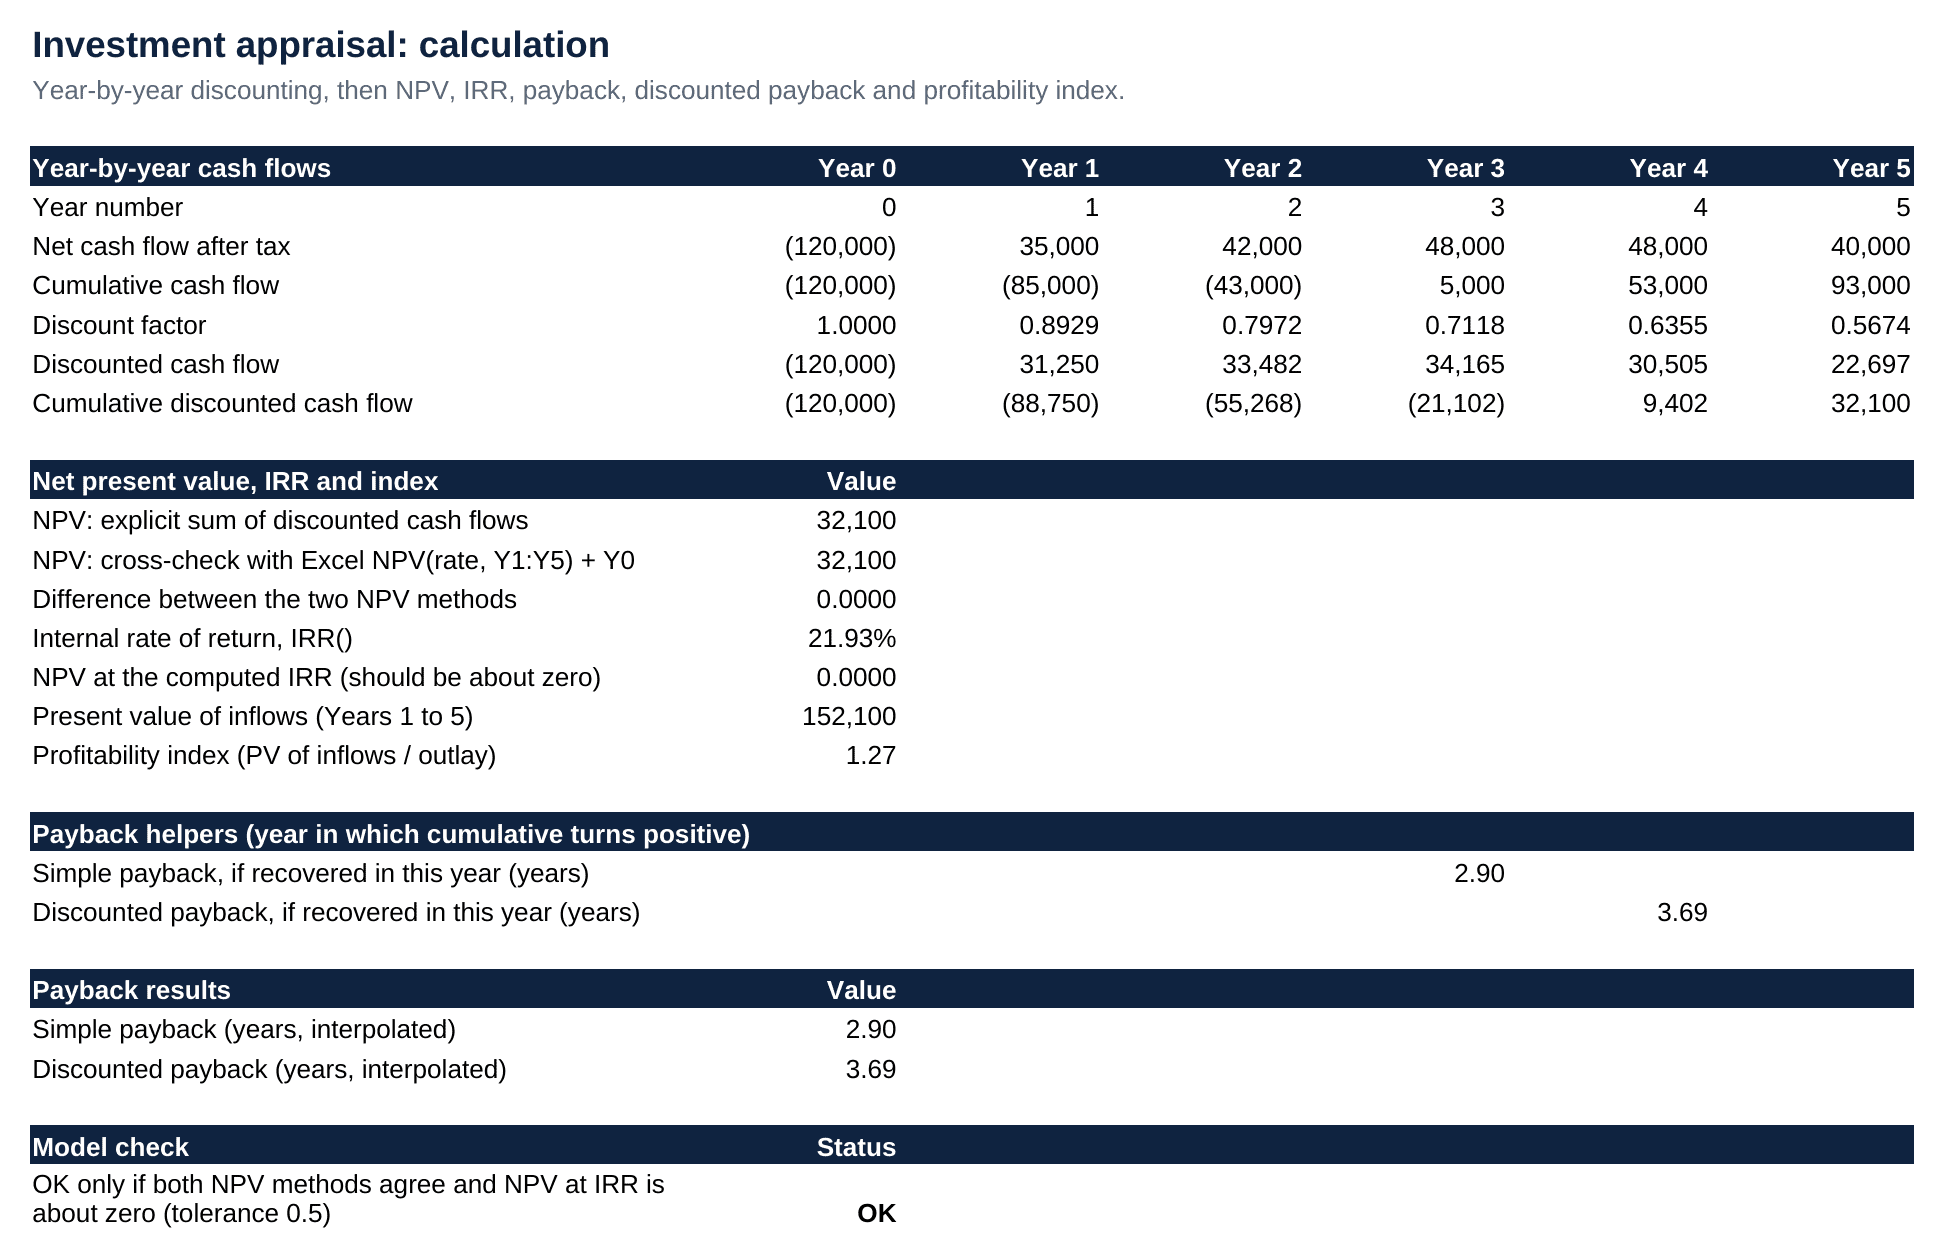
Calculation sheet: live formulas turn five cash flows into NPV, IRR and both payback measures. Source: eFinancialModels Analysis
The five discounted inflows of Years 1 to 5 add up to USD 152,099.5, and subtracting the USD 120,000 outlay leaves an NPV of USD 32,099.5. Excel’s IRR function returns 21.9%, which is the rate that would bring NPV to zero and sits well above the 12 percent hurdle.
Simple payback falls in Year 3. The running total is minus 43,000 after Year 2, and Year 3 adds 48,000, so simple payback is 2 + 43,000 / 48,000. The fraction is 0.90 to two decimals, so payback is 2.90 years, inside the 3.5-year limit. Discounted payback falls in Year 4: the unrecovered 21,102.5 after Year 3 divided by Year 4’s 30,504.9 gives 3 years plus 0.69 of Year 4, which is 3.69 years. That misses the same limit, so the example passes on simple payback and fails on discounted payback, and the policy must say which payback counts. The profitability index, the present value of inflows divided by the outlay, is 152,099.5 / 120,000 = 1.27.
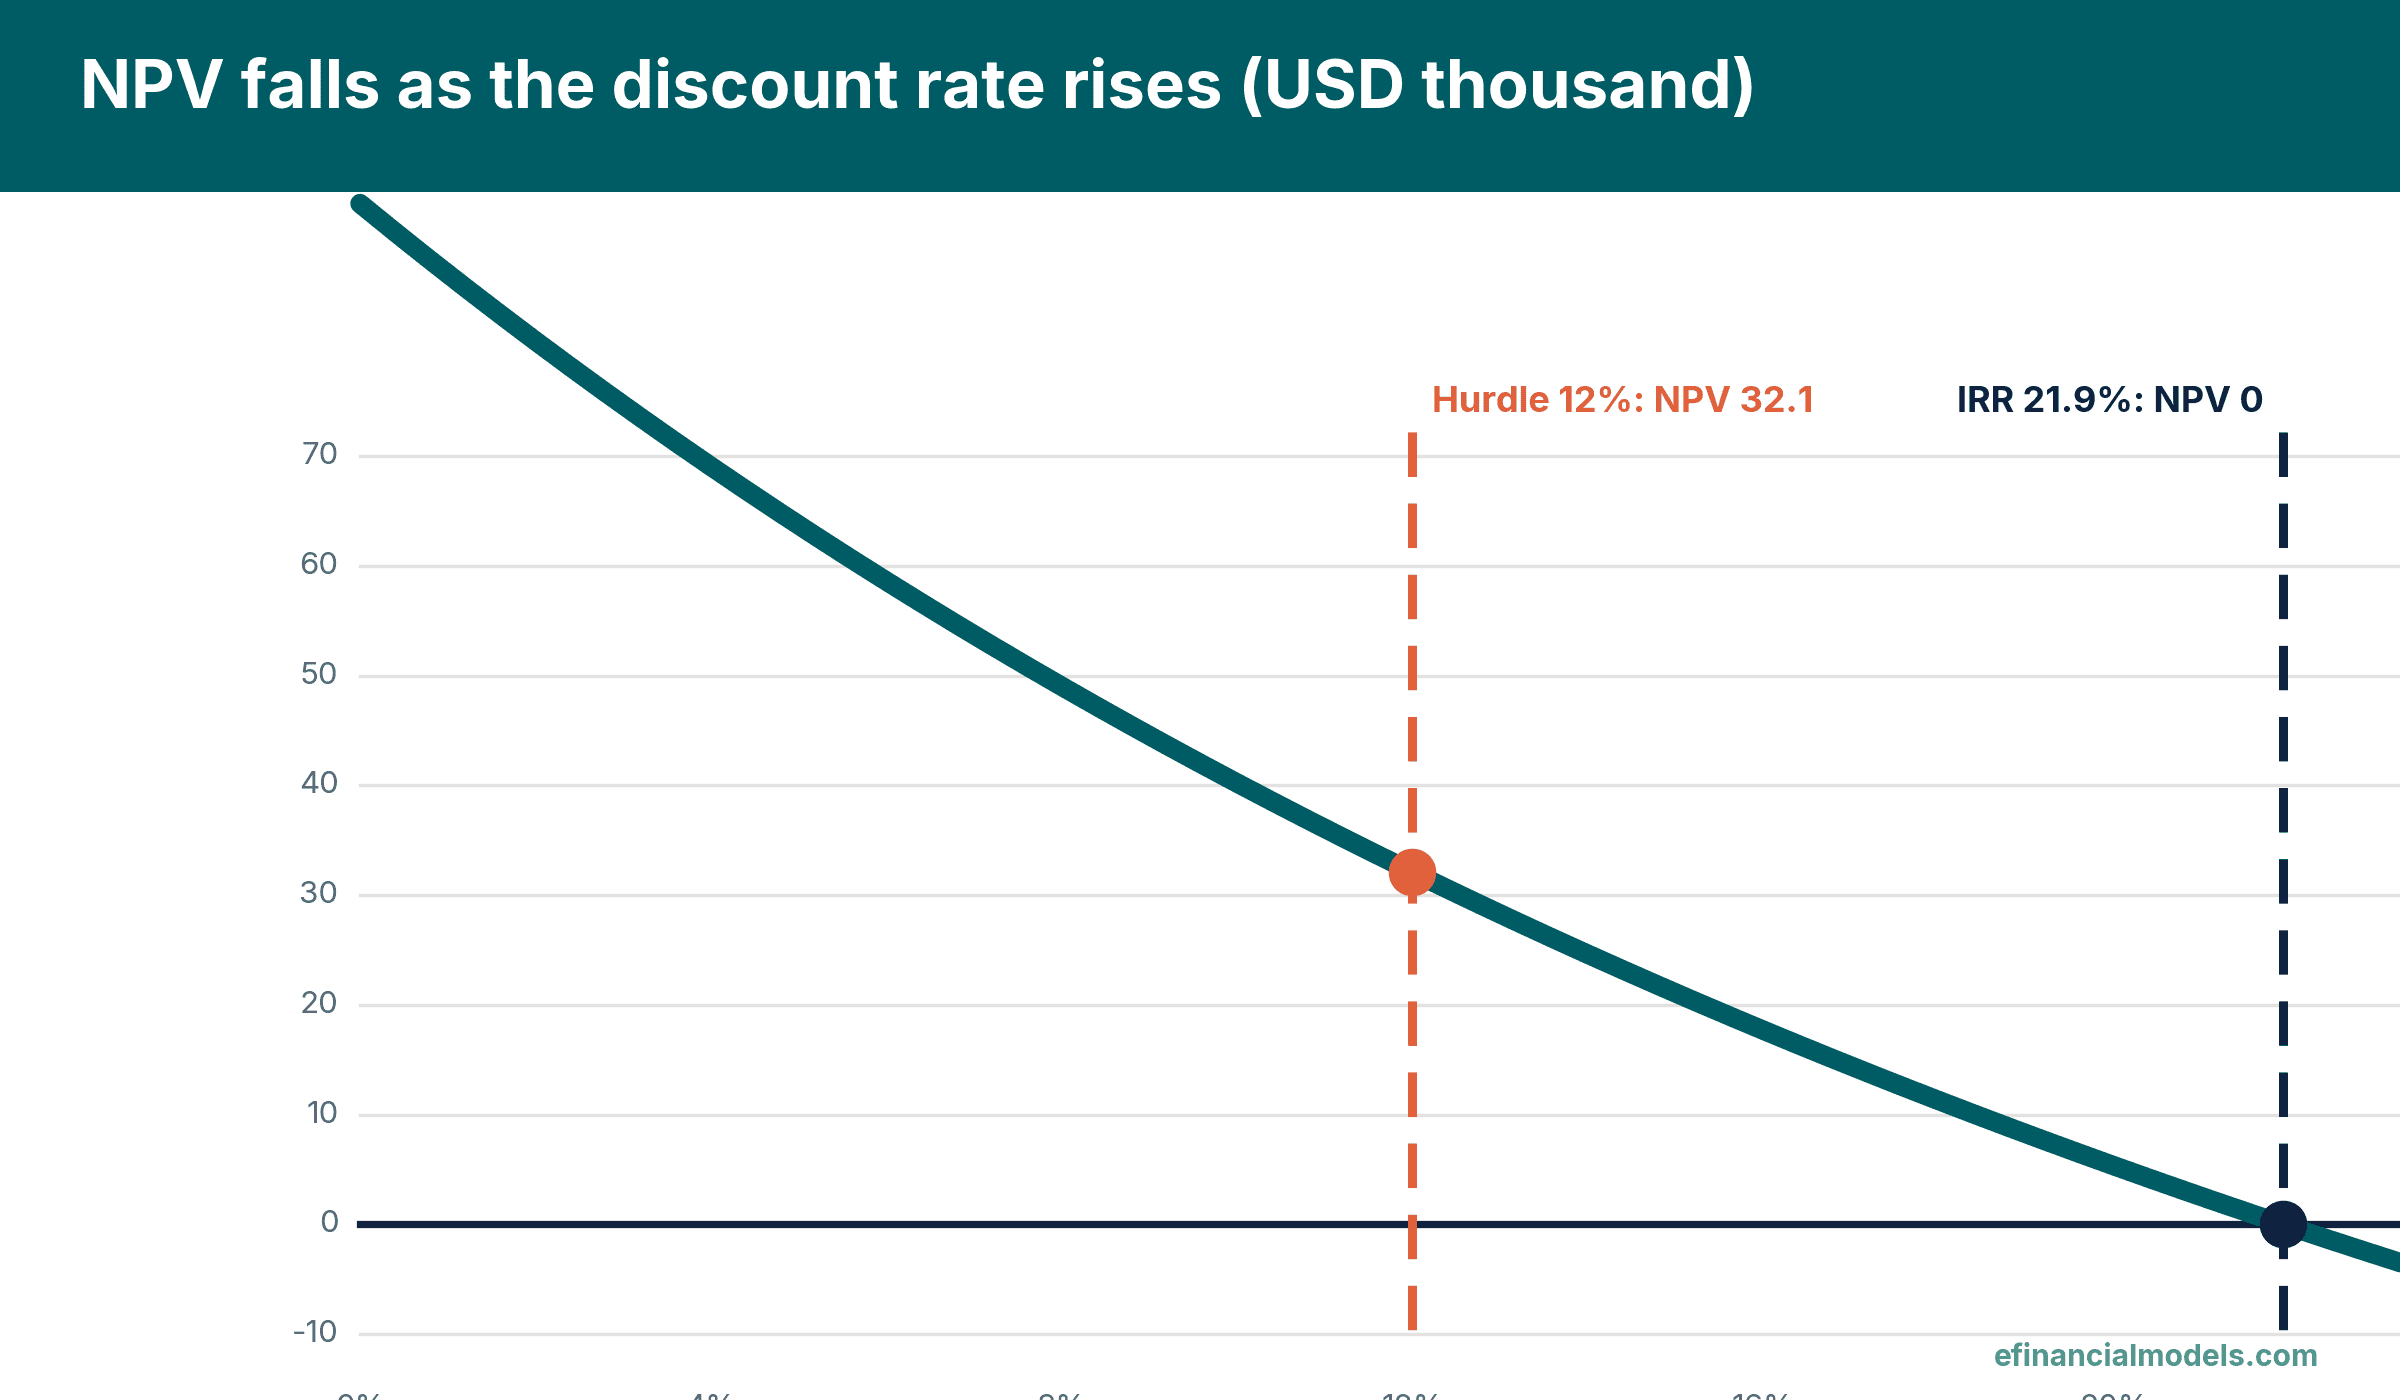
NPV of the example at each discount rate, computed from its five stated cash flows.
The chart shows why IRR and NPV agree here: NPV falls from USD 49,024 at 8 percent to USD 5,334 at 20 percent and crosses zero at the IRR. A lower-cash-flow test is harsher. If every inflow falls 20 percent while the outlay stays the same, NPV drops to USD 1,680 and IRR to 12.5 percent, barely above the hurdle.
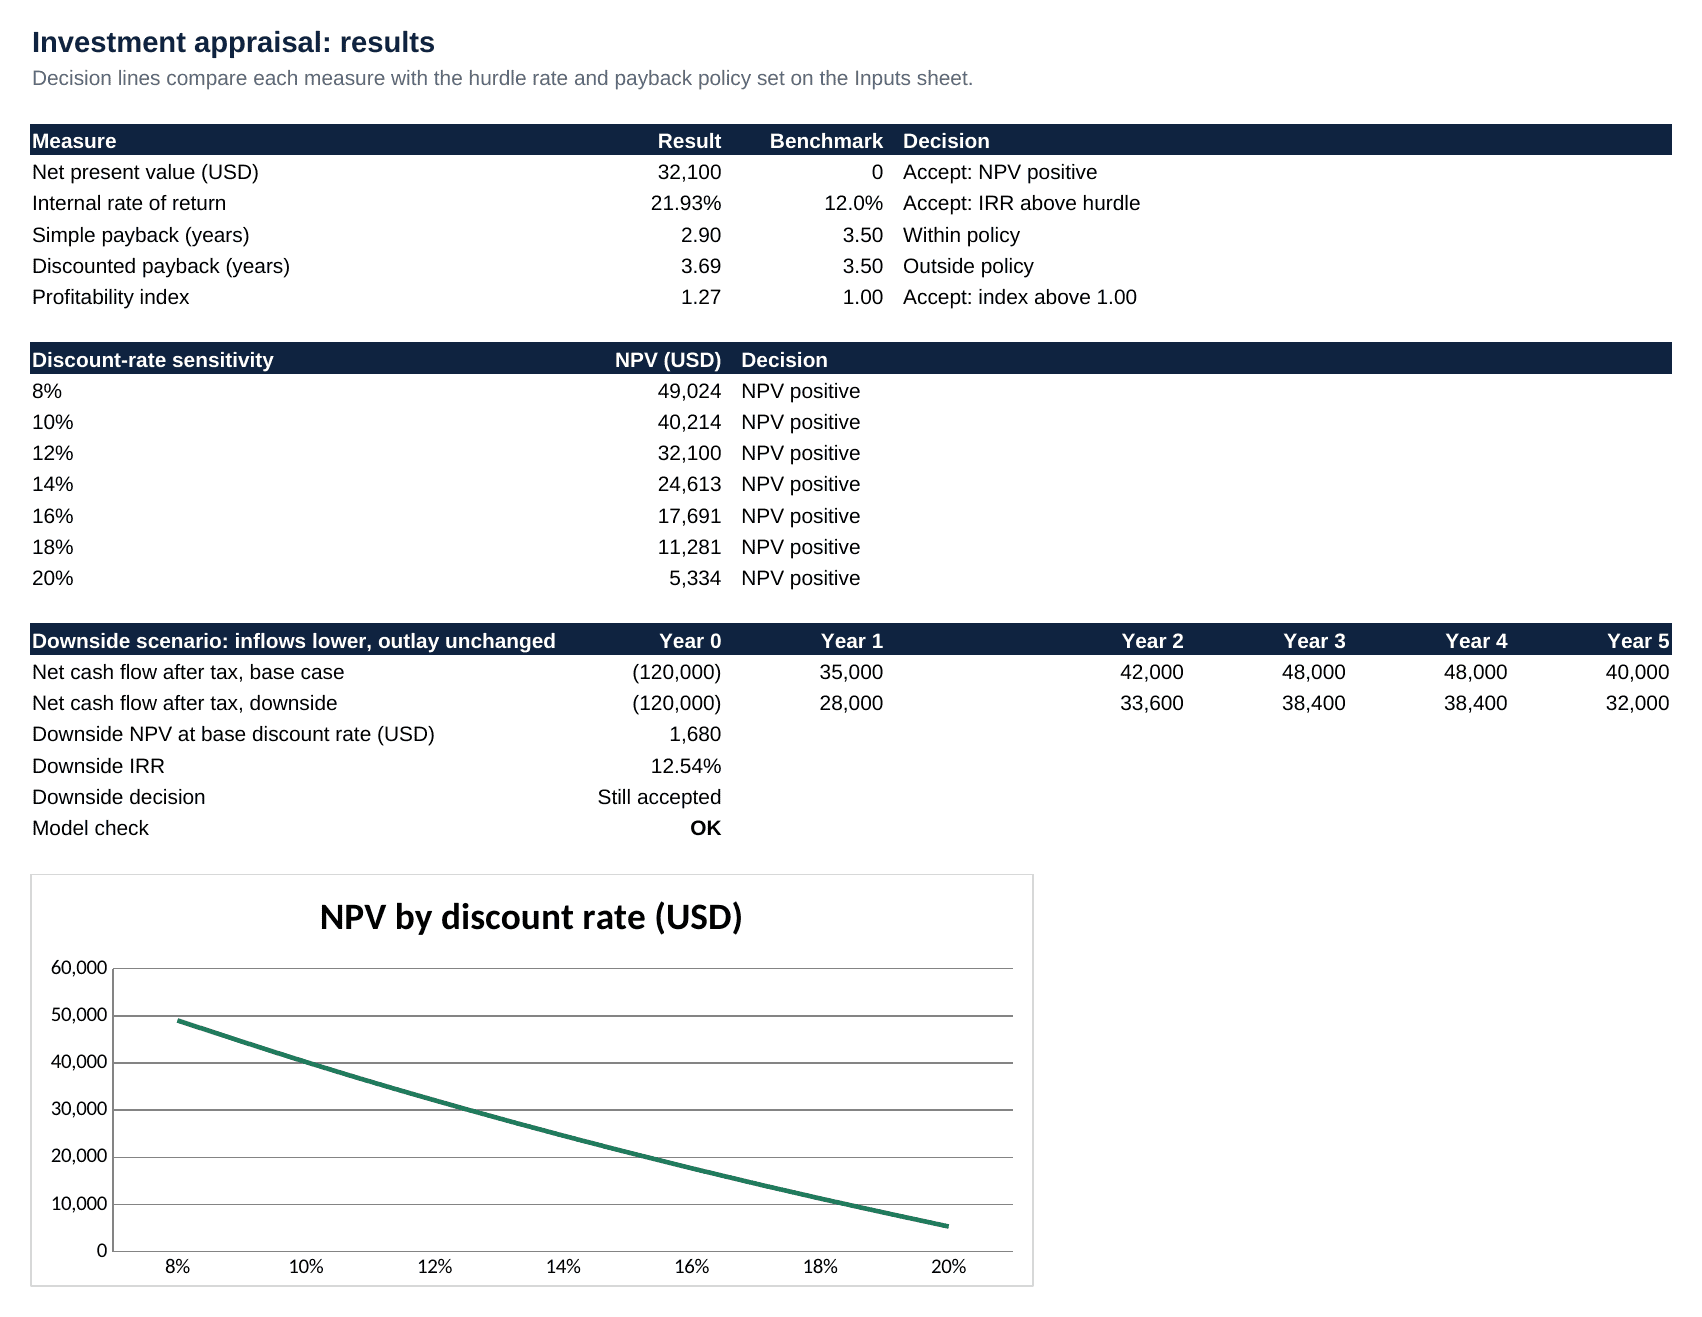
Results sheet: decisions, the discount-rate sensitivity table and the model check cell. Source: eFinancialModels Analysis
Read the Three Results Together
Use NPV as the main decision rule and the other two as checks. In the example, NPV is positive, IRR beats the hurdle and simple payback meets the limit, so the line is approved; the discounted payback miss and the thin downside margin are the points to watch, for instance by negotiating the price or staging the spend. IRR confirms the margin over the required return, and payback tests liquidity. When two projects exclude each other, NPV is the safer guide, because IRR can favour a small project with a high percentage while NPV counts the money created.
Capital is often scarce for a growing business. When funds are limited, the profitability index ranks projects by value created per dollar invested, so a project with a lower NPV but a far smaller outlay can rank first.
Some firms still lean on simpler tests. A survey of 106 Estonian companies reported that firms often rely on intuition or simpler evaluation techniques, including the payback period (Estonian Discussions on Economic Policy, 2025 volume). Payback alone would pass this example at 2.90 years without showing the USD 32,099.5 of value or the thin downside margin.
Frequently Asked Questions
What discount rate should a small business use?
Start with what the business pays for money: the interest on its loans and the return its owners expect. Blend those into one rate, then add a margin for the specific project, higher for new markets and lower for replacing equipment that already works. Record the margin as an assumption and test rates a few points either side, because the decision should not hinge on a single guess.
Why can NPV and IRR give different answers?
They disagree when projects differ in size or in the timing of their cash. IRR assumes each cash inflow can be reinvested at the IRR itself, which flatters projects with early cash, while NPV assumes reinvestment at the discount rate. Cash flows that change sign more than once can also produce several IRR values. In every such conflict, follow NPV.
Should taxes, inflation and working capital be in the cash flows?
Yes. Use cash flows after tax, and keep inflation treatment consistent: nominal cash flows take a nominal rate, real cash flows take a real rate. Working capital, the cash tied up in stock and unpaid customer invoices, is an outflow when it grows and returns when it is released, usually at the end of the project. Omitting it overstates early cash and makes payback look shorter than it is.
Is a positive NPV enough to approve a project?
No. A positive NPV only shows the forecast beats the required return. Check that funding is available, that the downside case still clears the hurdle, and that the forecast cash flows rest on evidence such as quotes and signed contracts. After approval, compare actual cash flows with the forecast each year, so the next appraisal starts from observed errors rather than from optimism.
Conclusion
An investment appraisal works when NPV, IRR and payback are calculated from the same cash flows and read together, with a downside test before approval. Owners who want to test a project of their own can start with the eFinancialModels Payback Period Calculator, an Excel template for working out how long it takes to recover an investment.