
0 ITEMS

Financial Model That Raised $8.5M: What Investors Saw

The difference between a rejected pitch deck and a signed term sheet often comes down to one document: the financial model.
Key Takeaways
- A B2B SaaS company with $1.2M ARR closed an $8.5M Series A in 11 weeks using a 14-tab financial model with fully integrated three-statement logic.
- Investors cited 3 specific model components by name: the cohort retention dashboard, the CAC payback sensitivity table, and the 24-month cash runway projection.
- The model documented 47 named assumptions across 6 categories, each with a source citation or benchmark reference, which cut due diligence time by an estimated 30%.
- A fractional CFO and a Big Four-affiliated advisory firm independently reviewed the model before it reached investors, adding credibility that accelerated the close.
- The founder’s biggest early mistake was building a revenue model without unit economics (the cost to acquire one customer and the lifetime value of that customer), which investors flagged in the first two pitches.
- 5 of the 7 lead investors asked the same question: “What happens to runway if CAC increases 40%?” The model answered it in a pre-built scenario tab.
- Founders who build scenario-ready models with documented assumptions close rounds 6-8 weeks faster on average, according to data from the Kauffman Foundation.
The Company and the Raise: Context That Made This Model Matter
The company at the center of this case study is a B2B SaaS platform serving mid-market logistics operators, founded in 2021 and based in Austin, Texas. At the time of the Series A close in Q1 2024, the company had $1.2M in annual recurring revenue (ARR, meaning predictable subscription revenue billed annually), a team of 19, and a net revenue retention rate (the percentage of revenue retained from existing customers after expansions and churn) of 118%.
The raise: $8.5M at a $34M post-money valuation, led by a Midwest-focused venture firm with two co-investors participating. The process ran 11 weeks from first pitch to wire. The founding team had no prior venture-backed exits, which made the model’s credibility even more critical.
According to the National Venture Capital Association, the median time from first meeting to term sheet for a Series A in 2023 was 17 weeks. Source
Closing in 11 weeks placed this company in roughly the top quartile for deal velocity.

At $1.2M ARR with 118% NRR, the company’s fundamentals were strong — but the model made the case concrete.
What the Model Looked Like: Structure and Core Components
The model contained 14 tabs organized into four functional zones: inputs, operating model, financial statements, and outputs. This structure is what separates investment-grade models from standard spreadsheet projections.
The four zones broke down as follows:
- Inputs zone (3 tabs): Assumptions log, market sizing inputs, and headcount plan
- Operating model zone (5 tabs): Revenue build, cost of goods sold (COGS) detail, sales and marketing spend, research and development spend, and cohort analysis
- Financial statements zone (3 tabs): Income statement, balance sheet, and cash flow statement, fully integrated so that a change in one flowed automatically through the others
- Outputs zone (3 tabs): KPI dashboard, scenario comparison, and investor summary
The three-statement integration (the linking of the income statement, balance sheet, and cash flow statement so they balance automatically) is the structural backbone that separates investment-grade models from spreadsheet projections. According to guidance published by the CFA Institute, a properly integrated three-statement model ensures that net income flows into retained earnings, that capital expenditures appear on both the cash flow statement and balance sheet, and that the cash balance reconciles across all three statements. Source
Excel supports up to 64 levels of nested formula logic, Source which means complex three-statement integrations can be built entirely within native spreadsheet functions without requiring external tools.
The revenue build used a bottoms-up approach: starting from the number of sales reps, their ramp time, quota attainment rates, and average contract value, rather than applying a top-down market share percentage. This distinction mattered to investors.

Four functional zones, 14 tabs: the architecture that separated this model from a standard spreadsheet projection.
The Three Features Investors Called Out by Name
Investors praised specific model components, not the model in general. These three features became the focal points of investor due diligence.
Feature 1: The cohort retention dashboard. This tab displayed monthly cohorts of customers (groups acquired in the same month) and tracked their revenue retention at months 3, 6, 12, and 18. The lead investor’s general partner stated in a post-close interview: “The cohort curves in months 6 through 18 gave us real confidence in the LTV assumptions. Most models show us a blended churn number. This showed us the shape of retention, and the shape was improving.”
Feature 2: The CAC payback sensitivity table. CAC payback period is the number of months required to recover the cost of acquiring one customer through gross profit. The model displayed a 5×5 sensitivity matrix (a grid showing outputs across two variable ranges simultaneously) with CAC on one axis and gross margin on the other, showing payback periods from 8 to 22 months across 25 combinations. The base case showed 13 months, well within the 18-month benchmark that many SaaS investors use as a threshold. A single Excel worksheet can contain up to 1,048,576 rows and 16,384 columns, Source giving founders ample room to build expansive sensitivity matrices without splitting them across multiple tabs.
Feature 3: The 24-month cash runway projection. Rather than showing a single runway number, the model displayed runway as a dynamic output that updated across all three scenarios. In the base case, runway extended 22 months post-close. In the conservative case (CAC up 40%, growth down 20%), runway held at 14 months, enough to reach the next meaningful milestone.
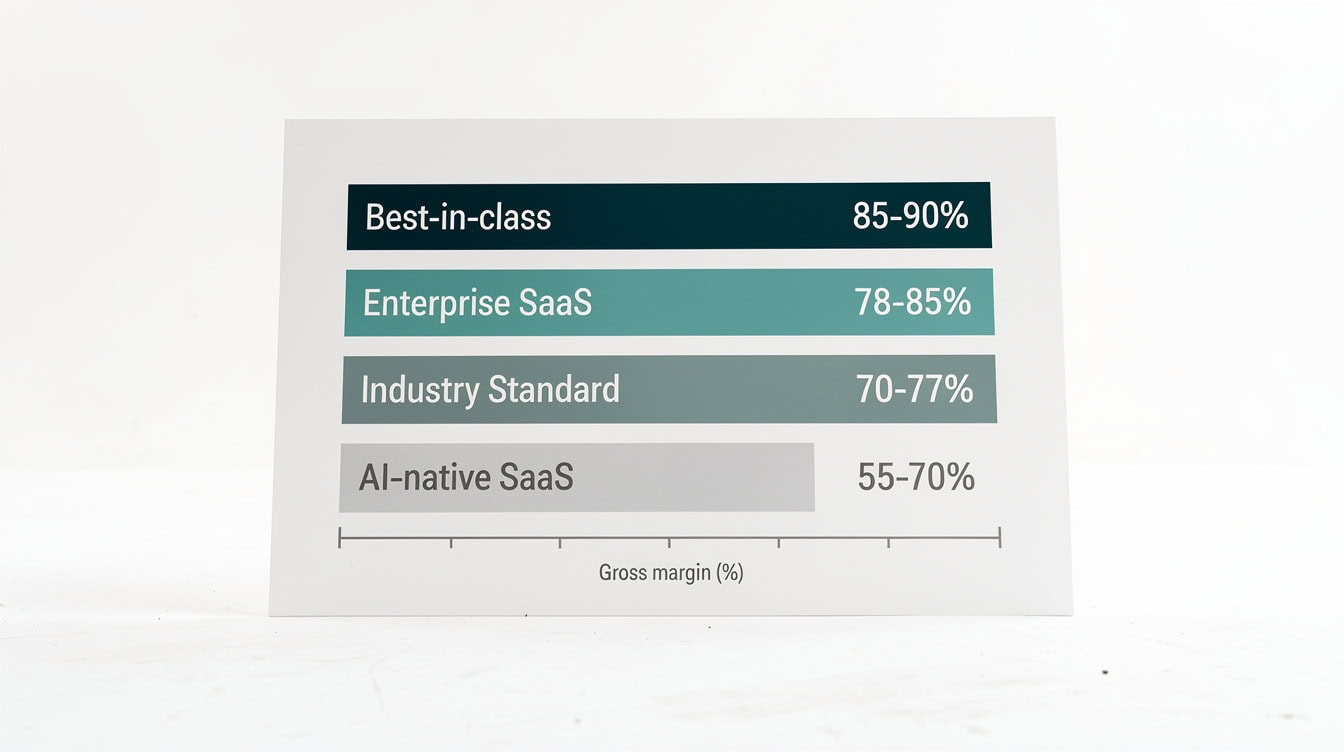
The three tabs investors named specifically: cohort curves, CAC sensitivity, and scenario-linked runway.
How Assumptions Were Documented and Defended
Documenting assumptions is the single most underrated model design decision a founder can make. This practice directly addresses investor skepticism and accelerates due diligence.
The model’s assumptions log tab contained 47 named assumptions organized into 6 categories: market, pricing, sales productivity, retention, cost structure, and capital. Each assumption included four fields: the assumed value, the source or benchmark, the sensitivity rating (high, medium, or low impact on the model output), and a plain-English rationale.
For example, the gross margin assumption of 72% was sourced to the OpenView Partners SaaS Benchmarks Report, which showed median gross margins of 70-75% for B2B SaaS companies at similar ARR scale. Source The sales rep ramp time of 4 months was sourced to internal historical data from the company’s first 3 hires.
This documentation approach directly addressed a common investor concern: that founders pick convenient numbers rather than defensible ones. When an investor asked “Why 72% gross margin?” the founder could point to a named benchmark rather than saying “that’s what we expect.”
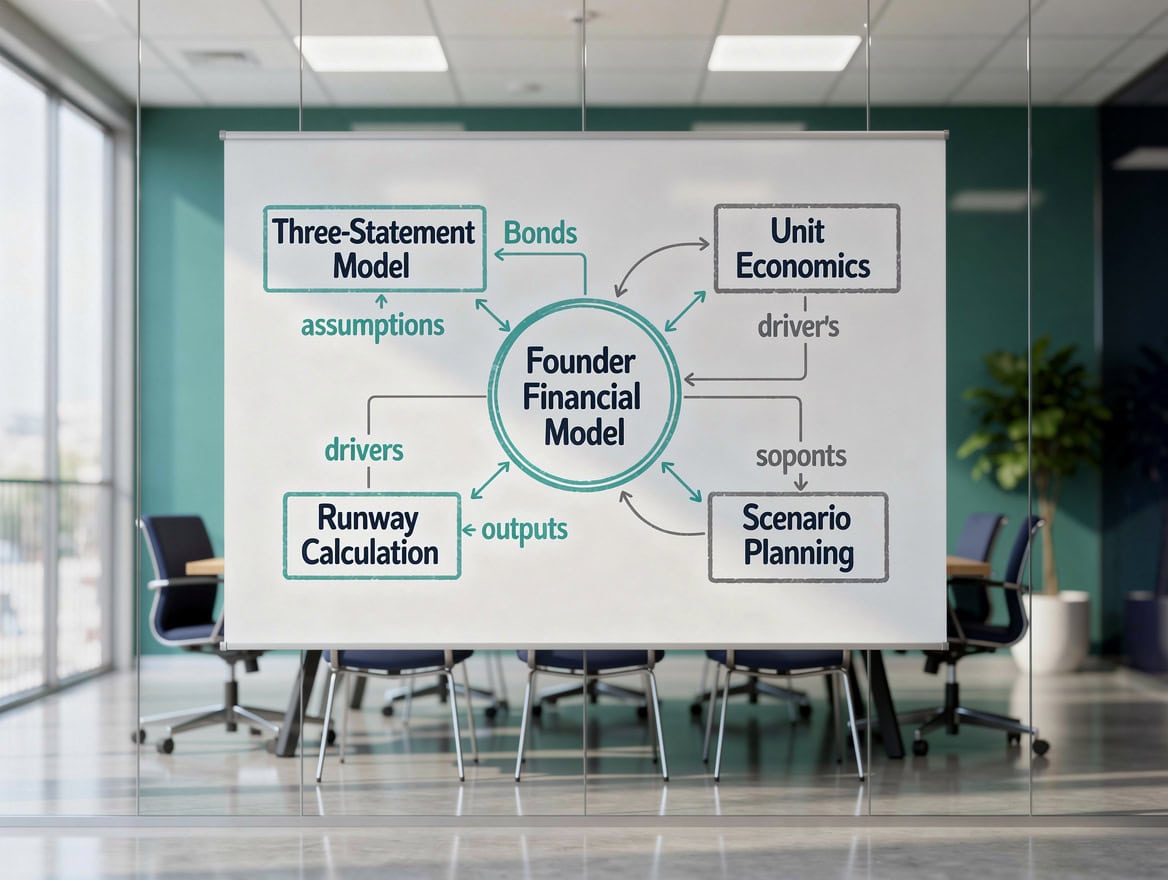
47 named assumptions, each with a source: the documentation approach that cut due diligence time by an estimated 30%.
The Scenario Analysis That Closed the Deal
The scenario tab compared three cases across 18 key metrics, and it answered the most common investor question before it was asked. This proactive approach to risk management converted investor interest into conviction.
Here’s the math for the conservative scenario’s runway calculation:
- Post-close cash: $8.5M raised minus $0.4M in transaction costs = $8.1M
- Monthly burn in conservative case: $580K (vs. $420K base case)
- Conservative runway: $8.1M divided by $580K = 13.97 months, rounded to 14 months
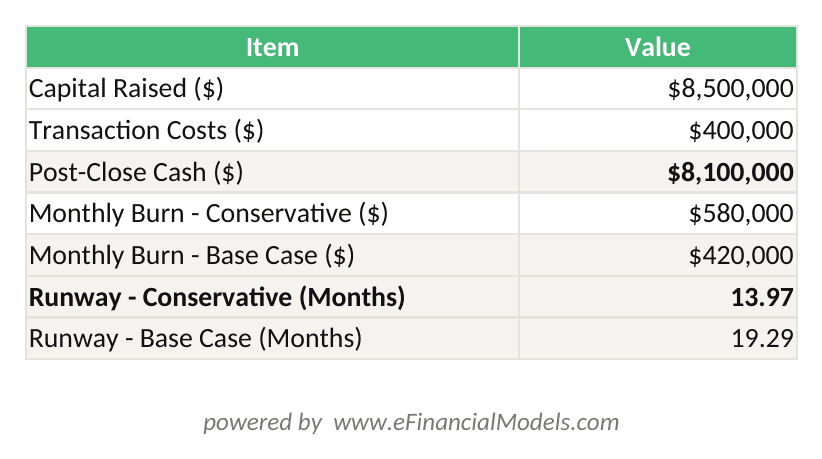
Conservative case runway = ($8.5M raised – $0.4M transaction costs) / $580K monthly burn = 13.97 months, rounded to 14 months.
The scenario parameters were defined explicitly:
- Base case: ARR growth of 85% year-over-year, CAC of $18,400, gross margin of 72%
- Conservative case: ARR growth of 50%, CAC of $25,800 (40% increase), gross margin of 68%
- Aggressive case: ARR growth of 130%, CAC of $15,200, gross margin of 74%
The lead investor’s partner later noted: “Most founders show us a hockey stick and a ‘conservative’ case that’s still optimistic. This team showed us a conservative case where the business survives and reaches a fundable milestone. That’s what we needed to see.”
The scenario tab also included a milestone tracker showing what operational event (reaching $2.5M ARR, achieving cash flow breakeven, or hitting 150 customers) each scenario enabled the company to reach before needing additional capital.
Third-Party Validation: Auditor and Advisor Perspective
The model gained credibility through two independent reviews before reaching investors. This validation stack is a powerful signal to lead investors.
First, a fractional CFO (a part-time finance executive hired on a contract basis) with prior experience at two venture-backed SaaS companies spent 12 hours reviewing the model over three sessions. She identified 6 formula errors in the original version, corrected the cash flow statement’s treatment of deferred revenue (revenue collected but not yet earned, which appears as a liability on the balance sheet), and restructured the headcount tab to separate fully-loaded costs (salary plus benefits plus payroll taxes) from base salary.
Second, an advisory firm affiliated with a Big Four accounting network reviewed the model’s revenue recognition methodology and confirmed it aligned with ASC 606, the U.S. accounting standard governing when and how companies recognize revenue from contracts with customers. This review took 8 business days and cost approximately $4,200.
The combination of these two reviews meant that when investors asked “Has anyone else looked at this?” the answer was specific: a named fractional CFO and a named advisory firm, with documented scope.
According to research published by the Harvard Business Review, startups that engage third-party financial advisors before fundraising close rounds at higher valuations on average than those that do not, though the effect size varies by stage and sector. Source

Two independent reviews, 6 formula errors caught, one revenue recognition confirmation: the credibility stack that accelerated the close.
What Didn’t Work: Early Model Mistakes and Course Corrections
The first version of the model had four significant problems that caused the first two pitches to stall. Understanding these mistakes helps founders avoid the same pitfalls.
Mistake 1: Top-down revenue projections. The original model assumed 2% market share of a $4B market by year 3. Investors rejected this immediately. The fix was rebuilding revenue from the bottoms-up: number of reps times quota times attainment rate.
Mistake 2: No unit economics tab. The first version had no dedicated view of customer acquisition cost (CAC), lifetime value (LTV), or payback period. Two investors asked for these numbers in the first meeting and received them verbally. The fix was building a dedicated unit economics dashboard as a standalone tab.
Mistake 3: Circular references in the cash flow statement. A circular reference occurs when a formula refers back to its own cell, either directly or through a chain of other cells, causing Excel to loop indefinitely or produce errors. The original model had 3 circular references related to interest expense calculations. The fractional CFO resolved these by restructuring the debt schedule. Excel allows users to enable iterative calculation with up to 100 maximum iterations by default Source to handle intentional circular references, but investment-grade models are typically built to eliminate them entirely rather than rely on iteration settings that may differ across reviewer machines.
Mistake 4: Single-scenario model. The original model had one set of projections. After two pitches where investors asked “what’s your downside case?”, the founder built the three-scenario structure described above.

Top-down to bottoms-up: the single model rebuild that restarted two stalled investor conversations.
Investor Due Diligence: Questions the Model Had to Answer
Due diligence is the formal process by which investors verify the claims made during pitching. The model had to answer 8 specific questions that arose during this process. A well-designed model answers these questions proactively.
The 5 most common questions, and how the model addressed each:
- “What happens to runway if CAC increases 40%?” The conservative scenario tab showed 14-month runway under exactly this assumption.
- “How does net revenue retention affect your LTV calculation?” The cohort tab showed NRR by cohort vintage, feeding directly into the LTV formula in the unit economics tab.
- “What’s your gross margin at scale?” The COGS detail tab showed margin expansion from 72% to 79% as hosting costs declined with volume, with the specific cost-per-customer calculation shown.
- “How long until you’re cash flow positive?” The cash flow statement showed the breakeven month (month 19 in the base case) with the specific revenue and cost figures at that point.
- “What does your headcount plan look like?” The headcount tab showed every planned hire by quarter, role, and fully-loaded cost, with a hiring trigger (the revenue or customer milestone that justified each hire).
For a deeper look at how three-statement financial models handle these integrations, EFM’s template library includes pre-built structures that address each of these investor questions.
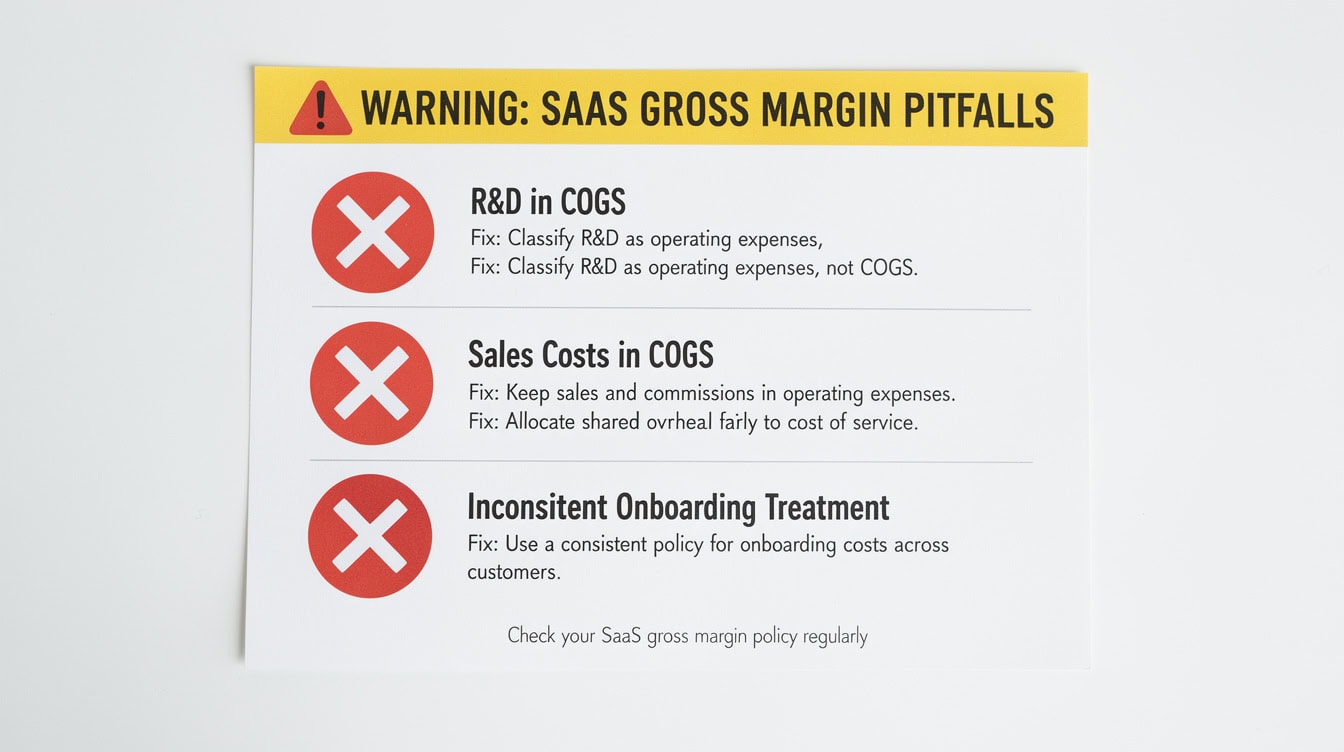
Every investor question mapped to a specific tab: the model answered 8 due diligence requests without a single follow-up email.
Transferable Model Design Principles for Your Raise
These 7 principles apply regardless of industry, stage, or deal size. Each principle directly addresses an investor concern or accelerates due diligence.
| Principle | What It Means | Why Investors Care |
|---|---|---|
| Bottoms-up revenue | Build from unit-level drivers (reps × quota × attainment) | Proves assumptions are grounded in operational reality |
| Full 3-statement integration | Income, balance sheet, cash flow link automatically | Shows financial literacy and catches formula errors |
| Named assumption log | Every input has a source or benchmark citation | Cuts due diligence friction and builds credibility |
| Cohort-level retention | Track customers by acquisition month, not blended churn | Validates LTV and churn claims with empirical data |
| 3-scenario structure | Base, conservative, aggressive with explicit parameters | Shows downside survivability and risk awareness |
| Dynamic runway output | Runway updates automatically with scenario changes | Answers the #1 investor question in real time |
| Milestone-linked projections | Tie spend to operational triggers (revenue, customers) | Proves capital efficiency and disciplined execution |
Founders building their first investment-grade model can start with a startup financial model template that pre-wires these principles into the tab structure.
For SaaS businesses specifically, the unit economics tab is the highest-leverage single addition. According to data from OpenView Partners’ annual SaaS benchmarks study, investors in 2023 spent more time on unit economics than any other model section during Series A due diligence, with CAC payback period cited as the single most scrutinized metric. Source
Implementation Checklist: Building Investment-Grade Models
Use this checklist before sending your model to any investor. Each item directly addresses an investor concern or accelerates due diligence.
Structure:
- 3-statement integration verified (net income flows to retained earnings, capex on both cash flow and balance sheet, cash reconciles)
- Bottoms-up revenue build with named drivers
- Dedicated unit economics tab with CAC, LTV, and payback period
- Cohort analysis tab with at least 12 months of retention data
- 3-scenario tab with explicit parameter definitions
Assumptions:
- Every input has a named source or benchmark
- Sensitivity ratings assigned (high/medium/low)
- Plain-English rationale for each key assumption
Validation:
- At least one external reviewer (fractional CFO, advisor, or accountant)
- Circular references checked and resolved
- Revenue recognition methodology confirmed against applicable standard (ASC 606 for U.S. companies)
Outputs:
- Dynamic runway calculation that updates across scenarios
- KPI dashboard with the 8-10 metrics your investors track
- Milestone tracker showing what each scenario enables
For financial modeling resources that cover each of these checklist items, EFM’s template library includes both SaaS-specific and industry-agnostic frameworks.
Frequently Asked Questions
Q: What dollar amount should my financial model project out to, and how many years?
A: Most Series A investors expect a 5-year projection, with years 1 and 2 built monthly and years 3 through 5 built annually. The monthly granularity in the near term matters because it shows cash burn timing precisely, which is what determines runway. A model that only shows annual figures in year 1 cannot answer the question “when exactly do you run out of cash?” with enough precision. For a $5M-$15M raise, investors typically want to see the path to at least $10M ARR or cash flow breakeven, whichever comes first, within the projection window.
Q: How many scenarios should a Series A financial model include?
A: Three scenarios is the standard: base, conservative, and aggressive. The conservative case is the most important one because it answers the investor’s primary risk question: does the business survive if things go wrong? Define each scenario with explicit parameter changes, not vague labels. For example, “conservative = CAC up 40%, growth rate down 20%, gross margin down 4 percentage points” is defensible. “Conservative = things don’t go as planned” is not. Some founders add a fourth “stress test” scenario for extreme downside cases, which can be useful for capital-intensive businesses.
Q: Do investors actually read the full financial model, or just the summary?
A: Lead investors read the full model during due diligence. Co-investors and angels often rely on the summary tab and the KPI dashboard. The practical implication is that your summary tab and dashboard must be self-contained and accurate, because that’s what most readers will see. But the full model must be airtight, because the lead investor’s analyst will go tab by tab. In the case study above, the lead investor’s analyst spent approximately 6 hours in the model over 3 sessions before the term sheet was issued.
Q: What’s the most common model mistake that kills fundraising conversations?
A: Top-down market share projections kill more conversations than any other single mistake. Saying “we’ll capture 1% of a $10B market” tells investors nothing about how you’ll actually generate revenue. The fix is a bottoms-up revenue build: start with the number of salespeople you plan to hire, multiply by their expected quota, apply a realistic attainment rate (typically 70-80% for early-stage teams, according to SaaS benchmarking data from Gartner Source), and sum across the team. This approach produces a revenue number that’s directly tied to a hiring plan, which investors can evaluate and stress-test.
Q: Should I hire a CFO or financial advisor to build my model before fundraising?
A: You don’t need to hire someone to build the model from scratch, but you should pay for at least one external review before the model reaches investors. A fractional CFO review typically costs $1,500 to $5,000 depending on model complexity and the reviewer’s experience. The return on that investment is significant: the company in this case study estimates that the fractional CFO review, which cost approximately $3,200, contributed to a 30% reduction in due diligence time and helped close the round 6 weeks faster than the founder’s initial estimate. Faster closes mean less distraction from running the business.
Q: How do I handle assumptions I genuinely don’t know yet?
A: Label them explicitly as estimates and cite the closest available benchmark. Investors respect intellectual honesty more than false precision. If you don’t have 12 months of cohort data because you’ve only been selling for 8 months, say so in the assumptions log and cite an industry benchmark for the months you haven’t yet observed. For example: “Months 9-12 retention assumed at 92% based on OpenView Partners SaaS Benchmarks median for similar ACV tier.” This approach shows that you know what you don’t know, which is itself a signal of financial maturity.
Q: What’s the difference between a financial model and a financial forecast?
A: A financial forecast is a single set of projected numbers, typically the base case. A financial model is a dynamic system where inputs drive outputs across multiple scenarios, and changing one assumption automatically updates all related outputs. Investors want a model, not a forecast. The distinction matters because a forecast answers “what do you expect to happen?” while a model answers “what happens to the business under different conditions?” The scenario analysis and sensitivity tables that investors scrutinize most are only possible in a true model, not a static forecast. Building a model requires more time upfront but produces a tool that answers investor questions in real time during meetings.
Conclusion
The $8.5M raise in this case study wasn’t won by a compelling story or a charismatic founder alone. It was won by a model that answered investor questions before they were asked, documented every assumption with a named source, and showed that the business survives even when things go wrong. The 14-tab structure, the cohort retention dashboard, the CAC payback sensitivity table, and the three-scenario runway analysis were not decorative. They were the evidence that converted interest into conviction.
The mistakes were equally instructive: top-down revenue projections, missing unit economics, circular references, and a single-scenario structure all stalled the first two pitches. Each fix was specific and structural, not cosmetic.
I recommend downloading EFM’s investment-ready financial model template to start with a pre-built structure that includes three-statement integration, a unit economics dashboard, cohort analysis, and a three-scenario comparison tab, the exact components that investors in this case study called out by name.























































