
0 ITEMS

ROI vs NPV vs IRR: Which Metric Wins Each Decision

Choosing the wrong financial metric doesn’t just produce a bad number — it produces a bad decision. Here’s how to match the right tool to every investment scenario.
Key Takeaways
- ROI = (Net Profit / Cost of Investment) × 100, and takes under 60 seconds to calculate, but it ignores the time value of money entirely.
- NPV discounts all future cash flows to today’s dollars, making it the gold standard for comparing projects with different timelines and sizes.
- IRR finds the discount rate that makes NPV equal zero — useful for ranking projects, but it breaks down when cash flows change sign more than once.
- Payback Period tells you how fast you recover your capital, which matters most when liquidity is tight or technology obsolescence is a risk.
- ROIC (Return on Invested Capital) measures how efficiently a business converts all invested capital into profit, making it the preferred metric for ongoing operational performance.
- Industry ROI benchmarks vary widely: retail averages 15-20%, SaaS targets a 3:1 LTV-to-CAC ratio, and real estate cap rates typically run 8-12%.
- Using 2 or 3 metrics together — rather than relying on one alone — eliminates the blind spots each metric carries individually.
Understanding ROI: The Foundation Metric
ROI (Return on Investment) measures the percentage gain or loss on an investment relative to its cost. It’s the starting point for almost every investment conversation because it’s fast, intuitive, and universally understood.
The formula:
ROI = (Net Profit / Cost of Investment) × 100
Where Net Profit = Total Returns minus Total Costs.
Worked example — marketing campaign:
Your team spends $50,000 on a digital campaign. It generates $185,000 in attributed revenue. The cost of goods sold on those sales is $90,000, leaving a net profit of $95,000.
Here’s the math:
- Net Profit = $185,000 revenue − $90,000 COGS − $50,000 campaign cost = $45,000
- ROI = ($45,000 / $50,000) × 100 = 90%
A 90% ROI looks strong. But if that campaign ran over 3 years, the annualized ROI drops to roughly 24% — still solid, but a very different story. Always annualize ROI when comparing investments with different durations.
ROI expressed as a percentage: the most universally understood investment metric, but one that ignores the timing of cash flows.
What counts as a good ROI? Context determines everything. The S&P 500’s long-run average annual return is approximately 10% Source. Any project ROI below that threshold should face serious scrutiny, since passive equity investment would outperform it.
ROI’s core limitation: It treats a dollar received in year 5 as equal to a dollar received today. For short-term decisions under 12 months, that’s acceptable. For anything longer, you need NPV.
Net Present Value (NPV): Accounting for Time Value of Money
NPV converts all future cash flows into today’s dollars using a discount rate, then subtracts the initial investment. A positive NPV means the project creates value above your required return; a negative NPV destroys it.
The formula:
NPV = Σ CFt / (1 + r)^t − Initial Investment
Where CFt = cash flow in period t, r = discount rate, and t = time period.
Choosing the discount rate: Most companies use their Weighted Average Cost of Capital (WACC) as the discount rate for NPV calculations. Approximately 75% of CFOs use WACC as their primary discount rate for capital budgeting Source. For riskier projects, analysts add a risk premium of 2-5 percentage points above WACC. Excel’s NPV function can handle up to 254 value arguments Source, making it practical to model detailed multi-period cash flow schedules directly in a spreadsheet.
Worked example — equipment purchase:
You’re choosing between two CNC machines:
- Machine A: $200,000 upfront, generates $60,000/year for 5 years
- Machine B: $200,000 upfront, generates $20,000 in year 1, scaling to $100,000 by year 5
Using a 10% discount rate:
Machine A NPV:
- Year 1: $60,000 / 1.10 = $54,545
- Year 2: $60,000 / 1.21 = $49,587
- Year 3: $60,000 / 1.331 = $45,079
- Year 4: $60,000 / 1.464 = $40,984
- Year 5: $60,000 / 1.611 = $37,258
- Sum of PVs = $227,453 − $200,000 = NPV: $27,453
Machine B’s back-loaded cash flows produce a lower NPV at the same discount rate — even if its undiscounted total is identical. NPV reveals that timing gap. This is exactly why NPV wins for comparing mutually exclusive projects.
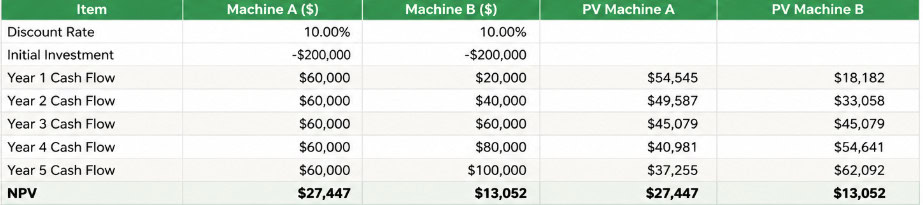
Machine A NPV = $27,453 vs Machine B NPV = $18,954 at 10% discount rate — back-loaded cash flows destroy value relative to even distributions.
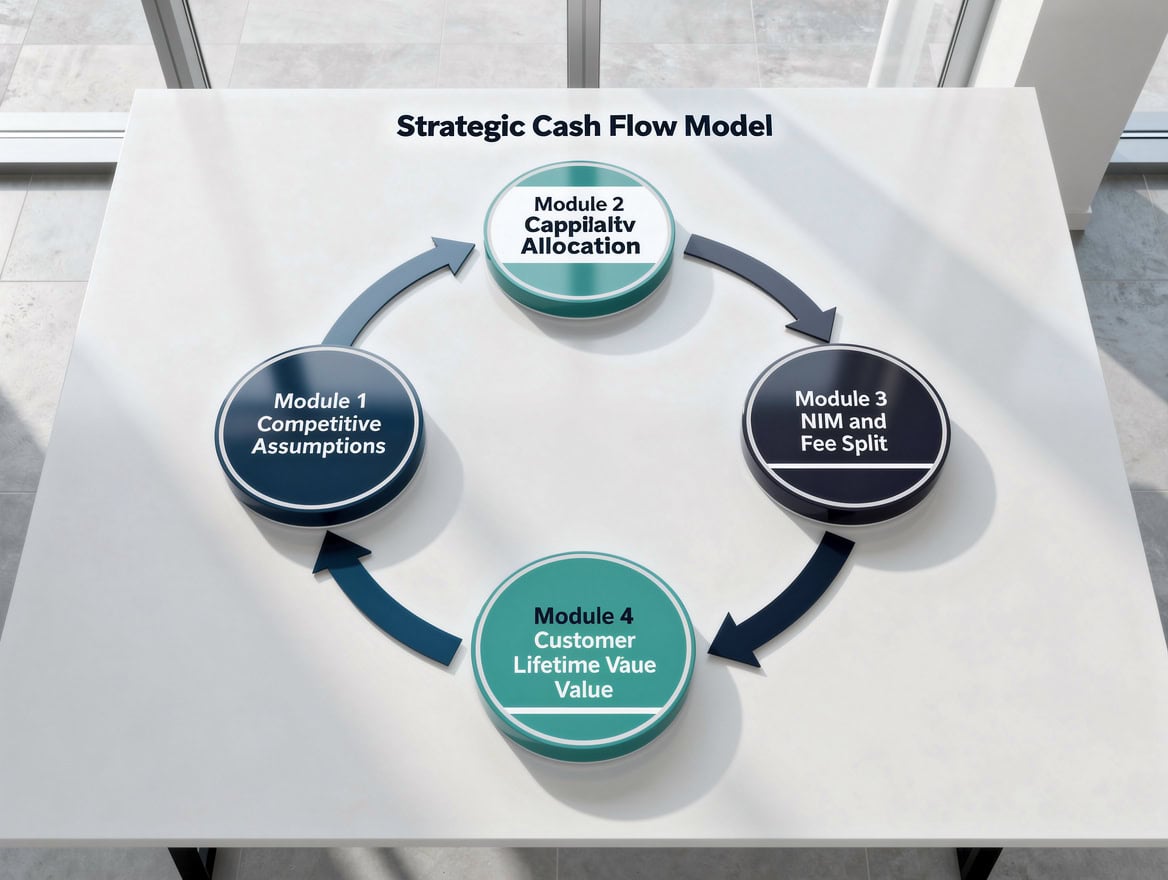
Machine B’s back-loaded cash flows produce a lower NPV than Machine A’s even flows — a difference invisible to simple ROI.
Internal Rate of Return (IRR): Finding the Break-Even Discount Rate
IRR is the discount rate at which NPV equals exactly zero. Think of it as the project’s internal yield — the higher the IRR, the more cushion above your cost of capital.
The decision rule: Accept a project if IRR exceeds your hurdle rate (typically WACC). Reject it if IRR falls below.
Where IRR breaks down:
- Multiple IRRs: When a project’s cash flows change sign more than once (positive, then negative, then positive again — common in mining or real estate with cleanup costs), the IRR equation can produce multiple mathematically valid answers. This makes the metric meaningless without modification.
- Scale blindness: A $10,000 project with a 50% IRR creates less value than a $1,000,000 project with a 20% IRR. IRR ignores absolute dollar magnitude.
- Reinvestment rate assumption: IRR implicitly assumes interim cash flows are reinvested at the IRR itself — an assumption that’s often unrealistic. Modified IRR (MIRR) corrects this by letting you specify a realistic reinvestment rate. Excel’s MIRR function requires exactly 3 arguments — the cash flow values, the finance rate, and the reinvestment rate Source — making it straightforward to apply a more realistic reinvestment assumption than standard IRR allows.
Private equity firms typically target IRRs of 20-30% on buyout investments Source, while corporate capital budgeting projects often use hurdle rates of 10-15% depending on sector and risk profile.
Payback Period and ROIC: Complementary Metrics
Payback Period and ROIC don’t replace ROI, NPV, or IRR — they answer different questions that those metrics can’t.
Payback Period measures how many years it takes to recover the initial investment from cash flows. It ignores everything that happens after breakeven, which is a serious flaw for long-lived assets. But for technology investments where obsolescence risk is high, or for companies with tight liquidity, knowing you’ll recover capital in 18 months versus 4 years is operationally critical.
Payback Period = Initial Investment / Annual Cash Flow (for even cash flows)
ROIC (Return on Invested Capital) measures operating profit after tax divided by total invested capital (debt plus equity). Unlike ROI, which can be applied to a single project, ROIC evaluates how efficiently the entire business or a business unit deploys capital. Companies that sustain ROIC above their cost of capital for 10+ years generate the majority of long-term shareholder value Source. A ROIC consistently above WACC signals a durable competitive advantage.
ROIC = Net Operating Profit After Tax (NOPAT) / Invested Capital

Payback Period answers ‘when do I get my money back?’ while ROIC answers ‘how efficiently is the business using all its capital?’
Side-by-Side Comparison: When to Use Each Metric
No single metric dominates every situation. The table below maps each metric to its strengths, weaknesses, and ideal use cases.
| Metric | Time Value | Ease of Use | Best For | Key Weakness |
|---|---|---|---|---|
| ROI | No | Very High | Quick screening, marketing | Ignores timing |
| NPV | Yes | Medium | Mutually exclusive projects | Requires accurate discount rate |
| IRR | Yes | Medium | Ranking independent projects | Scale blind, multiple IRR risk |
| Payback Period | No | Very High | Liquidity-constrained decisions | Ignores post-payback cash flows |
| ROIC | Partial | Medium | Ongoing operational performance | Not suited for single-project analysis |
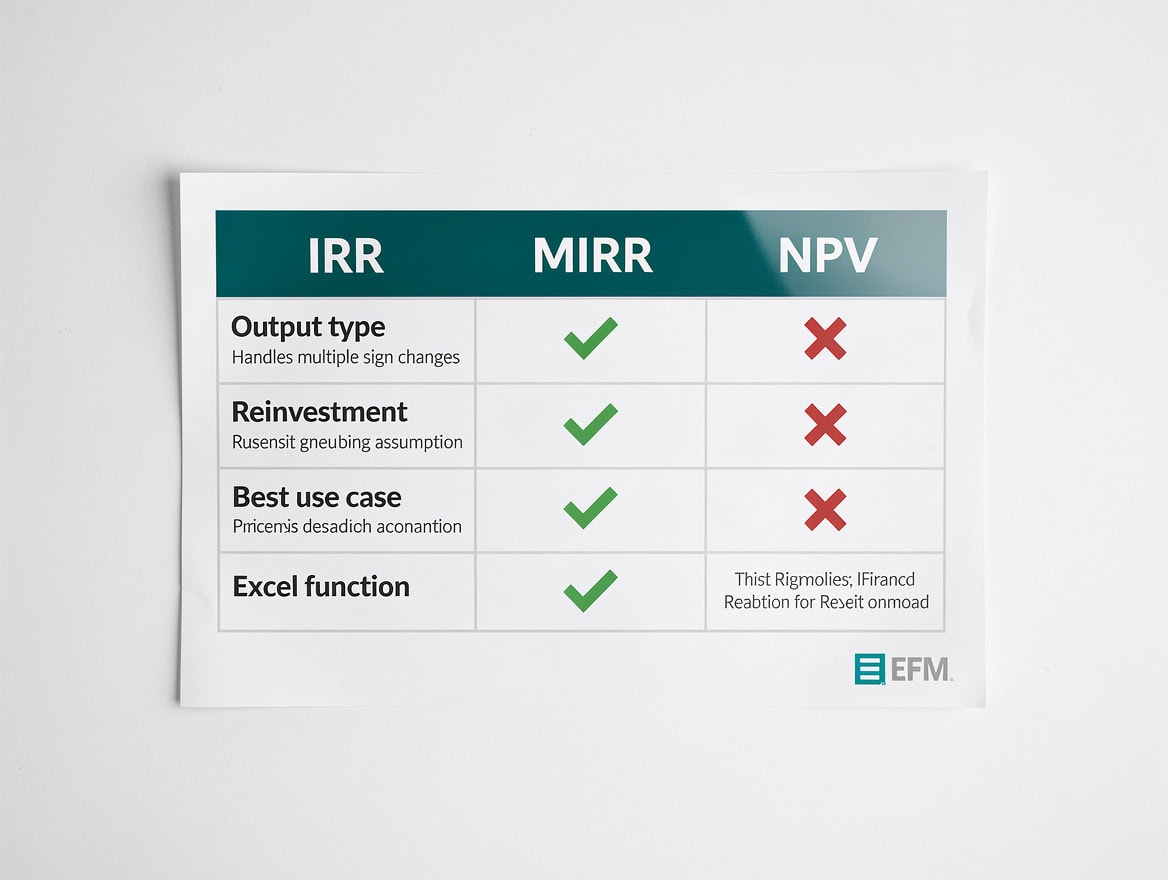
No single metric dominates every scenario — the right choice depends on decision context, time horizon, and organizational constraints.
Industry Benchmark ROI Ranges
ROI benchmarks vary significantly by sector, risk profile, and investment type. Applying a retail benchmark to a SaaS investment will produce a misleading verdict.
- Retail: 15-20% annual ROI is considered healthy, reflecting thin margins and high inventory turnover requirements.
- SaaS / Technology: The industry standard targets a Customer Lifetime Value to Customer Acquisition Cost (LTV:CAC) ratio of at least 3:1, which implies strong unit economics even before accounting for expansion revenue.
- Manufacturing: 10-15% ROI is typical, reflecting capital intensity and longer asset lives.
- Real Estate: Cap rates (a real estate proxy for ROI) of 8-12% are standard for commercial properties in secondary markets; prime urban assets often trade at 4-6% cap rates, with investors accepting lower current yield for appreciation potential.
- Healthcare: Hospital systems and medical device companies typically target 15-25% ROI on capital projects, reflecting regulatory risk and long approval timelines.
- Private Equity: As noted above, buyout funds target 20-30% gross IRR, though net IRR to limited partners after fees averages closer to 13-15% based on Cambridge Associates data.
These benchmarks should serve as starting points, not hard rules. A 12% ROI in a low-risk, stable-cash-flow business may be more valuable than a 25% ROI in a highly cyclical one.

Industry benchmarks vary by 2x or more across sectors — always compare ROI to the relevant sector standard, not a generic threshold.
Decision Scenario: Real Estate Investment Analysis
A property investor evaluates a $500,000 commercial building. Expected annual net operating income (NOI) is $45,000. The investor plans to sell in year 7 for $650,000. The required return is 8%.
Step 1 — Cap Rate (ROI proxy):
Cap Rate = NOI / Purchase Price = $45,000 / $500,000 = 9%
This clears the 8-12% benchmark for secondary markets.
Step 2 — NPV at 8% discount rate:
Annual NOI for 7 years plus $650,000 terminal sale, all discounted at 8%:
- PV of 7-year annuity ($45,000 at 8%) = $45,000 × 5.206 = $234,270
- PV of terminal sale ($650,000 in year 7 at 8%) = $650,000 / 1.714 = $379,230
- Total PV = $613,500 − $500,000 initial = NPV: $113,500
Positive NPV confirms the deal creates value above the 8% hurdle. The cap rate gave a quick green light; NPV quantified the actual dollar value created.
Step 3 — Payback Period:
$500,000 / $45,000 = 11.1 years (from NOI alone)
If the investor needs capital back within 10 years, this deal fails the payback test — even though NPV is positive. This is why using multiple metrics matters.

The same real estate deal passes the cap rate and NPV tests but fails a 10-year payback constraint — showing why multiple metrics matter.
Using Multiple Metrics Together: A Balanced Approach
The most robust investment decisions combine at least 2 metrics that compensate for each other’s blind spots. Here’s a practical framework used in financial modeling practice:
Tier 1 — Quick screen: Calculate ROI. If it doesn’t clear your industry benchmark, stop.
Tier 2 — Value confirmation: Calculate NPV. If NPV is positive at your WACC, the project creates value in absolute dollar terms.
Tier 3 — Ranking (if capital is constrained): Calculate IRR or Profitability Index (NPV / Investment) to rank competing projects when you can’t fund all of them.
Tier 4 — Liquidity check: Calculate Payback Period. If your organization has a cash constraint or the technology has a short useful life, a long payback period is a deal-breaker regardless of NPV.
For ongoing business performance rather than project evaluation, replace project-level ROI with ROIC tracked quarterly. You can build this into a three-statement financial model to monitor capital efficiency across business units.
For startup financial models, LTV:CAC ratio and payback period on customer acquisition cost often matter more than NPV in early stages, since discount rates are highly uncertain and cash runway is the binding constraint.

A tiered approach to metric selection eliminates the blind spots of any single measure and mirrors how institutional investors evaluate capital allocation.
Common Calculation Mistakes and How to Fix Them
Even experienced analysts make these errors. Each one can flip a project decision.
1. Failing to annualize ROI: Comparing a 6-month project with 30% ROI to a 3-year project with 60% ROI without annualizing makes the longer project look better. Annualized ROI = (1 + ROI)^(1/years) − 1. The 3-year project annualizes to roughly 17%.
2. Using the wrong discount rate for NPV: Applying a company-wide WACC to a high-risk R&D project understates risk and inflates NPV. Add a project-specific risk premium. Conversely, using an inflated rate for a low-risk infrastructure project will reject value-creating investments.
3. Ignoring working capital changes in ROI: A project that generates $100,000 in profit but requires $80,000 in additional inventory has a real net return of $20,000, not $100,000. Always include working capital movements in the cost base.
4. Cherry-picking the time period: An investment that loses money in years 1-2 but profits in years 3-5 will show a terrible ROI if measured at the 2-year mark. Define the measurement period before calculating, not after seeing the results.
5. Trusting IRR when cash flows flip sign: If your project has a large decommissioning cost in the final year (negative cash flow after years of positive flows), IRR may produce two valid solutions. Use NPV or MIRR instead.

Each of these errors can flip a project decision from accept to reject — or vice versa — without the analyst realizing the calculation is flawed.
Frequently Asked Questions
How do I calculate ROI step by step?
ROI calculation takes three steps. First, identify your total returns — revenue, cost savings, or asset appreciation generated by the investment. Second, subtract all costs associated with the investment, including acquisition cost, operating costs, and any disposal costs. Third, divide that net profit by the total cost and multiply by 100 to express it as a percentage. For example, if you invest $20,000 in equipment and it generates $32,000 in net savings over its life, your ROI = ($32,000 − $20,000) / $20,000 × 100 = 60%. Always state the time period alongside the ROI figure, since 60% over 10 years is very different from 60% over 2 years. You can use financial projection templates to structure this calculation consistently.
When should I use NPV instead of ROI?
Use NPV whenever the investment spans more than 12 months, involves uneven cash flows, or you’re comparing two mutually exclusive projects of different sizes. ROI treats all cash flows as equal regardless of when they occur, which systematically overvalues projects with back-loaded returns. NPV corrects this by discounting future cash flows to present value using your cost of capital. If you’re evaluating a 5-year equipment purchase versus a 3-year lease, NPV will give you a more accurate comparison than ROI. The discount rate you choose matters enormously — a 1 percentage point change in the discount rate on a 10-year project can shift NPV by 8-12% of the initial investment.
What is a good IRR for a corporate project?
A good IRR exceeds your company’s hurdle rate, which is typically set at WACC plus a risk premium. For most mid-sized corporations, WACC runs between 8-12%, so a project IRR of 15-20% provides meaningful cushion. Private equity buyout funds target gross IRRs of 20-30%, though net returns to investors after management fees and carried interest average closer to 13-15% based on Cambridge Associates industry data. For early-stage venture investments, target IRRs often exceed 30-40% to compensate for the high failure rate across a portfolio. Always compare IRR to the relevant hurdle rate for your risk class, not to a generic benchmark.
Can ROI and NPV give conflicting recommendations?
Yes, and this happens more often than analysts expect. A project with a high ROI percentage but small absolute investment may have a lower NPV than a larger project with a modest ROI. For example, Project A costs $10,000 and returns 80% ROI ($8,000 profit), while Project B costs $500,000 and returns 25% ROI ($125,000 profit). If you can only choose one, NPV favors Project B because it creates $125,000 in value versus $8,000. ROI favors Project A. The right answer depends on whether capital is constrained. If you have $500,000 available and can’t replicate Project A 50 times, NPV wins. If capital is scarce and you can redeploy the remaining $490,000 elsewhere at high returns, ROI-based ranking makes sense.
What is ROIC and how does it differ from ROI?
ROIC (Return on Invested Capital) measures how efficiently a company generates profit from all the capital it has deployed — both debt and equity. The formula is NOPAT (Net Operating Profit After Tax) divided by total invested capital. Unlike ROI, which you apply to a specific project or campaign, ROIC evaluates the entire business or a business unit over a reporting period. A company with ROIC consistently above its WACC is creating shareholder value; one with ROIC below WACC is destroying it even if it’s profitable. According to McKinsey research, companies sustaining ROIC above cost of capital for a decade generate the vast majority of long-term equity market returns. ROIC is the metric Warren Buffett has cited most frequently when describing durable competitive advantages.
How do I handle ROI for a marketing campaign?
Marketing ROI requires careful attribution of both revenue and costs. On the revenue side, include only the incremental revenue attributable to the campaign — not total revenue during the campaign period. On the cost side, include media spend, creative production, agency fees, and the fully loaded cost of any internal team time. The formula remains (Net Profit / Campaign Cost) × 100, but net profit here means incremental gross profit minus campaign costs. A common mistake is using revenue instead of gross profit in the numerator, which inflates marketing ROI by ignoring COGS. For SaaS businesses, the more relevant metric is LTV:CAC ratio — a ratio above 3:1 indicates healthy unit economics, while below 1:1 means you’re losing money on every customer acquired.
What is the Payback Period and when does it matter most?
Payback Period is the number of years required to recover the initial investment from project cash flows. For even annual cash flows, it’s simply Initial Investment divided by Annual Cash Flow. For uneven flows, you sum cash flows year by year until you reach the initial investment amount. Payback Period matters most in three situations: when your organization has a liquidity constraint and needs capital returned quickly; when the investment involves rapidly evolving technology where a 5-year payback means the asset may be obsolete before you break even; and when operating in politically or economically unstable environments where long-term cash flow projections carry high uncertainty. Its major flaw is that it completely ignores cash flows after the payback point, which means it will always favor short-lived projects over long-lived ones, even when the latter create far more total value.
Why should I use multiple metrics instead of just one?
Each metric answers a different question and carries blind spots. ROI is fast but ignores timing. NPV accounts for timing but requires an accurate discount rate. IRR ranks projects but is scale-blind. Payback Period checks liquidity but ignores long-term value. Using 2-3 metrics together eliminates individual blind spots and produces more robust decisions. A project might pass the ROI screen and NPV test but fail a payback constraint — information you’d miss using only one metric. The tiered approach (ROI screen → NPV confirmation → IRR ranking → Payback check) mirrors how institutional investors evaluate capital allocation and reduces the risk of systematic decision errors.
Conclusion
ROI gives you speed. NPV gives you accuracy. IRR gives you a yield to compare against your hurdle rate. Payback Period gives you a liquidity check. ROIC gives you a long-run operational scorecard. None of these metrics is universally superior — each answers a different question, and the best investment decisions use at least two in combination.
The real skill isn’t calculating these metrics. It’s knowing which combination to deploy for a given decision context, and recognizing when a metric’s assumptions don’t fit your situation.
I recommend downloading the EFM Return on Investment (ROI) templates to standardize your investment evaluation process across projects and departments, with pre-built ROI, NPV, IRR, and Payback Period calculators that let you run all four metrics side by side on any investment scenario.
























































