
0 ITEMS

Batteries Power the Green Energy Transition: Key Economics
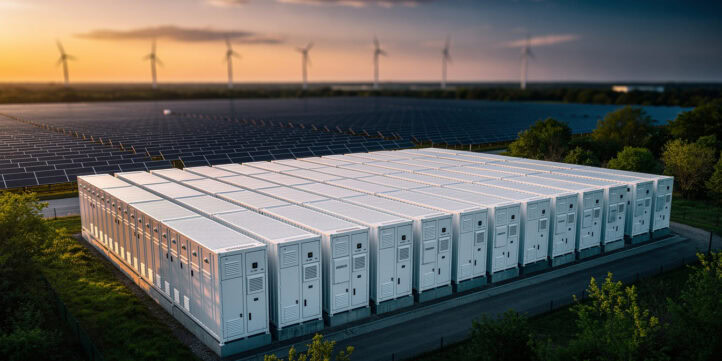
Battery storage has moved from a niche technology to the single most consequential infrastructure decision in renewable energy project finance — and the numbers now prove it.
Key Takeaways
- The levelized cost of storage (LCOS) for lithium-ion batteries fell roughly 90% between 2010 and 2023, reaching approximately $150–$200 per MWh for four-hour grid-scale systems, according to BloombergNEF.
- Pairing solar with four-hour battery storage can lift effective capacity factor from roughly 25% to above 50%, fundamentally changing project bankability.
- Global battery storage capacity additions hit a record 42 GW in 2023, more than doubling the prior year’s installations, according to the International Energy Agency (IEA).
- Lithium demand is projected to grow 3–4x by 2030 relative to 2023 production levels, creating a credible supply chain bottleneck that raises project cost risk.
- Under current US policy, standalone battery storage projects qualify for a 30% Investment Tax Credit (ITC) under the Inflation Reduction Act, materially improving project IRRs.
- Round-trip efficiency for lithium-ion batteries sits at 85–92%, versus 65–80% for vanadium flow batteries and roughly 70–85% for pumped hydro — a critical variable in any LCOS model.
- Interconnection queue wait times now average 5 years in the US, according to Lawrence Berkeley National Laboratory (LBNL), meaning project timelines must account for delays that dwarf construction schedules.
Why Intermittency Is the Trillion-Dollar Problem Batteries Solve
Intermittency — the inability of solar and wind to generate power on demand — is the core economic barrier that prevents renewables from replacing dispatchable fossil fuel generation at scale. Without storage, a solar farm produces power when the sun shines, not when the grid needs it most. That mismatch destroys value: wholesale electricity prices often go negative during midday solar peaks in markets like California’s CAISO, while evening demand spikes command prices 5–10x higher.
Batteries solve this by enabling temporal arbitrage: charging during low-price, high-generation periods and discharging during high-price, high-demand periods. This arbitrage creates a bankable revenue stream that lenders can underwrite. Without it, many renewable projects cannot achieve the debt service coverage ratios (DSCRs — the ratio of operating cash flow to debt payments, typically required above 1.25x by project finance lenders) needed to close construction financing.
The IEA estimates that integrating variable renewables at scale requires storage and flexibility investments totaling trillions of dollars globally through 2050. That is not a climate advocacy number — it is the capital requirement implied by the generation mix already contracted and under construction.
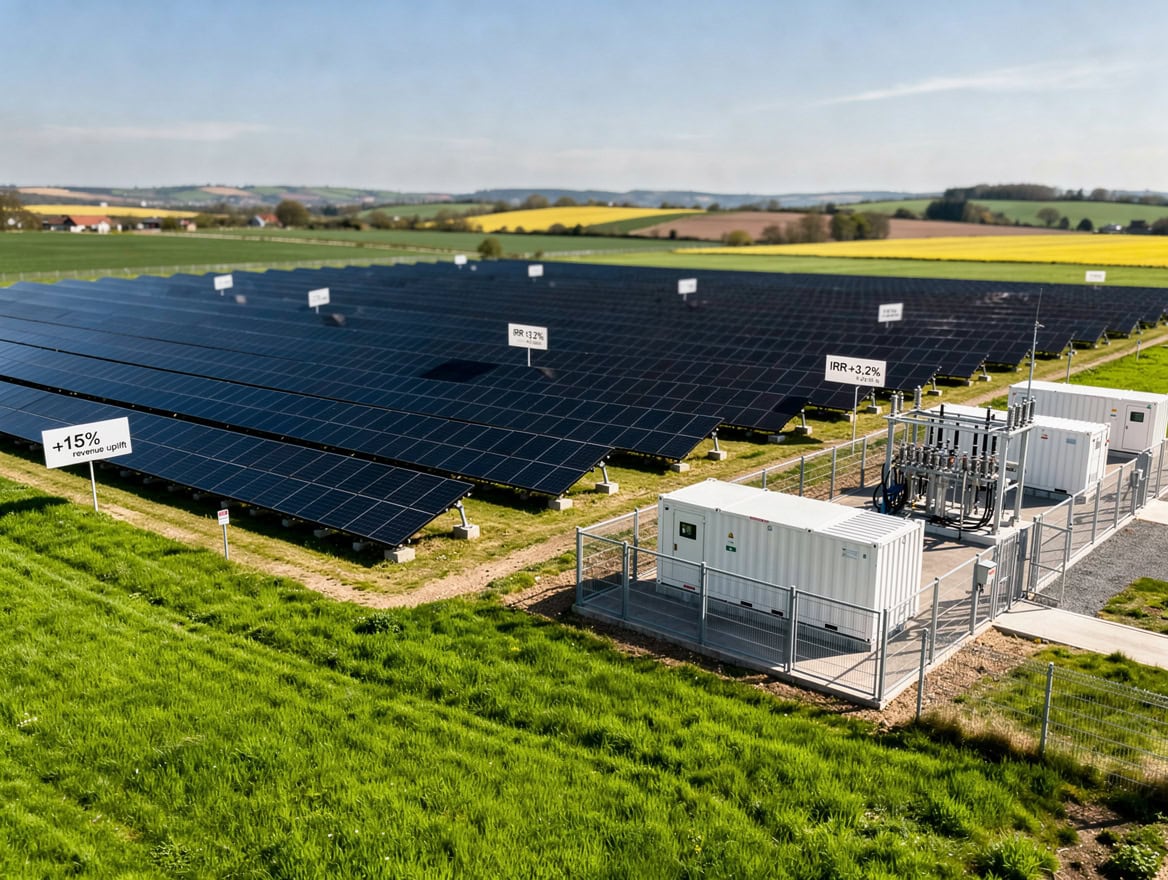
Energy arbitrage captures the spread between off-peak generation costs and peak demand prices — the core revenue mechanism for grid-scale storage.
The Economics of Energy Arbitrage: How Storage Transforms Project IRRs
Storage paired with renewables improves project economics through three distinct revenue streams: energy arbitrage, capacity payments, and ancillary services. Each has different risk profiles and contract structures.
Here’s the math on a representative 100 MW solar-plus-storage project with a 400 MWh (four-hour) battery system:
- Energy arbitrage: Assume a $30/MWh average price spread between charge and discharge periods, 250 discharge cycles per year, and 90% round-trip efficiency. Annual arbitrage revenue = 400 MWh × 250 cycles × $30 × 0.90 = $2.7 million per year.
- Capacity payments: In PJM’s capacity market, cleared prices have ranged from $28 to $50 per MW-day. At $34/MW-day for 100 MW of qualified capacity: 100 MW × $34 × 365 = $1.24 million per year.
- Ancillary services (frequency regulation): FERC Order 755 requires ISOs to compensate storage for fast-response frequency regulation. Revenue varies by market but can add $50,000–$300,000 per year for a 100 MW system.
Combined, these three streams can generate $4–$5 million annually on a project with roughly $120–$150 million in capital cost (solar + storage combined). That implies an unlevered project IRR in the 8–12% range before tax equity and debt structuring — sufficient to attract institutional capital when paired with a power purchase agreement (PPA).
The LCOS (levelized cost of storage — the all-in cost per MWh of energy discharged over a system’s lifetime, analogous to LCOE for generation) for four-hour lithium-ion systems has fallen from over $1,000/MWh in 2010 to approximately $150–$200/MWh in 2024, according to BloombergNEF. BloombergNEF projects further declines to $80–$100/MWh by 2030 as manufacturing scales.
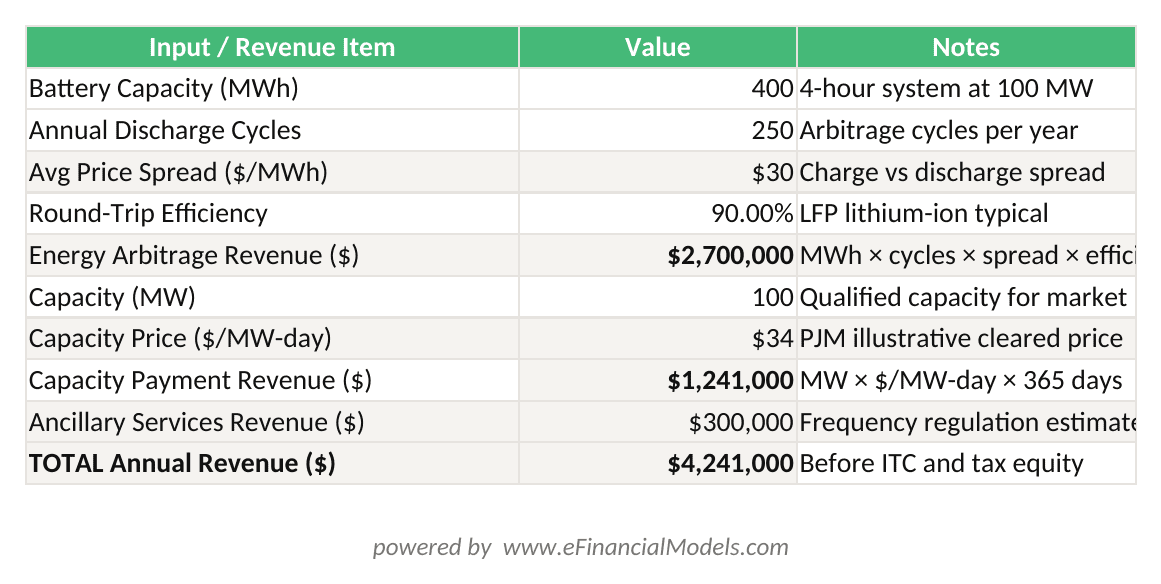
Revenue stack for a 100 MW / 400 MWh project: energy arbitrage + capacity payments + ancillary services = $4.24M/year before tax benefits.

A 100 MW / 400 MWh project can stack energy arbitrage, capacity payments, and ancillary services to reach $4–5M in annual revenue.
Critical Minerals and the Supply Chain Chokepoint Nobody Wants to Discuss
The battery boom has a hard physical constraint: the minerals required to build lithium-ion cells are geographically concentrated and production-constrained. Lithium, cobalt, nickel, and manganese are not interchangeable commodities — each requires years of permitting, development, and processing infrastructure to bring new supply online.
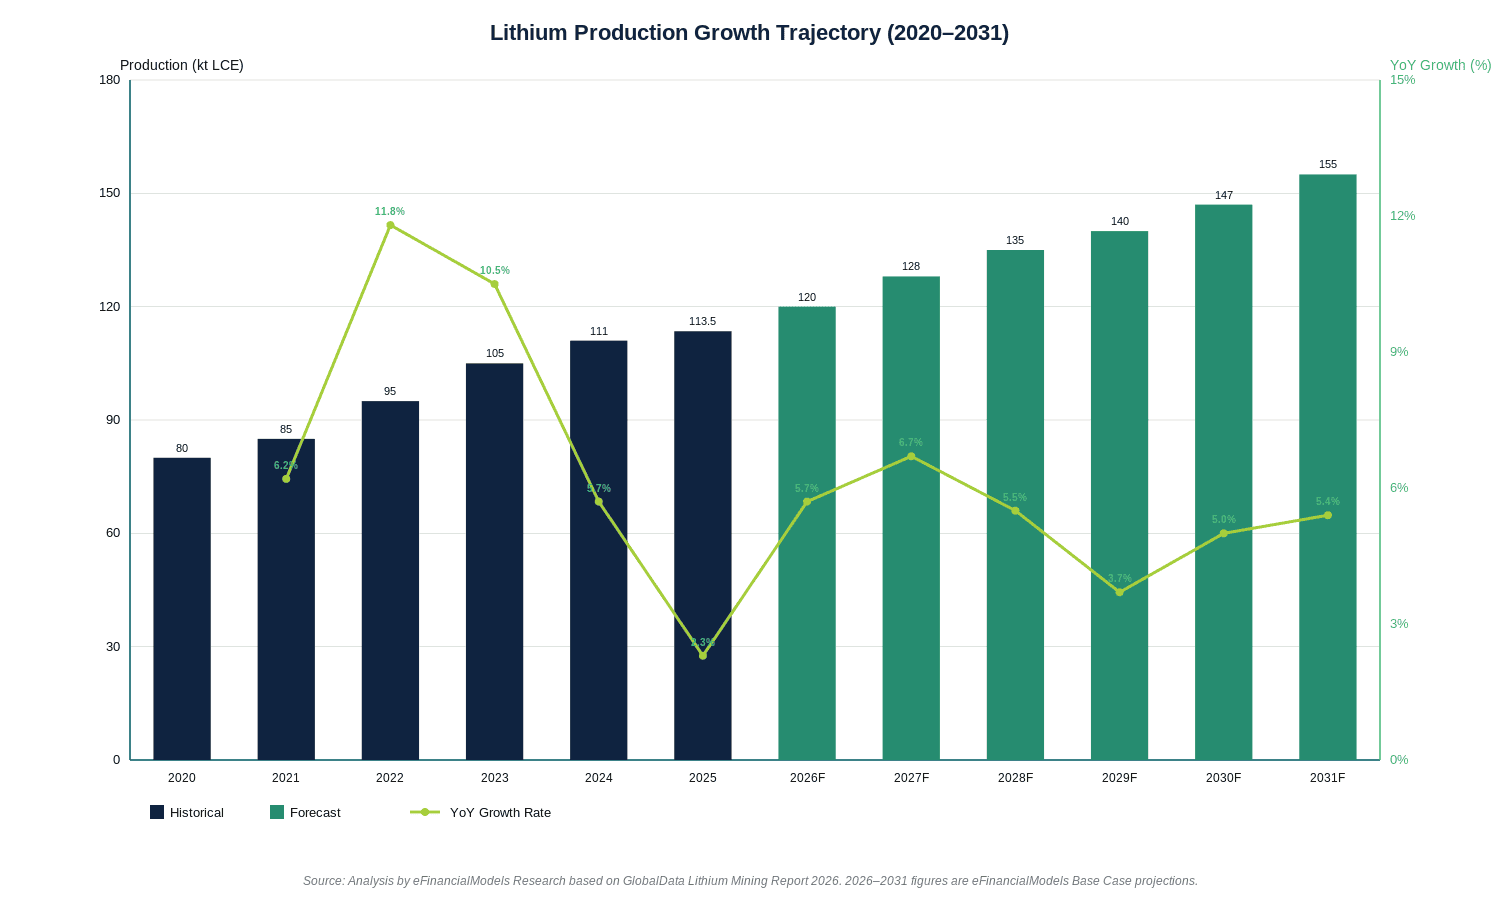
The IEA’s Critical Minerals report projects that lithium demand for batteries alone will grow 3–4 times by 2030 relative to 2023 production levels. Cobalt demand faces similar pressure, with roughly 70% of current production concentrated in the Democratic Republic of Congo according to the US Geological Survey (USGS). Nickel supply is more diversified but faces processing bottlenecks: battery-grade nickel sulfate requires refining capacity that lags raw ore production.
For project developers, this creates two concrete risks. First, battery procurement costs may not follow the smooth downward curve that financial models assume — spot price volatility for lithium carbonate ranged from $7,000/tonne to $80,000/tonne between 2020 and 2023 (S&P Global Commodity Insights). Second, long-lead procurement timelines (12–18 months for utility-scale battery systems) mean that projects must lock in equipment contracts well before financial close, adding procurement risk to an already complex capital stack.
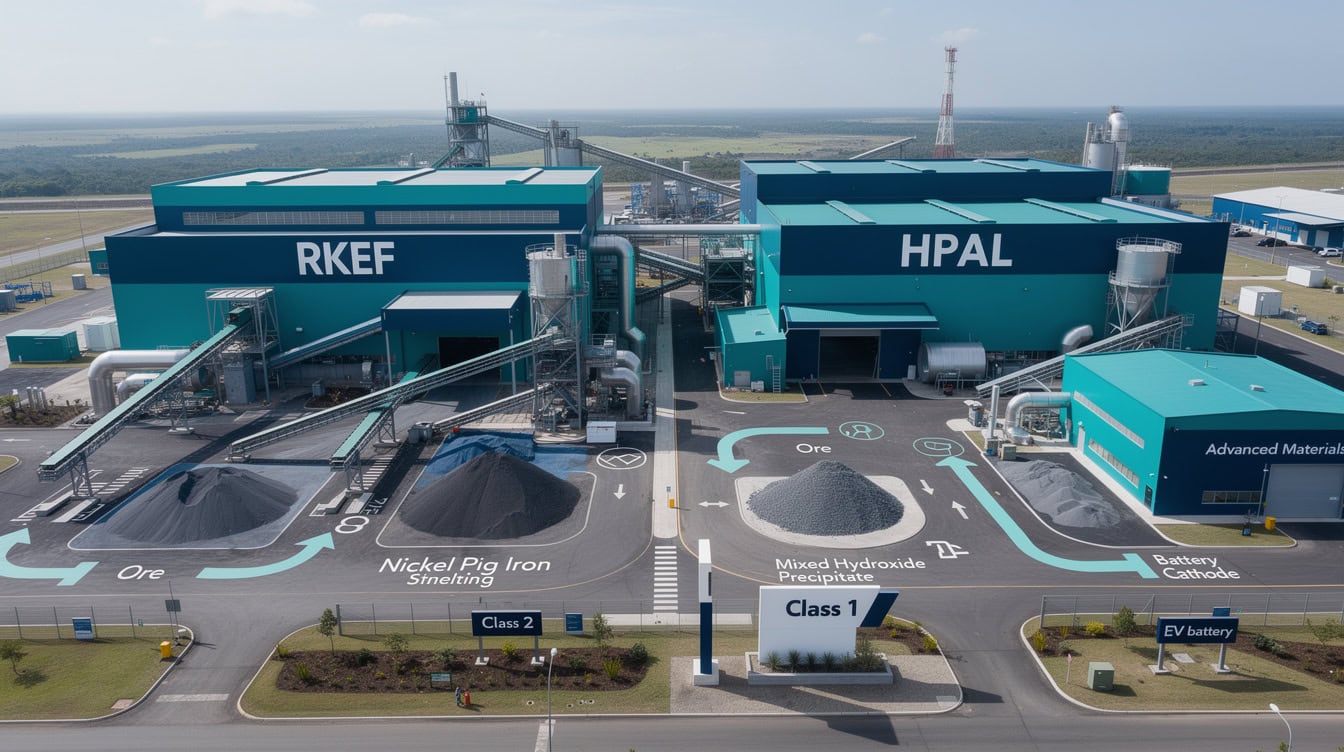
Mitigants include long-term supply agreements with battery manufacturers, chemistry diversification toward lower-cobalt or cobalt-free cathodes (LFP — lithium iron phosphate — uses no cobalt and has gained significant market share), and geographic diversification of procurement.
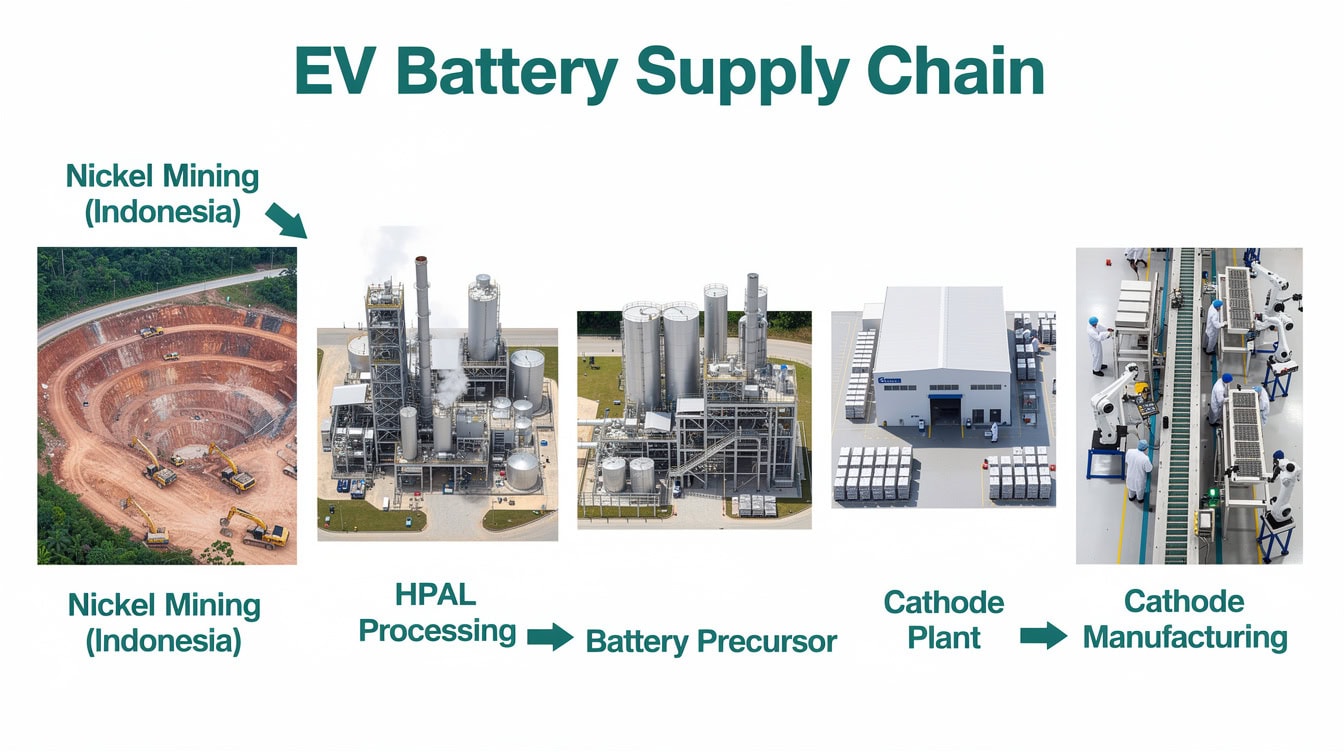
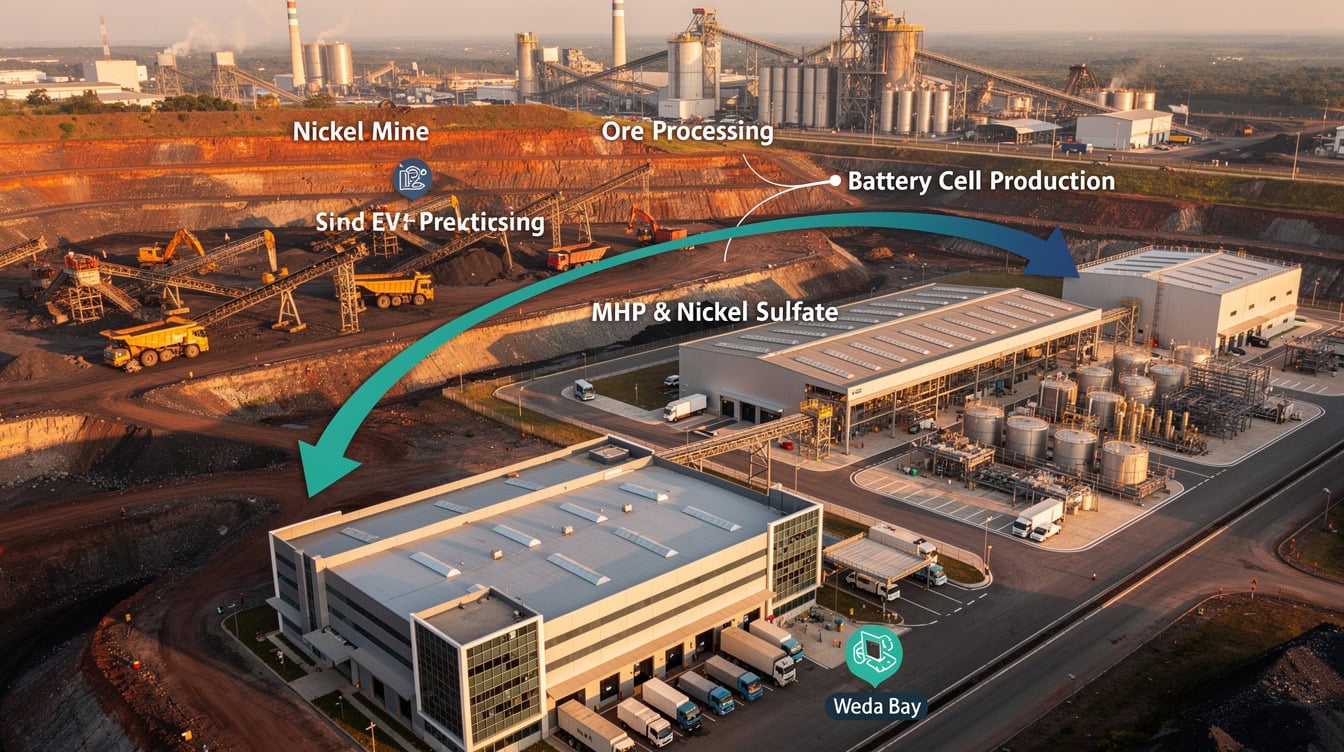
Critical mineral supply is geographically concentrated — 70% of cobalt comes from the DRC, creating procurement risk for battery project developers.
Lithium-Ion Dominance vs. The Next Generation: A Technology Risk Assessment
Lithium-ion batteries currently dominate grid-scale storage, but four alternative chemistries are advancing toward commercial viability. Each involves genuine trade-offs that affect project risk profiles.
| Technology | LCOS (2024 est.) | Round-Trip Efficiency | Cycle Life | Commercial Status |
|---|---|---|---|---|
| Lithium-ion (LFP) | $150–200/MWh | 88–92% | 3,000–6,000 cycles | Fully commercial |
| Vanadium flow | $250–350/MWh | 65–75% | 20,000+ cycles | Commercial (niche) |
| Sodium-ion | $120–180/MWh (proj.) | 85–90% | 2,000–4,000 cycles | Early commercial |
| Solid-state | $400–600/MWh (proj.) | 90–95% | TBD at scale | Pre-commercial |
| Compressed air (CAES) | $100–150/MWh | 50–70% | N/A (mechanical) | Limited commercial |
LFP chemistry has become the default for grid-scale projects because it eliminates cobalt, offers strong thermal stability (reducing fire risk), and achieves competitive cycle life. Vanadium flow batteries suit applications requiring very long duration (8+ hours) or very high cycle counts, but their higher upfront cost limits bankability at current LCOS levels. Sodium-ion is the most credible near-term challenger to LFP — CATL began commercial sodium-ion production in 2023 — but cycle life data at scale remains limited. Solid-state batteries remain a 2030+ commercial proposition for stationary storage despite significant venture capital investment.
LFP lithium-ion dominates grid-scale deployment today; sodium-ion is the most credible near-term challenger with commercial production beginning in 2023.
Grid-Scale vs. Distributed Storage: Two Different Business Models
Grid-scale and behind-the-meter (BTM) storage operate under fundamentally different economic logic, and conflating them in financial models is a common and costly mistake.
Grid-scale storage (typically 10 MW and above) earns revenue through wholesale market participation: energy arbitrage, capacity markets, and ancillary services. Revenue is market-price-dependent and requires sophisticated dispatch optimization. Projects typically require a PPA or tolling agreement to achieve investment-grade credit quality for project finance lenders.
Behind-the-meter storage for commercial and industrial (C&I) customers earns value primarily through demand charge reduction. Demand charges — the portion of a utility bill based on peak 15-minute consumption — can represent 30–50% of a large commercial customer’s electricity bill, according to the US Department of Energy (US DOE). A 500 kW / 1 MWh battery system that shaves peak demand by 200 kW can reduce monthly demand charges by $3,000–$6,000 depending on the utility rate (at $15–$30/kW-month demand charge rates common in US commercial tariffs). Simple payback periods for well-designed C&I systems typically run 5–8 years before incentives, and 3–5 years after applying the 30% ITC.
Resilience value — the economic benefit of maintaining operations during grid outages — is harder to quantify but can be decisive for data centers, hospitals, and manufacturers with high outage costs. A 2022 Lawrence Berkeley National Laboratory study estimated average outage costs for US commercial customers at $22,000 per event, a figure that anchors resilience value calculations in project pro formas.
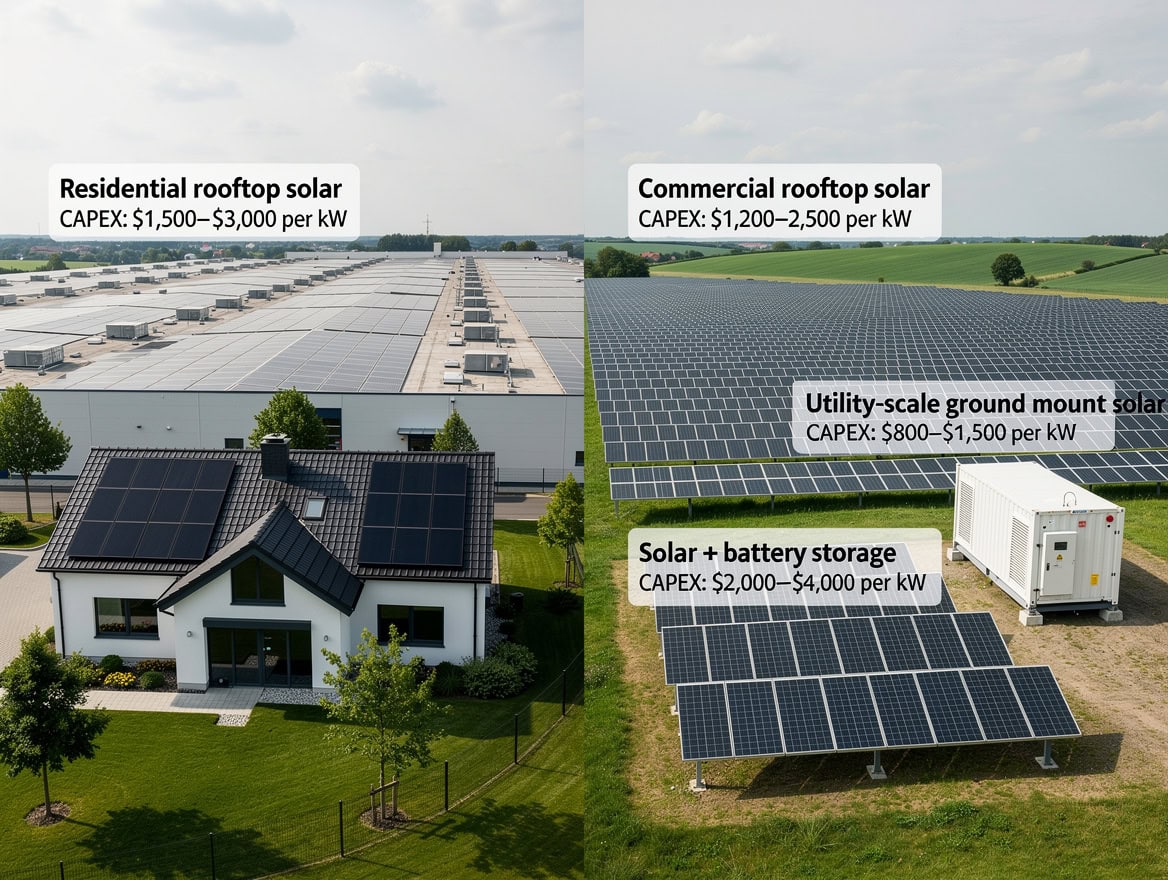
Grid-scale storage earns through wholesale markets; C&I behind-the-meter storage earns primarily through demand charge reduction — two completely different financial models.
Policy Incentives and Market Design: What Makes Battery Projects Bankable
Policy frameworks determine whether battery storage projects clear the IRR hurdle required by equity investors and the DSCR thresholds required by lenders. Three policy levers matter most for US projects.
First, the Inflation Reduction Act (IRA) extended the 30% Investment Tax Credit to standalone battery storage systems (not just storage paired with solar) for projects beginning construction before 2033. For a $50 million battery project, that represents $15 million in tax credit value — enough to shift an 8% unlevered IRR to 12%+ on a levered basis when structured through tax equity.
Second, FERC Order 841 (issued 2018) requires all US wholesale electricity markets to allow storage resources to participate in energy, capacity, and ancillary services markets on a technology-neutral basis. This opened revenue stacks that were previously inaccessible to storage developers.
Third, capacity market design varies dramatically by ISO. PJM’s capacity market has historically provided the most predictable capacity revenue for storage. CAISO’s resource adequacy framework is evolving rapidly as California mandates 11.5 GW of new storage by 2026. ERCOT operates without a formal capacity market, making Texas storage projects more dependent on energy arbitrage and ancillary services.
The interconnection queue is the policy failure that most directly threatens project timelines. LBNL data shows the average wait time for interconnection approval in the US reached 5 years in 2023, up from under 2 years in 2015. Over 1,700 GW of generation and storage projects sat in interconnection queues as of 2023 — more than the entire installed US generation fleet. FERC Order 2023 (issued 2023) mandates queue reform, but implementation will take years.
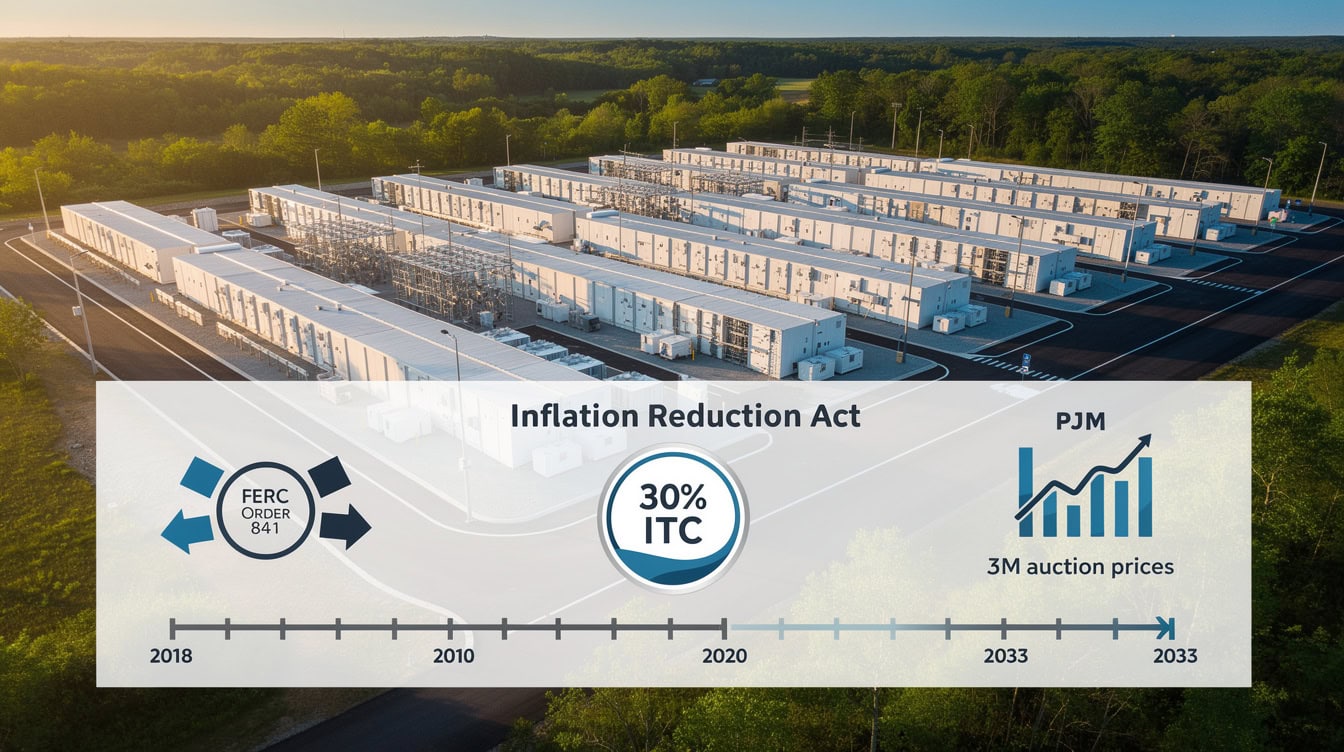
The 30% ITC alone can shift a marginal battery project from 8% to 12%+ levered IRR when structured through tax equity.
The Honest Counterargument: When Batteries Are NOT the Answer
Batteries are not the universal solution to grid decarbonization, and project developers who model them as such will face unpleasant surprises.
Round-trip efficiency losses are real and permanent. A lithium-ion system with 90% round-trip efficiency loses 10% of every MWh it stores. At scale, this means a grid relying heavily on storage requires 10–15% more generation capacity than a grid with dispatchable generation — a cost that must appear in system-level economic models.
Degradation is the variable that most often breaks battery project pro formas. Lithium-ion cells lose capacity over time: a typical LFP system retains approximately 80% of original capacity after 3,000 cycles (roughly 8–10 years of daily cycling). That degradation curve must be modeled explicitly — assuming flat capacity over a 20-year project life is a material error that overstates revenue in years 10–20.
Thermal runaway — the chemical chain reaction that causes lithium-ion batteries to catch fire — remains a genuine safety and insurance risk. Several large grid-scale battery fires (including the 2021 Moss Landing incident in California) have raised insurance premiums and prompted stricter fire suppression requirements that add $5–$15/kWh to project costs. The US Fire Administration has documented that lithium-ion battery fires present unique suppression challenges requiring large volumes of water — up to 3,000 gallons per battery module in some incidents.
For long-duration storage (12+ hours), pumped hydro remains cheaper than batteries at $50–$150/MWh LCOS where suitable geography exists. Green hydrogen, despite its current cost disadvantage, may prove superior for seasonal storage applications where batteries cannot economically scale. Project developers should model all three options before defaulting to lithium-ion.
LFP batteries retain roughly 80% capacity after 3,000 cycles; augmentation at years 10 and 15 restores revenue capacity but adds $30–60/kWh to project costs.
Financial Modeling Requirements for Battery Storage Investments
A credible battery storage financial model requires more granularity than a standard renewable energy model. Seven assumptions drive the majority of NPV sensitivity.
- LCOS inputs: Capital cost ($/kWh installed), augmentation schedule (battery replacement to maintain capacity), O&M costs, and financing structure.
- Degradation curve: Capacity retention by year, modeled as a function of cycle count and calendar aging. Use manufacturer warranty data as a floor, not a ceiling.
- Revenue stack: Separate projections for energy arbitrage, capacity payments, and ancillary services — each with different price escalation assumptions and contract structures.
- Dispatch optimization: Cycle count assumptions must be consistent with revenue assumptions. A model that assumes 365 full cycles per year for arbitrage AND 365 cycles for frequency regulation is double-counting.
- Round-trip efficiency: Apply efficiency losses to both revenue (less energy discharged) and cost (more energy purchased for charging).
- Policy sensitivity: Model ITC scenarios (30% base, 40% with domestic content adder, 0% if policy changes) as explicit switches.
- Interconnection and permitting timeline: Model construction start dates conservatively — assume 4–6 years from site control to commercial operation for greenfield projects in congested queues.
For developers building these models, the EFM Renewable Energy financial model templates provide pre-built frameworks for LCOS calculation, revenue stack modeling, and IRR/NPV sensitivity analysis. The Solar Energy Financial Model includes solar-plus-storage configuration options with degradation curves and policy incentive toggles.
Seven model inputs drive the majority of battery storage project NPV — price spread and capital cost sensitivity should always appear as a two-way table.
What This Means for Your Next Energy Project
Battery storage has crossed the threshold from optional enhancement to essential infrastructure for most new renewable energy projects. The economics are real, the policy support is substantial, and the technology is proven at scale. But the risks — supply chain volatility, degradation, interconnection delays, and round-trip efficiency losses — are equally real and must be modeled explicitly rather than assumed away.
The developers who will build successful battery storage projects are those who treat storage as a financial engineering problem as much as a technology problem: structuring revenue stacks carefully, stress-testing degradation assumptions, locking in procurement early, and building interconnection timelines into their capital planning from day one.
The Renewable Energy Template Bundle from EFM covers the full project finance stack for storage-paired renewable projects, including sensitivity tables for LCOS, degradation scenarios, and policy incentive modeling.
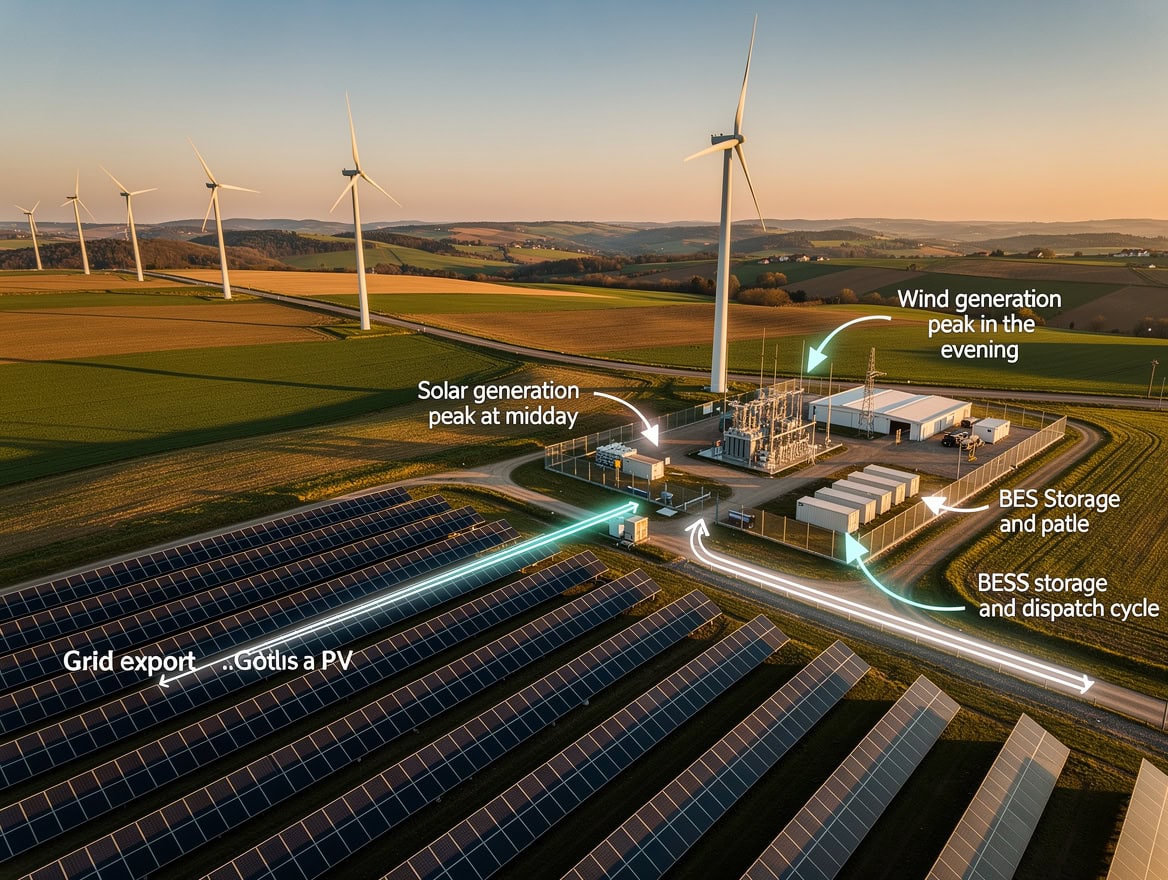
A fully decarbonized grid will require batteries for daily cycling, pumped hydro for weekly storage, and hydrogen for seasonal balancing — no single technology wins alone.
Frequently Asked Questions
What is LCOS and why does it matter more than battery purchase price?
LCOS stands for levelized cost of storage — the total lifetime cost of a battery system divided by the total energy it delivers over its operating life, expressed in dollars per MWh. It matters more than purchase price because it captures all the costs that determine whether a project is profitable: capital cost, augmentation (replacing degraded cells), operations and maintenance, financing costs, and round-trip efficiency losses. A battery with a lower purchase price but faster degradation can have a higher LCOS than a more expensive system with better longevity. For a 100 MWh system at $200/kWh installed cost, 90% round-trip efficiency, 20-year life, and 2% annual O&M, the LCOS calculation would yield approximately $180–$220/MWh depending on the discount rate applied — a figure that must be below the achievable revenue stack for the project to be viable.
How does the 30% ITC under the Inflation Reduction Act apply to standalone battery storage?
The Inflation Reduction Act, signed in August 2022, extended the 30% Investment Tax Credit to standalone battery storage systems for the first time — previously, storage only qualified for the ITC if charged at least 75% from co-located solar. For a $60 million standalone battery project, the 30% ITC generates $18 million in tax credit value. Projects using domestic content (US-manufactured cells and modules) can qualify for a 10-percentage-point adder, bringing the credit to 40%. Tax equity investors — typically large banks and insurance companies — monetize these credits through partnership flip or sale-leaseback structures, effectively reducing the equity required from the project developer. The credit applies to projects beginning construction before January 1, 2033, under current law.
What revenue streams can a grid-scale battery storage project realistically earn?
A grid-scale battery project in a well-designed wholesale market can access three primary revenue streams. Energy arbitrage involves buying cheap off-peak power and selling during high-price periods — in markets like PJM or CAISO, price spreads of $20–$50/MWh are achievable on average, though they vary significantly by year and season. Capacity payments compensate storage for being available during peak demand periods; PJM capacity prices have ranged from $28 to $50 per MW-day in recent auctions. Ancillary services — particularly frequency regulation, where batteries respond in milliseconds to grid frequency deviations — can add $50,000–$300,000 per year for a 100 MW system. The total revenue stack for a well-sited 100 MW / 400 MWh project typically ranges from $4 million to $8 million annually before tax benefits, depending on market and dispatch strategy.
How serious is battery degradation for long-term project economics?
Degradation is one of the two or three most important variables in any battery storage financial model. Lithium iron phosphate (LFP) batteries — the dominant chemistry for grid-scale storage — typically retain approximately 80% of original capacity after 3,000 full charge-discharge cycles, which corresponds to roughly 8–10 years of daily cycling. After that point, capacity continues to decline, and most project models assume augmentation (adding new cells to restore capacity) at years 10 and 15 of a 20-year project life. Augmentation costs of $30–$60/kWh (in future dollars) must be included in the LCOS calculation. Models that assume flat capacity over 20 years overstate revenue by 15–25% in the back half of the project life — a material error that can flip a marginally positive NPV to negative.
Why is the interconnection queue such a significant risk for battery storage projects?
The interconnection queue is the administrative process by which new generation and storage projects apply for permission to connect to the transmission grid. Lawrence Berkeley National Laboratory data shows the average wait time reached 5 years in 2023, compared to under 2 years in 2015. Over 1,700 GW of projects were queued as of 2023 — more than the entire existing US generation fleet. For battery storage developers, this means that even a fully permitted, fully financed project may wait 4–6 years before it can operate commercially. This delay has two financial consequences: it increases the total capital deployed before revenue begins (raising effective project cost), and it creates uncertainty about the market conditions (prices, policy, competition) that will exist when the project finally comes online. Developers must model conservative interconnection timelines and include carrying costs for the queue period in their capital budgets.
When does pumped hydro or green hydrogen make more economic sense than batteries?
Pumped hydro — which stores energy by pumping water uphill and releasing it through turbines — has an LCOS of approximately $50–$150/MWh for suitable sites, lower than lithium-ion for long-duration applications. It makes more economic sense than batteries when the storage duration requirement exceeds 8–12 hours, suitable geography exists (elevation differential, water availability), and the project can absorb the longer development timeline (10–15 years for large pumped hydro versus 2–4 years for battery storage). Green hydrogen — producing hydrogen via electrolysis and storing it for later power generation — is currently more expensive than batteries for daily cycling but may prove superior for seasonal storage (weeks to months) where battery systems cannot economically scale. The honest answer is that a decarbonized grid will likely need all three technologies, with batteries dominating daily and weekly cycling, pumped hydro handling weekly to monthly storage where geography permits, and hydrogen addressing seasonal imbalances.
What financial model inputs have the highest sensitivity impact on battery storage project NPV?
Sensitivity analysis on battery storage projects consistently identifies five inputs as the highest-impact variables. First, the energy price spread (the difference between charge and discharge prices) drives arbitrage revenue and is the single largest NPV driver in merchant projects. A $10/MWh change in average spread can shift project NPV by 20–30%. Second, the capital cost per kWh installed directly determines LCOS and the ITC base. Third, the degradation curve and augmentation cost schedule affect revenue in years 10–20 disproportionately. Fourth, the discount rate (WACC — weighted average cost of capital, the blended cost of debt and equity financing) determines how heavily future cash flows are discounted; a 1-percentage-point change in WACC typically moves NPV by 8–15% for a 20-year project. Fifth, the ITC percentage (30% base versus 40% with domestic content adder) affects equity returns significantly. Any credible financial model should include a two-way sensitivity table showing NPV across combinations of price spread and capital cost, and a separate scenario analysis for ITC outcomes.
Conclusion
Battery storage is not a technology bet — it is the infrastructure layer that determines whether the renewable energy transition produces bankable projects or stranded assets. The economics are compelling when modeled correctly: LCOS below $200/MWh, a 30% ITC, and three-stream revenue stacks that can support project finance debt. The risks are real when modeled honestly: degradation curves, supply chain volatility, interconnection delays, and round-trip efficiency losses that compound over 20-year project lives.
I recommend downloading EFM’s Renewable Energy financial model templates to build your battery storage pro forma with explicit degradation modeling, revenue stack separation, and ITC sensitivity analysis — the tools that separate fundable projects from wishful thinking.
























































