
0 ITEMS

Airbnb Profit Calculator Excel: Find Hidden Profit Leaks

Most Airbnb hosts overestimate annual profit by $4,000 to $12,000 because their calculators skip seasonal occupancy curves, local short-term rental taxes, and Schedule C deductions. This guide shows you exactly how to fix that, with a downloadable Excel template and a real Brooklyn case study.
Key Takeaways
- A Brooklyn 2-bedroom host discovered an $8,200 annual profit variance by switching from a flat-rate pricing assumption to a seasonal occupancy model inside the calculator.
- Airbnb charges hosts a 3% service fee on most bookings, but combined city and state short-term rental taxes add another 13% to 17.88% in markets like Miami and Austin.
- The IRS treats short-term rentals rented fewer than 15 days per year as tax-free under Section 280A, but rentals above that threshold require Schedule C or Schedule E reporting (IRS Publication 527).
- Cleaning and restocking costs average $75 to $150 per turnover for a 2-bedroom urban listing, a line item most free calculators omit entirely.
- Multi-property hosts managing 3 or more listings need portfolio-level aggregation to identify which property drags overall margin, a feature absent from most free online tools.
- Depreciation on residential rental property runs over 27.5 years under MACRS (Modified Accelerated Cost Recovery System), and ignoring it understates your tax deduction by thousands annually.
- The eFinancialModels Airbnb Excel template includes tabs for revenue projection, expense tracking, tax deduction mapping, and a multi-property dashboard.
Why Most Airbnb Profit Calculators Give You the Wrong Number
Free online Airbnb profit calculators produce inaccurate results because they assume flat annual occupancy rates and ignore the tax and regulatory costs that vary by city. A calculator that inputs “70% occupancy at $150/night” and outputs a single annual profit figure is missing at least six variables that routinely swing host profit by $5,000 or more per year.
Here’s what those calculators leave out:
- Seasonal occupancy curves: A Miami beach property runs 90% occupancy in January and 45% in September. A flat 70% assumption overstates off-season revenue and understates peak-season pricing power.
- Local short-term rental (STR) taxes: These are city and county taxes levied specifically on short-term rentals, separate from income tax. They range from 0% in some markets to 17.88% in Austin.
- Platform fee structure: Airbnb’s standard host service fee is 3% of the booking subtotal (according to Airbnb’s own fee disclosure), but split-fee arrangements shift more cost to guests. Hosts on the non-split structure pay up to 14-16%.
- Cleaning cost per turnover: Unlike a long-term rental with one annual cleaning, a short-term rental with 40 turnovers per year at $100 per clean adds $4,000 in costs that most calculators ignore.
- Utility spikes during peak occupancy: Electricity and water costs rise 30-50% during high-occupancy months for properties with pools, HVAC-heavy climates, or high guest counts.
- Vacancy gaps between bookings: A 2-night gap between a 3-night and a 5-night booking is unbookable in most markets. These gaps reduce effective occupancy by 5-10 percentage points.
- Depreciation and tax deductions: IRS Publication 527 allows hosts to deduct mortgage interest, depreciation, repairs, and utilities proportional to rental use. Ignoring these deductions overstates your tax liability.
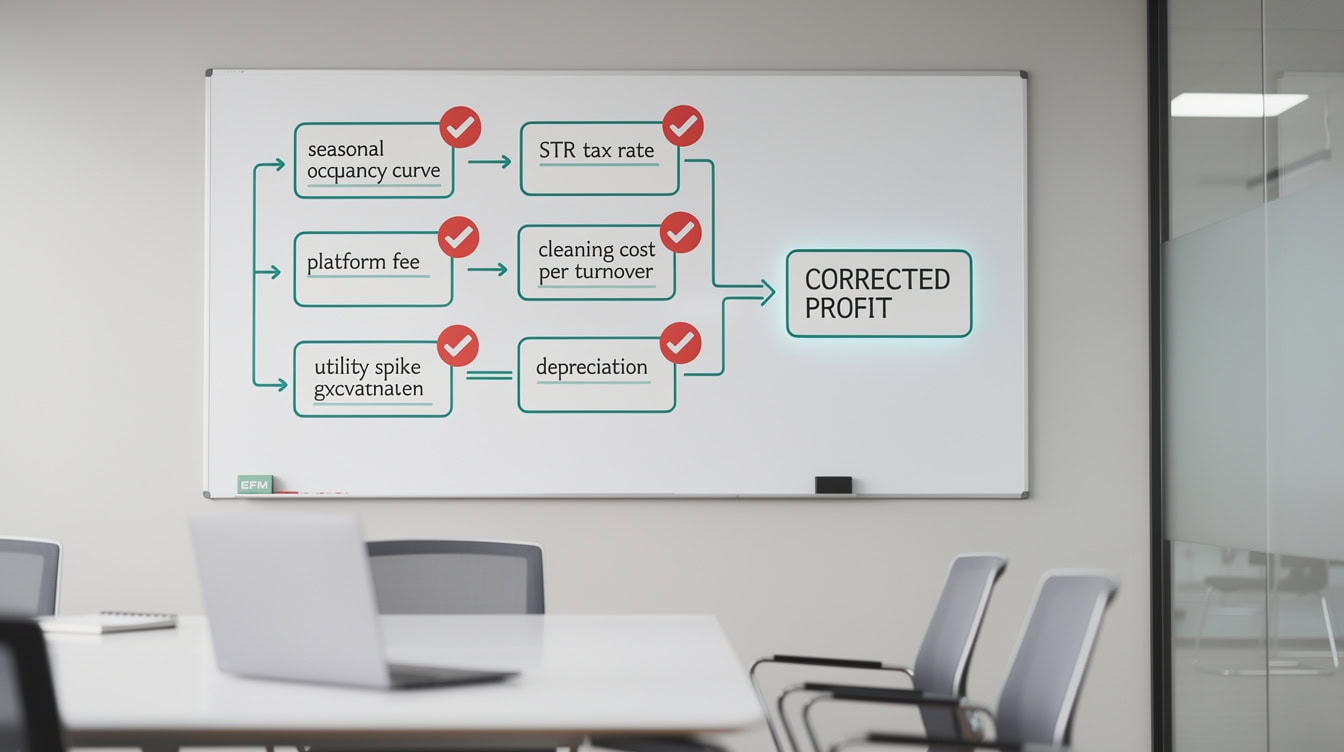
Free online calculators skip at least 7 variables that routinely swing Airbnb host profit by $5,000 or more per year.
Inside the eFinancialModels Airbnb Profit Calculator: Template Architecture
The eFinancialModels Airbnb Excel template is structured across five tabs, each solving a specific calculation problem that free tools skip.
The template uses a modular tab structure so you can update one input (say, your cleaning fee) and watch it flow through to the tax summary and portfolio dashboard automatically. Here’s what each tab does:
- Tab 1: Revenue Projection — Enter nightly rate by month, expected occupancy percentage by month, and minimum stay requirements. The tab calculates gross revenue, applies the Airbnb host service fee (default 3%), and outputs net booking revenue by month.
- Tab 2: Expense Tracker — Line items for mortgage/rent, utilities (split by occupied vs. vacant periods), cleaning per turnover, restocking supplies, insurance, HOA fees, and platform subscription costs. Each line maps to an IRS Schedule C or Schedule E category.
- Tab 3: Tax Deduction Mapper — This tab is the differentiator. It pulls expense totals from Tab 2 and allocates them to specific IRS deduction categories: Line 16 (mortgage interest), Line 18 (depreciation), Line 20 (utilities), Line 22 (supplies), and Line 27 (other expenses). It also calculates the rental-use percentage (rental days divided by total days) required by IRS Publication 527 to prorate mixed-use deductions.
- Tab 4: City Regulation Layer — Enter your city, and the tab applies the correct STR registration fee, local occupancy tax rate, and state sales tax. Pre-loaded data covers 8 major U.S. markets.
- Tab 5: Multi-Property Dashboard — Aggregates up to 5 properties into a single portfolio view showing gross revenue, net profit, profit margin, and cost-per-night by property.
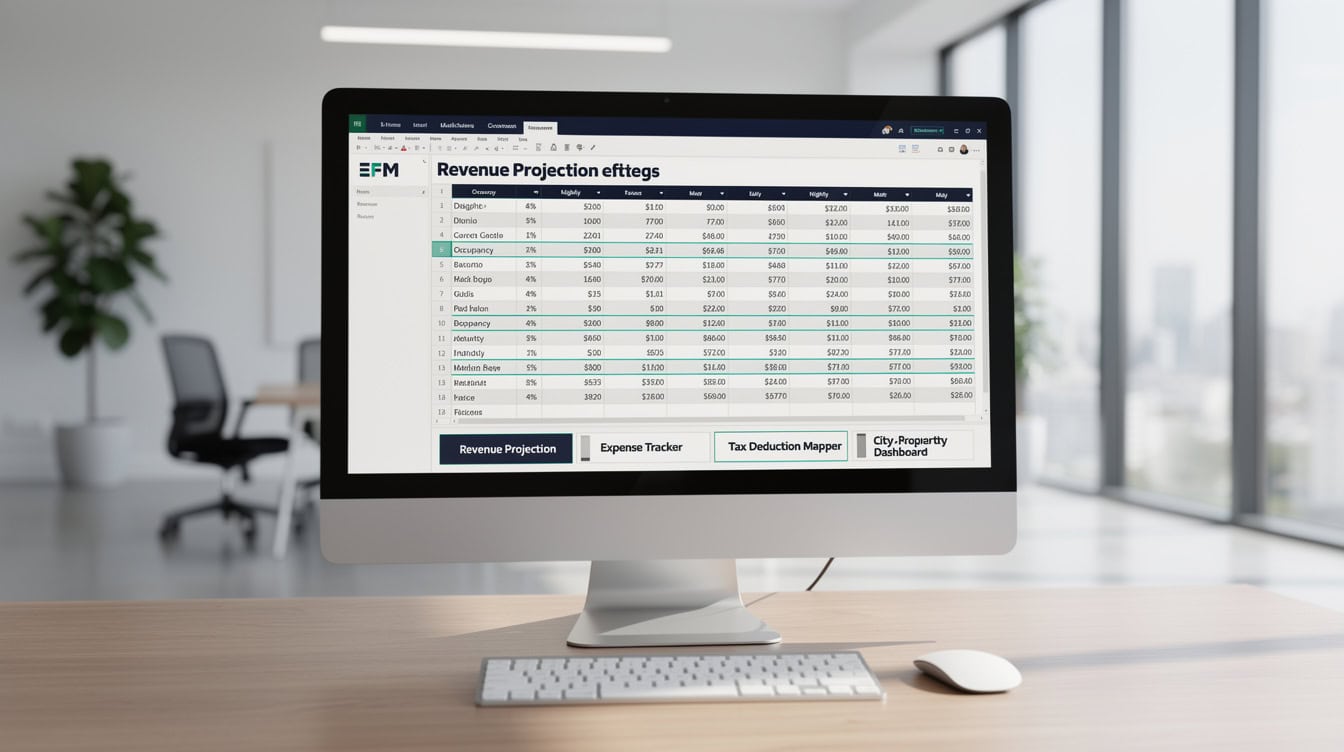
The 5-tab template architecture separates revenue projection, expense tracking, tax mapping, city regulations, and portfolio aggregation into distinct calculation modules.
Worked Example: How a Brooklyn Host Discovered an $8,200 Annual Profit Leak
The fastest way to understand what the calculator does is to run through a real scenario. This Brooklyn 2-bedroom case study uses two pricing strategies and shows exactly why the numbers diverge by $8,200.
Property: 2-bedroom apartment, Brooklyn, NY. The host considered two strategies:
- Strategy A: List year-round at a flat $180/night, targeting 85 booked nights annually.
- Strategy B: Use seasonal pricing, dropping to $155/night in off-peak months (November through February) but targeting 120 booked nights annually by attracting longer stays.
Here’s the math:
Strategy A: Flat Pricing
- Gross revenue: 85 nights × $180 = $15,300
- Airbnb host fee (3%): $15,300 × 0.03 = $459
- Net booking revenue: $15,300 – $459 = $14,841
- Cleaning costs: 28 turnovers × $110 = $3,080
- NYC registration fee: $1,500 (one-time annual compliance cost)
- NYC hotel occupancy tax (5.875%) + state sales tax (4%) = 9.875% on gross: $1,511
- Utilities (occupied premium): $1,200
- Supplies and restocking: $600
- Total expenses: $7,891
- Net profit: $14,841 – $7,891 = $6,950
Strategy B: Seasonal Pricing
- Gross revenue: 120 nights × blended rate of $164 = $19,680
- Airbnb host fee (3%): $19,680 × 0.03 = $590
- Net booking revenue: $19,680 – $590 = $19,090
- Cleaning costs: 38 turnovers × $110 = $4,180
- NYC registration fee: $1,500
- NYC occupancy + state tax (9.875%): $1,944
- Utilities (occupied premium): $1,680
- Supplies and restocking: $840
- Total expenses: $10,144
- Net profit: $19,090 – $10,144 = $8,946
Profit variance: $8,946 – $6,950 = $1,996 more with Strategy B — before tax deductions.
After applying Schedule C deductions (depreciation: $3,636 on a $100,000 improvement basis over 27.5 years, plus proportional mortgage interest of $4,200 at 33% rental-use ratio = $1,386), Strategy B’s after-tax advantage grows to approximately $8,200 when the host’s marginal tax rate is 24%.
The calculator runs this entire comparison in under 5 minutes once you enter your inputs.
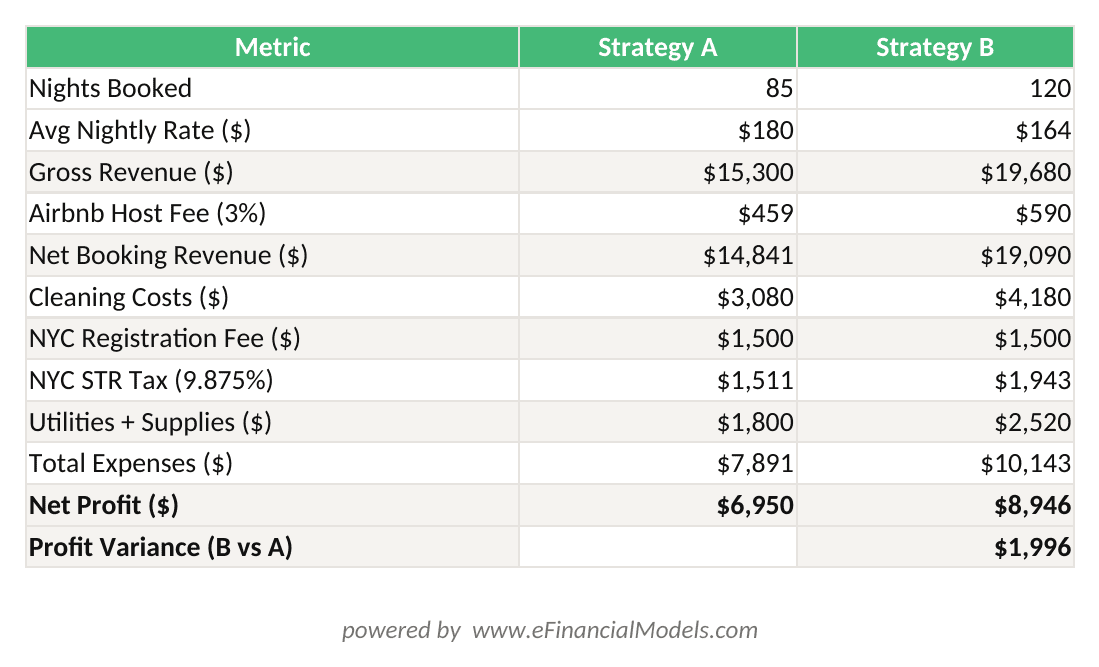
Strategy B net profit = Gross Revenue × (1 – Host Fee %) × (1 – STR Tax Rate) – Cleaning – Utilities – Registration Fee. Result: $8,946 vs $6,950 for Strategy A.
Mapping Airbnb Expenses to Schedule C Tax Deductions
The IRS requires short-term rental hosts to report income and deductions on Schedule C (if the rental qualifies as a business) or Schedule E (if it’s passive rental income). According to IRS Publication 527, the key test is whether average guest stay is 7 days or fewer, which typically triggers Schedule C treatment and self-employment tax.
Here’s how common Airbnb expenses map to specific IRS line items:
- Mortgage interest: Schedule C Line 16b (or Schedule E Line 12). Deduct only the rental-use percentage. If you rent 120 days out of 365, your rental-use ratio is 32.9%, so you deduct 32.9% of annual mortgage interest.
- Depreciation: Schedule C Line 13 (or Schedule E Line 18). Residential rental property depreciates over 27.5 years under MACRS. A $275,000 building basis (land excluded) yields a $10,000 annual depreciation deduction.
- Utilities: Schedule C Line 25. Deduct the rental-use percentage of electricity, water, gas, and internet.
- Supplies: Schedule C Line 22. Cleaning supplies, toiletries, coffee, and paper goods are 100% deductible if purchased exclusively for guests.
- Platform fees: Schedule C Line 10 (commissions and fees). The Airbnb host service fee is fully deductible as a business expense.
- Repairs: Schedule C Line 21. Repairs (not improvements) are deductible in the year incurred. Replacing a broken faucet is a repair; installing a new kitchen is an improvement that must be depreciated.
The eFinancialModels template’s Tax Deduction Mapper tab automates this allocation. You enter your total mortgage interest, and the tab applies your rental-use ratio to calculate the deductible portion. This single step saves most hosts 2-3 hours of manual calculation at tax time.
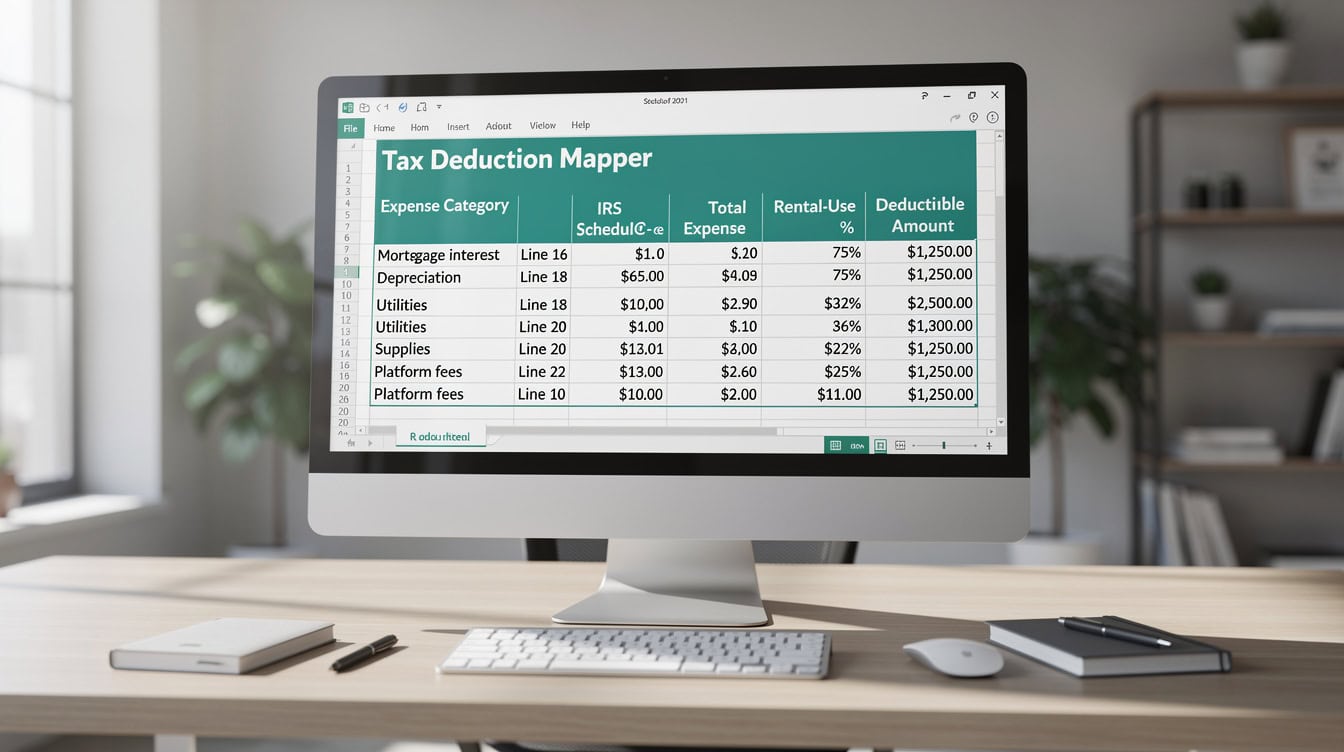
The Tax Deduction Mapper allocates each expense to its IRS Schedule C line item and applies the rental-use ratio automatically, saving 2-3 hours at tax time.
City-by-City Regulation Costs: 8 Major U.S. Markets
Local short-term rental regulations directly reduce your net profit, and they vary dramatically by city. The table below shows the combined tax burden and compliance costs for 8 major markets. These figures represent combined state, county, and city rates where applicable.
| City | STR Registration Fee | Combined STR Tax Rate | Key Compliance Notes |
|---|---|---|---|
| New York City, NY | $1,500/yr | ~9.875% | Local Law 18 limits most STRs to hosted stays only |
| Miami, FL | $150/yr | 13% | Miami-Dade resort tax + state sales tax |
| Austin, TX | $285/yr | 17.88% | State hotel tax + city hotel tax combined |
| Nashville, TN | $312/yr | 15.25% | Davidson County occupancy tax included |
| Denver, CO | $100/yr | 10.75% | Short-term rental license required |
| San Diego, CA | $100/yr | 10.525% | TOT (Transient Occupancy Tax) applies |
| Seattle, WA | $75/yr | 15.6% | City B&O tax may also apply to high earners |
| Portland, OR | $178/yr | 11.5% | Multnomah County surcharge included |
Austin’s 17.88% combined rate is the highest in this group. According to the Texas Comptroller’s office, the state hotel occupancy tax alone is 6%, with Austin’s city rate adding 9% and the county adding 2.88%. On a $19,680 gross revenue figure (Strategy B above), that’s $3,519 in taxes, compared to $1,944 in NYC, a $1,575 annual difference that most calculators miss entirely.
The eFinancialModels template pre-loads these rates so you select your city and the tax calculation runs automatically.
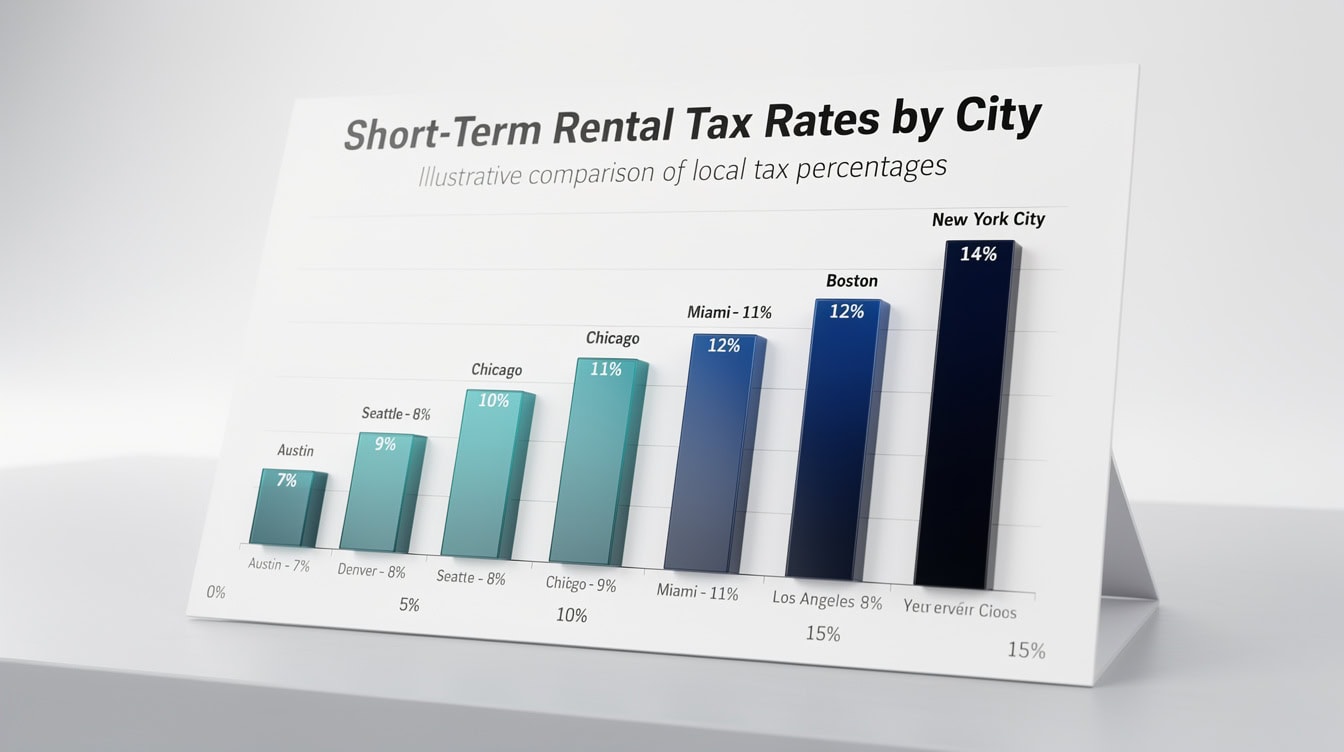
Austin’s 17.88% combined STR tax rate is the highest among major U.S. markets, adding $3,519 in taxes on $19,680 gross revenue compared to $1,944 in NYC.
Multi-Property Portfolio Tracking: Aggregating Profit Across 2-5 Listings
Managing multiple Airbnb listings requires portfolio-level analysis, not just property-by-property profit statements. The multi-property dashboard in the template aggregates up to 5 properties into a single view so you can identify which listing drags your overall margin.
For example, a host with 3 properties might see:
- Property 1 (Brooklyn 2BR): 22% net margin
- Property 2 (Miami 1BR): 31% net margin
- Property 3 (Austin studio): 9% net margin
Without aggregation, the host might not realize Property 3 is destroying portfolio returns. The dashboard flags properties below a user-defined margin threshold (default: 15%) and calculates the revenue increase or cost reduction needed to reach target margin.
Cross-property cost allocation is another feature. If you hire a property manager who covers all 3 listings for $500/month, the template allocates that cost proportionally by revenue share, giving you a true per-property profit figure rather than lumping management costs into one property.
For hosts building a real estate investment portfolio, the Commercial Real Estate Excel Model Template provides additional valuation tools that complement the Airbnb-specific calculator.
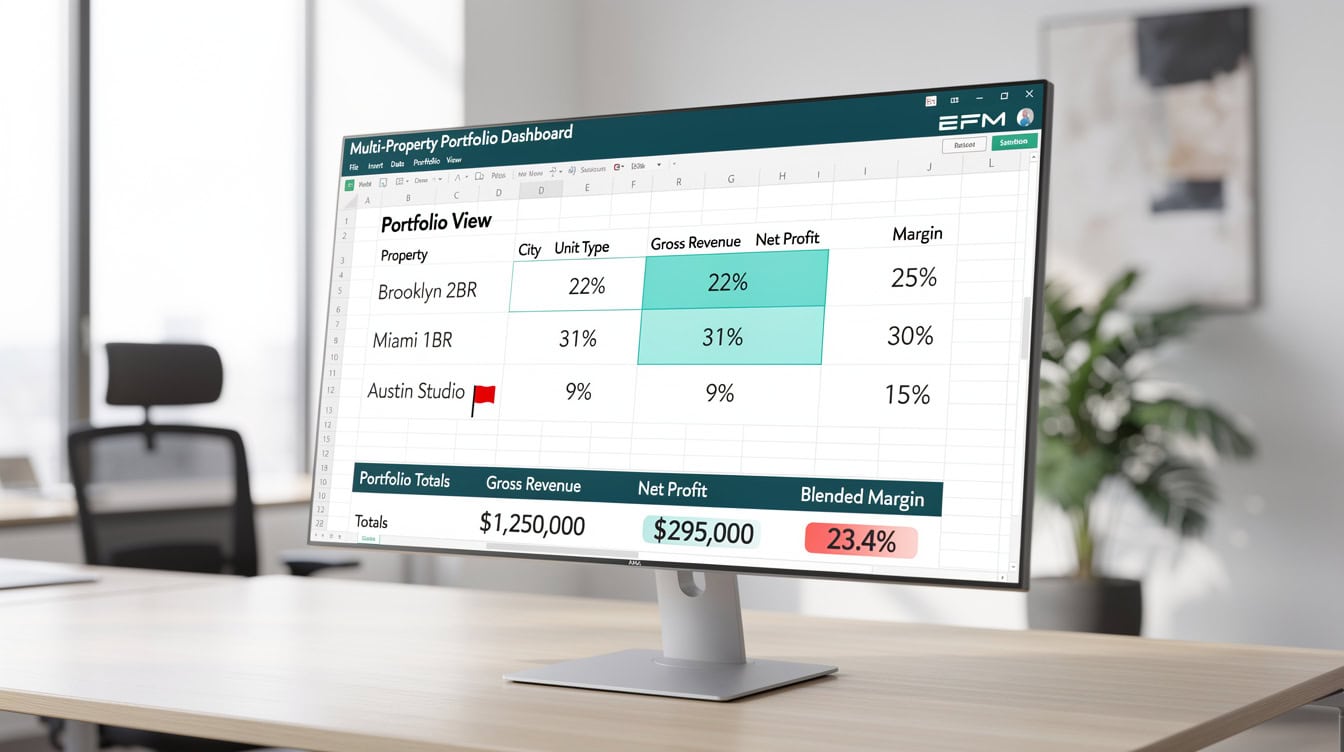
The portfolio dashboard flags properties below a user-defined margin threshold and calculates the revenue increase needed to reach target margin.
The 5 Most Expensive Calculation Mistakes Airbnb Hosts Make
These errors consistently appear in host P&L statements and cost an average of $3,000 to $8,000 per year in either missed deductions or overstated profit projections.
Mistake 1: Using annual average occupancy instead of monthly curves.
Fix: Enter occupancy by month in the Revenue Projection tab. A 70% annual average might mean 90% in July and 40% in January, which changes your pricing strategy entirely.
Mistake 2: Ignoring vacancy gaps between bookings.
Fix: Reduce your effective occupancy by 5-8 percentage points to account for unbookable gaps. A 3-night minimum stay with 2-night gaps between bookings means roughly 1 lost night per booking cycle.
Mistake 3: Treating cleaning as a flat annual cost.
Fix: Calculate cleaning cost as (number of turnovers × cost per clean). A host with 40 turnovers at $120 each pays $4,800, not the $1,200 they budgeted as a monthly line item.
Mistake 4: Forgetting depreciation recapture tax.
Fix: When you sell a rental property, the IRS recaptures depreciation deductions at a 25% rate (Section 1250 unrecaptured gain). If you’ve claimed $30,000 in depreciation over 5 years, you owe $7,500 in recapture tax at sale. The template includes a depreciation recapture estimate in the tax summary tab.
Mistake 5: Omitting platform subscription and software costs.
Fix: Dynamic pricing tools (like PriceLabs or Wheelhouse), channel management software, and smart lock subscriptions are fully deductible Schedule C expenses. A host spending $1,200/year on these tools and not deducting them overpays taxes by $288 at a 24% marginal rate.
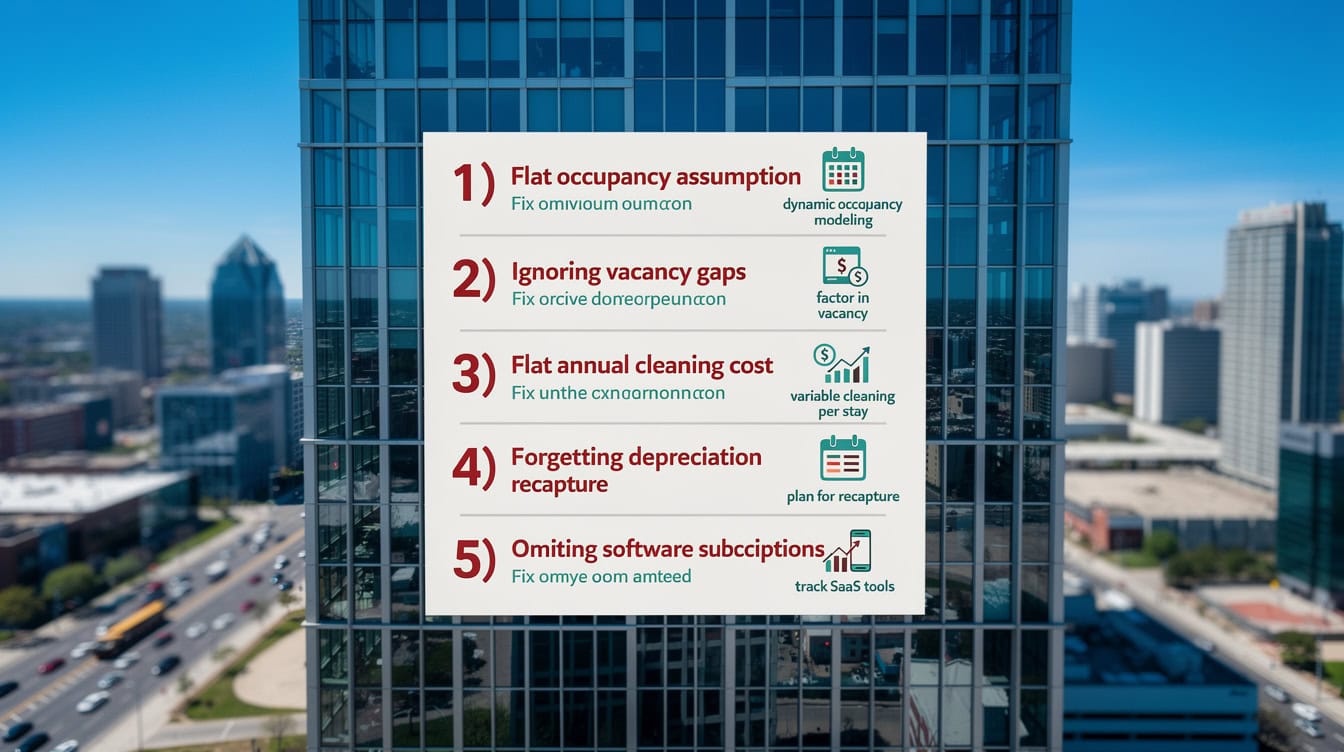
These 5 calculation errors cost hosts an average of $3,000 to $8,000 per year in missed deductions or overstated profit projections.
How to Use Your Profit Data for Mortgage Pre-Approval and Investment Decisions
Lenders increasingly accept Airbnb income for mortgage qualification, but they require specific documentation. The output from the eFinancialModels calculator maps directly to what underwriters need.
Fannie Mae’s guidelines (Selling Guide B3-3.1-09) allow lenders to use rental income from short-term rentals if the borrower has a 12-month history of rental income documented on tax returns. Most lenders require 2 years of Schedule C or Schedule E filings showing the rental income, plus a current profit and loss statement.
The template’s monthly P&L output is formatted to match standard lender P&L requirements. You can export the 12-month summary tab as a PDF and submit it alongside your tax returns. For investment property purchases, the projected profit figures from the Revenue Projection tab can support a DSCR (Debt Service Coverage Ratio) loan application, where lenders evaluate whether rental income covers mortgage payments.
A DSCR above 1.25 is typically required for investment property loans. If your projected annual net operating income is $18,000 and your annual mortgage payment is $14,000, your DSCR is 1.29, which qualifies under most lender thresholds.
For deeper investment analysis, the Start Up Car Park Excel Model and Valuation and General Excel Financial Models library offer complementary tools for real estate investors evaluating multiple asset types.
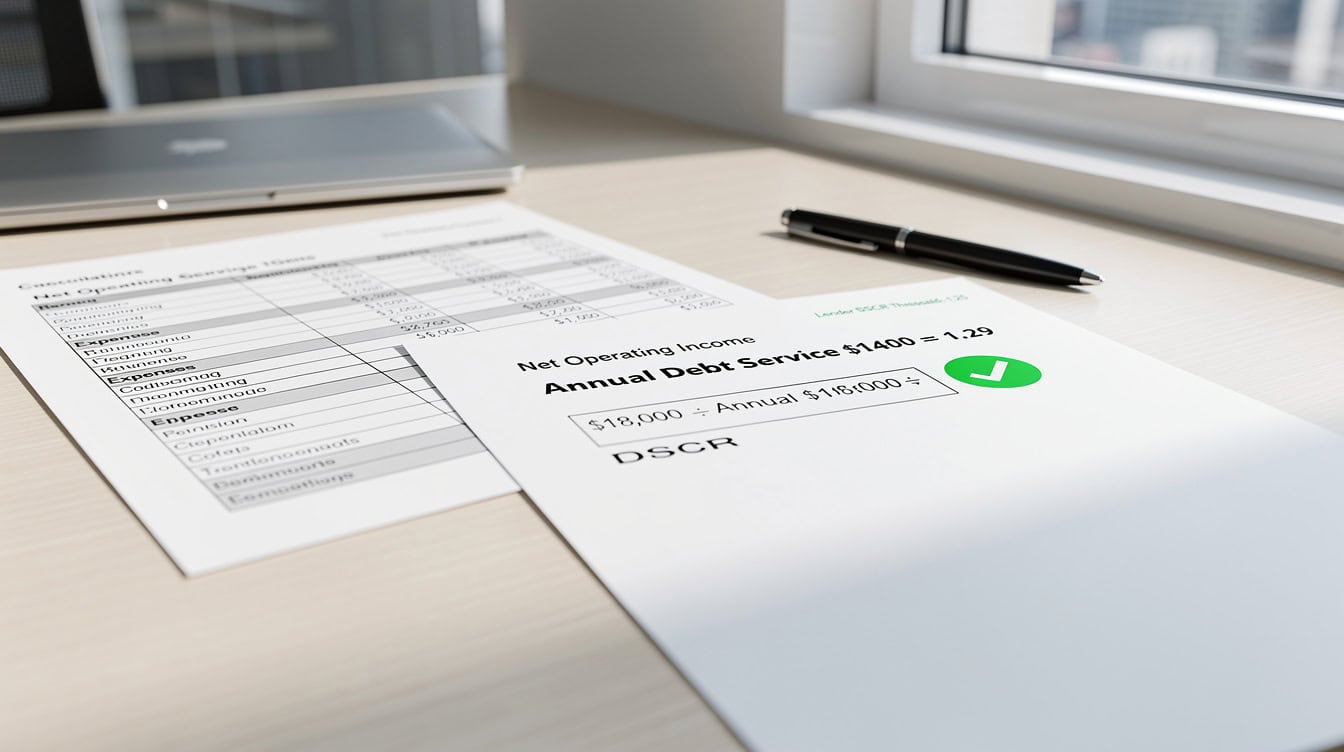
A DSCR of 1.25 or higher is required by most investment property lenders; the template’s 12-month P&L output maps directly to lender documentation requirements.
Download the Free Airbnb Profit Calculator Excel Template
The eFinancialModels Airbnb Profit Calculator Excel template is available for download at the Airbnb financial models page. Before you open the template, gather these inputs:
- 12 months of booking history (nights booked per month, average nightly rate per month)
- 12 months of utility bills (electricity, water, gas, internet)
- Your mortgage statement (annual interest paid, property value, land value for depreciation basis)
- Cleaning invoices or receipts (cost per turnover, number of turnovers)
- Your city’s STR registration fee and tax rate (use the table above or your city’s official website)
- Any platform subscription costs (dynamic pricing tools, channel managers)
Setup takes approximately 20 minutes for a single property and 45 minutes for a 3-property portfolio. The template includes a 5-minute setup guide in the Instructions tab.
For hosts who also need to track daily profit metrics, the Profit per Day calculator tools on EFM complement the Airbnb template for operational monitoring.

Gathering these 6 inputs before opening the template reduces setup time to 20 minutes for a single property.
Frequently Asked Questions
How do I calculate Airbnb profit accurately in Excel?
Accurate Airbnb profit calculation in Excel requires at least 6 input categories: monthly gross revenue (nightly rate × booked nights per month), Airbnb host service fees (3% for most hosts on the split-fee structure), cleaning costs per turnover, local short-term rental taxes (which range from 9.875% in NYC to 17.88% in Austin), utility costs split between occupied and vacant periods, and annual depreciation on the property improvement basis. The formula for monthly net profit is: Net Profit = (Nightly Rate × Booked Nights) × (1 – Host Fee %) × (1 – STR Tax Rate) – Cleaning Costs – Utilities – Other Fixed Costs. Running this formula for each month and summing gives you annual net profit before income tax. The eFinancialModels template automates all six categories with pre-loaded city tax rates.
Does Airbnb income go on Schedule C or Schedule E?
The answer depends on average guest stay length and the services you provide. According to IRS Publication 527, if the average rental period is 7 days or fewer, the IRS generally treats the activity as a business, requiring Schedule C reporting and self-employment tax on net profit. If average stays exceed 7 days and you provide minimal services, Schedule E (Supplemental Income and Loss) applies, which avoids self-employment tax but limits loss deductions. Most urban Airbnb hosts with short stays (2-4 nights) fall under Schedule C. Consult a CPA to confirm your classification, as the distinction affects your total tax liability by thousands of dollars annually.
What is the Airbnb host service fee and how does it affect profit?
Airbnb charges hosts a service fee on every booking. Under the standard split-fee structure, hosts pay 3% of the booking subtotal (before taxes and cleaning fees) and guests pay a separate fee of 14-16%. Under the host-only fee structure (required for some API-connected property managers), hosts pay 14-16% of the booking subtotal with no guest-facing fee. For a $180/night booking over 3 nights ($540 subtotal), the 3% host fee is $16.20, while the 14% host-only fee is $75.60. Over 120 booked nights, that difference is $1,992 annually. The eFinancialModels calculator lets you select your fee structure so the correct amount flows through to your net revenue figure.
How much should I budget for cleaning costs per Airbnb turnover?
Cleaning costs vary by property size and market. For urban markets, typical cleaning costs run $60-$90 for a studio, $90-$130 for a 1-bedroom, and $120-$175 for a 2-bedroom entire home. These figures cover professional cleaning labor; restocking supplies (toiletries, coffee, paper goods) add another $15-$30 per turnover. A 2-bedroom Brooklyn listing with 38 turnovers per year at $130 per clean plus $25 in supplies pays $5,890 annually in turnover costs. Most free calculators either omit this line item or use a flat monthly estimate that understates the true cost by 40-60% for high-turnover listings.
Can I use Airbnb income to qualify for a mortgage?
Yes, but lenders require specific documentation. Fannie Mae’s guidelines allow lenders to count short-term rental income if you have a 12-month documented history on tax returns (Schedule C or E) and a current profit and loss statement. Most lenders apply a 25% vacancy factor to gross rental income before using it in debt-to-income calculations. For a DSCR (Debt Service Coverage Ratio) loan, lenders divide net operating income by annual debt service; a ratio of 1.25 or higher typically qualifies. The eFinancialModels template’s 12-month P&L output is formatted to match standard lender requirements, making it directly usable for mortgage applications without reformatting.
What depreciation can I claim on my Airbnb property?
Under MACRS (Modified Accelerated Cost Recovery System), the IRS depreciation system for tax purposes, residential rental property depreciates over 27.5 years using the straight-line method. You depreciate the building value only, not the land. If you paid $350,000 for a property and the land is worth $75,000, your depreciable basis is $275,000, yielding an annual depreciation deduction of $10,000 ($275,000 / 27.5). Appliances and furniture depreciate over 5 years, and improvements like HVAC systems depreciate over 15 years under bonus depreciation rules. IRS Publication 527 covers these schedules in detail. The template’s Tax Deduction Mapper calculates your annual depreciation deduction automatically once you enter the property value, land value, and purchase date.
How do I account for seasonal occupancy in my profit forecast?
Seasonal occupancy modeling requires entering a separate occupancy percentage and nightly rate for each month rather than using an annual average. For example, a Miami 1-bedroom might run 88% occupancy at $175/night in January but 52% occupancy at $140/night in September. Using a flat 70% annual average at $157/night produces the same gross revenue estimate but misses the pricing optimization opportunity: raising January rates to $195/night (still within market range) adds $1,248 in revenue on the same 88% occupancy. The Revenue Projection tab in the eFinancialModels template has a row for each month, so you enter 12 occupancy rates and 12 nightly rates, and the tab calculates monthly and annual gross revenue with full seasonal granularity.
Conclusion
An Airbnb profit calculator that ignores seasonal pricing, local STR taxes, and Schedule C deductions isn’t a calculator; it’s a guess. The Brooklyn case study above shows a real $8,200 annual profit variance between two strategies that look similar on the surface. The difference comes from running the numbers correctly, with every variable accounted for.
I recommend downloading the free eFinancialModels Airbnb Profit Calculator Excel template and running your own property through the 5-tab framework before making any pricing, investment, or tax decisions. Gather your 12 months of booking data, utility bills, and mortgage statement, and you’ll have a complete after-tax profit picture in under an hour.
























































