
0 ITEMS

Airbnb Financial Model Template Excel: Host’s Guide
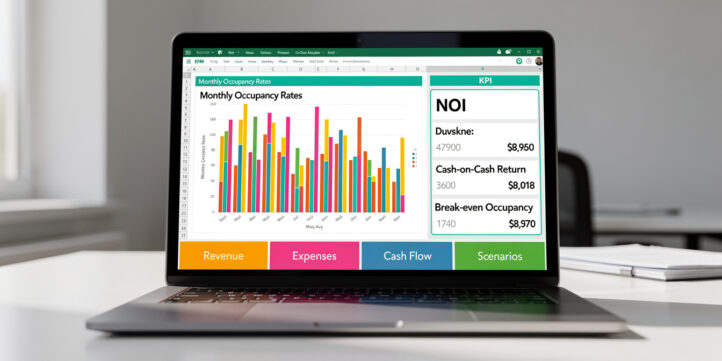
An Airbnb financial model template in Excel gives you a structured spreadsheet to project revenue, track expenses, and calculate returns before you commit a single dollar to a short-term rental property.
Key Takeaways
- A complete Airbnb Excel model must include at least 7 components: nightly rate inputs, occupancy projections, 12-month seasonality adjustments, operating expense categories, cash flow statements, ROI metrics, and scenario tabs.
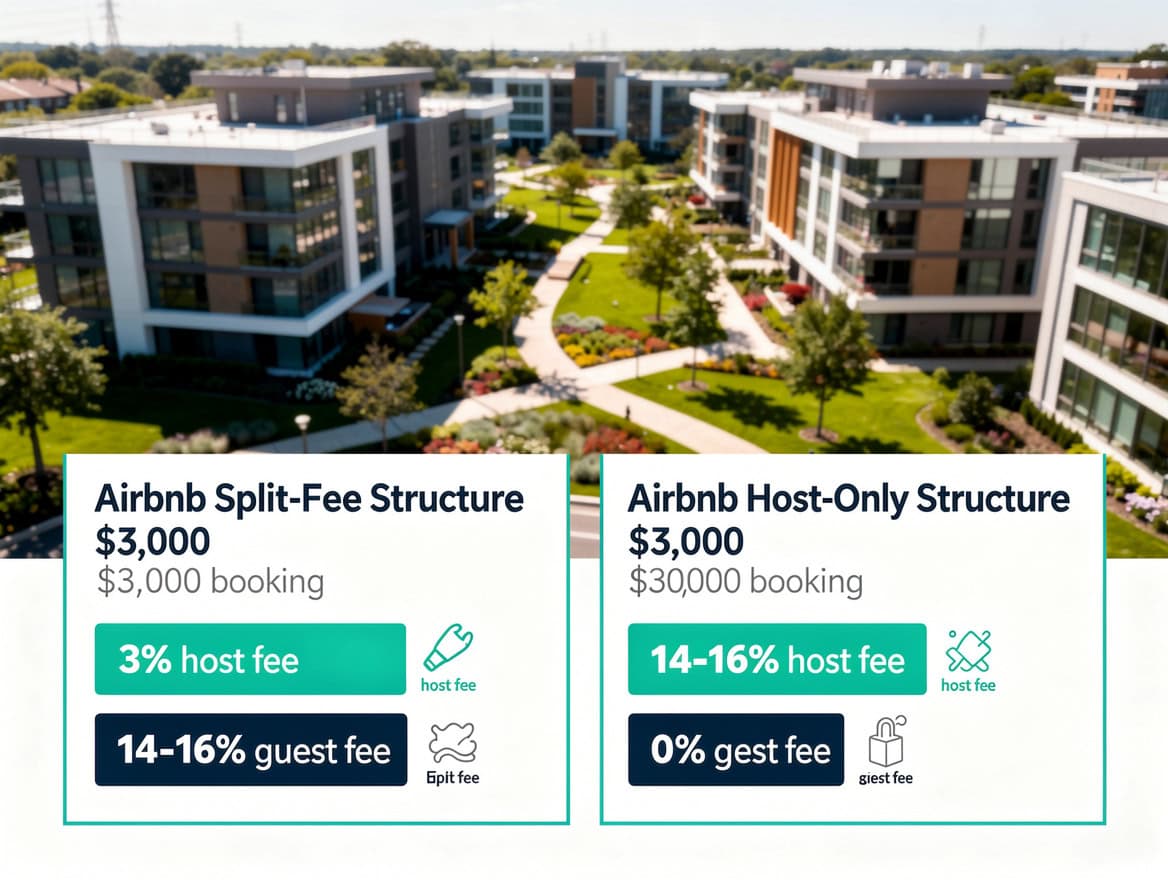
- Airbnb charges hosts a flat 3% service fee on most listings, while guests pay a variable fee typically between 14% and 16% of the booking subtotal, according to Airbnb’s published fee structure.
- Break-even occupancy for a typical short-term rental falls between 40% and 55%, depending on nightly rate and fixed costs — model this number before you buy.
- Short-term rentals in top-performing U.S. markets averaged a 56% occupancy rate in 2023, according to AirDNA market data, but suburban and rural properties often run 10 to 20 percentage points lower.
- Operating expenses typically consume 35% to 55% of gross Airbnb revenue when you include cleaning, supplies, platform fees, maintenance, insurance, and utilities.
- Scenario planning across 3 cases (best, base, worst) is the single most important step hosts skip — and the one that prevents the most costly mistakes.
- The eFinancialModels Airbnb Financial Model Template includes pre-built revenue projections, occupancy scenarios, expense schedules, and ROI dashboards ready to customize for any property.
What Is an Airbnb Financial Model Template?
An Airbnb financial model template is a pre-structured Excel workbook that organizes every number a host needs to evaluate, launch, and manage a short-term rental. It connects your property’s inputs — nightly rate, occupancy, expenses — to outputs like net operating income (NOI), cash-on-cash return, and break-even occupancy rate.
Think of it as a business plan in spreadsheet form. Instead of guessing whether a property will be profitable, you enter your specific numbers and the model calculates the answer. For hosts evaluating their first property or investors comparing multiple options, this structured approach replaces guesswork with data.
The eFinancialModels Airbnb Financial Model Template is purpose-built for short-term rental analysis, with tabs covering revenue, expenses, cash flow, and scenario planning — all formatted for Excel and ready to customize. Excel workbooks can contain up to 255 sheets (Excel specifications and limits), giving you ample room to build out every scenario and expense tab your model requires.
All 7 components must connect sequentially — a gap in any one produces inaccurate ROI outputs.
Key Components Every Airbnb Excel Model Must Include
A reliable Airbnb financial model needs 7 core components to give you accurate projections. Missing even one can produce results that look profitable on paper but fail in practice.
1. Revenue Inputs
Nightly rate, minimum stay requirements, and seasonal rate adjustments by month. Include both Airbnb and direct booking channels if applicable.
2. Occupancy Projections
Monthly occupancy rates (not a single annual average) that reflect local seasonality. A beach property in Maine runs 85% in July and 20% in January — a flat 52% annual average hides that volatility.
3. Gross Revenue Schedule
Nightly rate multiplied by occupied nights per month, summed across 12 months. This is your top-line revenue before any fees or expenses.
4. Operating Expense Categories
At minimum: cleaning fees, supplies and toiletries, platform fees, utilities, insurance, maintenance reserve, property taxes, and mortgage or rent (if applicable).
5. Net Operating Income (NOI) Calculation
NOI equals gross revenue minus all operating expenses, excluding debt service. This metric (explained further below) lets you compare properties regardless of how they’re financed.
6. Cash Flow Statement
NOI minus mortgage payments gives you monthly and annual cash flow — the actual money in your pocket after all bills are paid.
7. ROI and Break-Even Metrics
Cash-on-cash return, gross rental yield, and break-even occupancy rate, calculated automatically from your inputs.
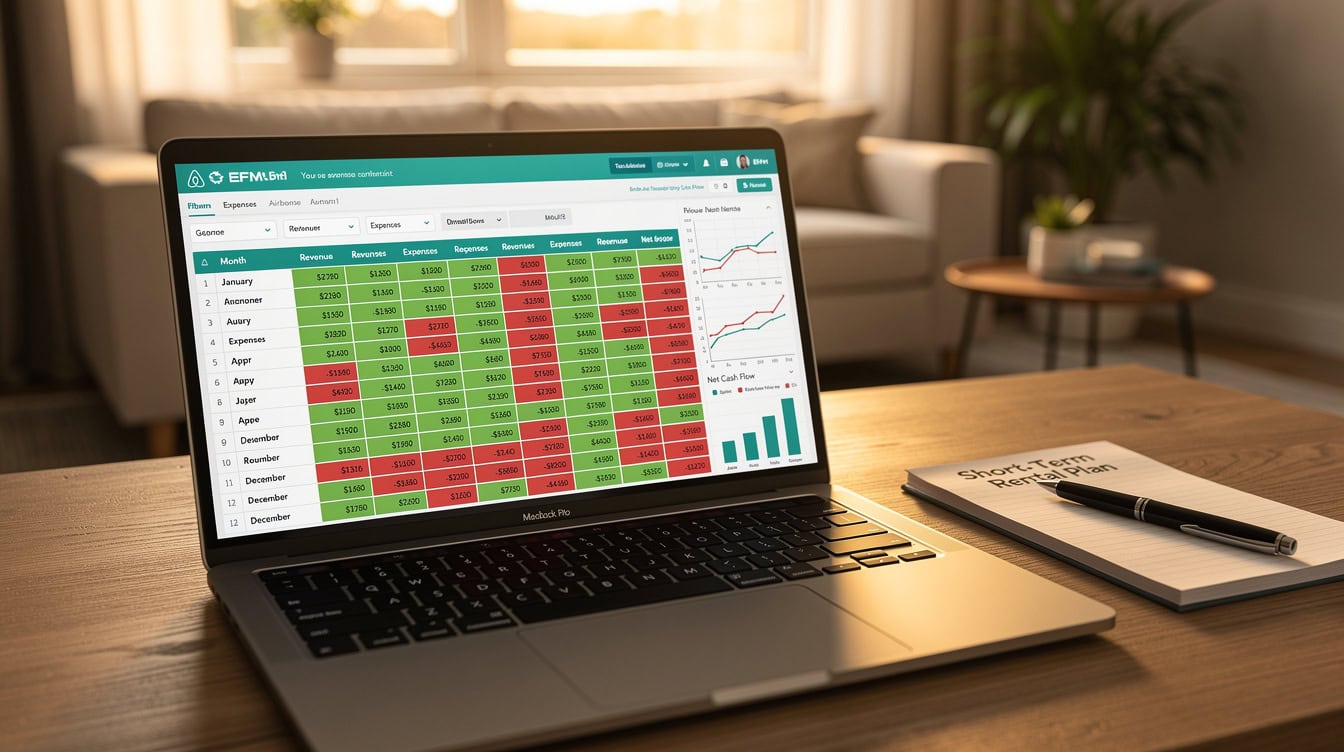
Seasonal occupancy swings of 40 to 65 percentage points are common — a flat annual average hides this volatility in your model.
How to Project Airbnb Revenue: Nightly Rates and Occupancy
Revenue projection starts with two variables: what you charge per night and how many nights you fill. Getting both right requires local market data, not national averages.
Setting Your Nightly Rate
Research comparable listings in your specific neighborhood using Airbnb’s search filters. Sort by similar bedroom count, amenities, and property type. Note the rates for the next 60 days across 10 to 15 comparable listings. Your base rate should sit within 10% of the median comparable rate when you’re starting out.
Airbnb’s own Smart Pricing tool adjusts rates dynamically, but most experienced hosts use third-party tools like PriceLabs or Wheelhouse for more granular control. For your financial model, build in seasonal rate multipliers: for example, 1.4x your base rate in peak season and 0.7x in the slowest month.
Projecting Occupancy Realistically
Short-term rental occupancy varies significantly by market type. Urban markets in major U.S. cities averaged 62% occupancy in 2023 according to AirDNA, while vacation destination markets averaged 56% and suburban markets averaged 48%. Do not use a single national average for your model.
Build a 12-month occupancy table in your Excel model. Assign a percentage to each month based on local seasonality data. Your annual effective occupancy is the average of those 12 monthly figures, weighted by days in each month. A single Excel worksheet can hold up to 1,048,576 rows and 16,384 columns (Excel specifications and limits), so you have more than enough space to build granular multi-year monthly tables without running into spreadsheet limits.
Here’s the math for monthly gross revenue:
Monthly Gross Revenue = Nightly Rate × Days in Month × Occupancy Rate
Example: $175 nightly rate × 30 days × 65% occupancy = $3,413 gross revenue for that month.
Complete Airbnb Operating Expense Breakdown
Operating expenses are where most new hosts underestimate costs — and where financial models earn their value. A well-built Airbnb Excel template separates expenses into fixed costs (same every month regardless of bookings) and variable costs (scale with occupancy).
Fixed Monthly Expenses
- Mortgage or rent payment
- Property taxes (monthly equivalent)
- Insurance (short-term rental policy, not standard homeowner’s)
- HOA fees (if applicable)
- Internet and cable
- Streaming subscriptions for guests
Variable Expenses (Scale with Bookings)
- Cleaning fees: Typically $50 to $150 per turnover depending on property size. If you hire a cleaner, this is your largest variable cost.
- Supplies and toiletries: Budget $5 to $15 per guest stay for consumables.
- Platform fees: Airbnb charges hosts a 3% service fee on the booking subtotal. VRBO charges hosts either a 5% commission plus a 3% payment processing fee, or an annual subscription of approximately $499.
- Maintenance reserve: Industry standard is 1% to 2% of property value annually, set aside monthly.
- Property management (if outsourced): Professional short-term rental managers charge 20% to 35% of gross revenue, according to the National Association of Residential Property Managers.
Total Expense Ratio
When you add all categories, total operating expenses for a self-managed Airbnb typically run 35% to 45% of gross revenue. Add property management and that ratio rises to 50% to 60%. Your Excel model should calculate this ratio automatically so you can see it change as you adjust inputs. To keep your expense formulas accurate and auditable, note that Excel’s IF function supports up to 64 nested levels (IF function), which is more than sufficient for even the most complex conditional expense logic you might build into your model.
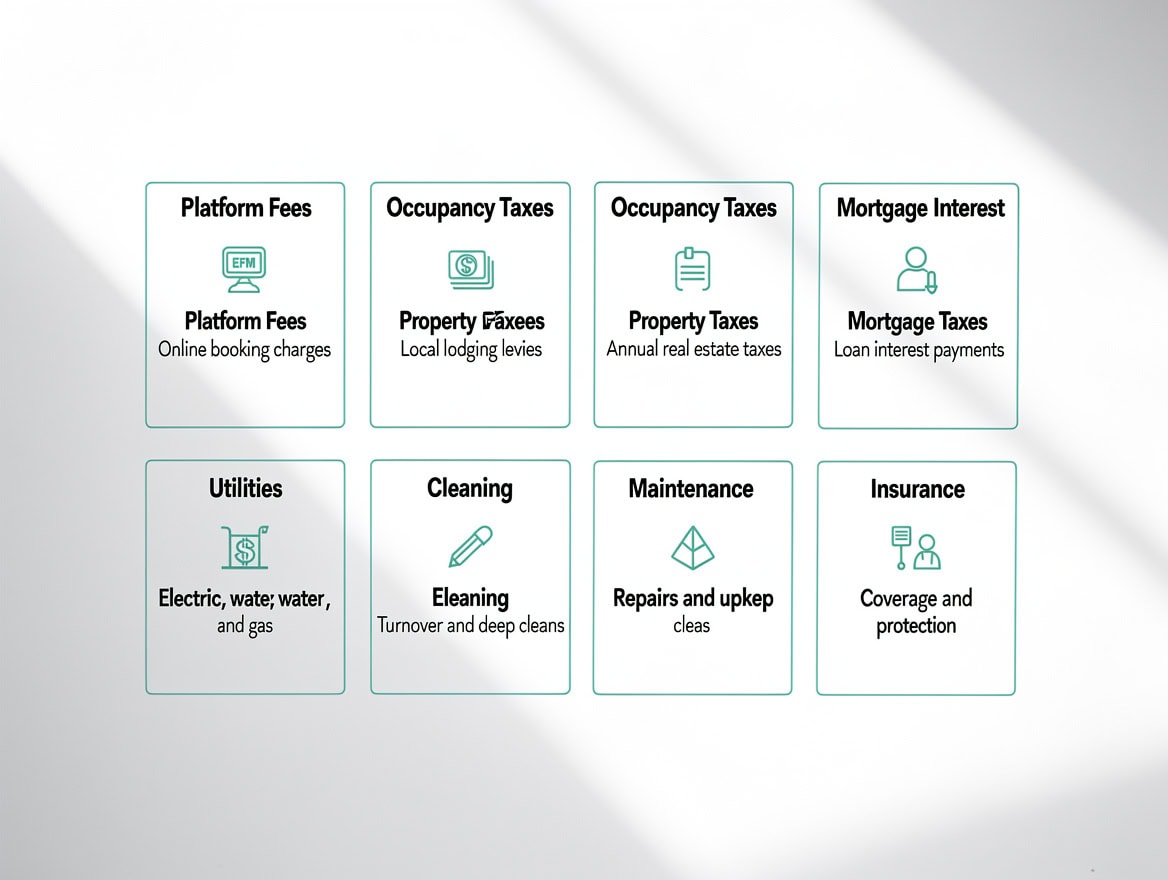
Self-managed Airbnb expenses typically consume 35% to 45% of gross revenue; adding property management pushes that to 50% to 60%.
Calculating Your Airbnb ROI: Essential Metrics Explained
Four metrics tell you whether an Airbnb investment is worth pursuing. Each one answers a different question, and your Excel model should calculate all four.
Gross Rental Yield
Gross rental yield measures annual revenue as a percentage of property purchase price. It ignores expenses, so it’s useful only for quick comparisons between properties.
Formula: Gross Rental Yield = (Annual Gross Revenue / Property Purchase Price) × 100
Net Operating Income (NOI)
NOI is annual gross revenue minus all operating expenses, before mortgage payments. It tells you how much the property earns as a business, independent of financing.
Formula: NOI = Annual Gross Revenue – Annual Operating Expenses
Cash-on-Cash Return
Cash-on-cash return (CoC) measures annual pre-tax cash flow as a percentage of total cash invested (down payment plus closing costs plus startup costs). This is the metric most Airbnb investors care about most.
Formula: CoC Return = (Annual Pre-Tax Cash Flow / Total Cash Invested) × 100
According to data from the National Association of Realtors, short-term rental investors in strong markets have historically targeted 8% to 12% cash-on-cash returns (National Association of Realtors), though actual results vary widely by market and property type.
Break-Even Occupancy Rate
Break-even occupancy is the minimum occupancy percentage needed to cover all expenses including mortgage. This is the most important number for risk assessment.
Formula: Break-Even Occupancy = Total Monthly Fixed Costs / (Nightly Rate × Days in Month)
Calculate all 4 metrics for every property you evaluate — each one answers a different question about financial viability.
Worked Example: Full Airbnb Financial Model Calculation
Here’s a complete worked example using a 2-bedroom property in a mid-tier vacation market.
Property Inputs:
- Purchase price: $350,000
- Down payment (20%): $70,000
- Closing costs: $7,000
- Startup costs (furniture, photography, supplies): $15,000
- Total cash invested: $92,000
- Mortgage payment (30-year, 7% rate on $280,000): $1,863/month
- Nightly rate: $175
- Annual average occupancy: 58%
Annual Revenue Calculation:
- Occupied nights: 365 × 58% = 212 nights
- Gross revenue: 212 × $175 = $37,100
Annual Operating Expenses:
- Cleaning (212 turnovers × $80 avg): $16,960
- Supplies ($10 × 212 stays): $2,120
- Airbnb platform fee (3% of $37,100): $1,113
- Insurance: $2,400
- Utilities: $3,600
- Maintenance reserve (1.5% of $350,000): $5,250
- Property taxes: $4,200
- Total Operating Expenses: $35,643
Key Metrics:
- NOI: $37,100 – $35,643 = $1,457
- Annual mortgage payments: $1,863 × 12 = $22,356
- Annual pre-tax cash flow: $1,457 – $22,356 = -$20,899
- Cash-on-cash return: -$20,899 / $92,000 = -22.7%
This example shows a property that looks attractive on gross revenue but produces negative cash flow at 58% occupancy. The model reveals you’d need either a higher nightly rate, lower purchase price, or significantly higher occupancy to make this work. That’s exactly what a financial model is for.
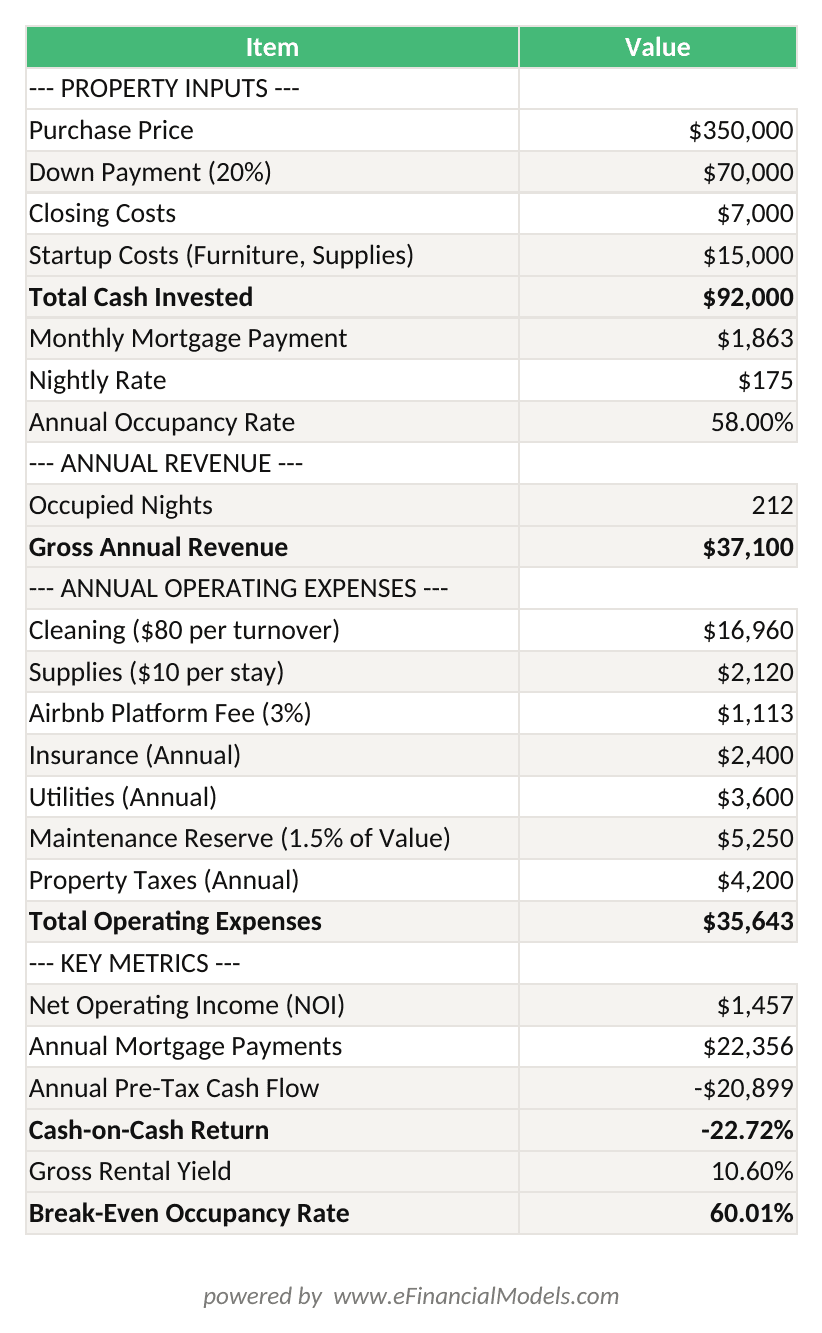
Airbnb financial model: $350,000 property at $175/night and 58% occupancy. NOI = $1,457; Annual Cash Flow = -$20,899; Cash-on-Cash Return = -22.7%. Adjust inputs to test your own property.
This worked example reveals that a $350,000 property at 58% occupancy and $175/night produces -22.7% cash-on-cash return — the model prevents a costly mistake.
Scenario Planning: Modeling Best-Case and Worst-Case Performance
Scenario planning means building 3 versions of your financial model: best case, base case, and worst case. This is the step most hosts skip, and it’s the one that prevents the most expensive mistakes.
In Excel, you can build a scenario tab that feeds different occupancy rates and nightly rates into your main model using a data table or Excel’s built-in Scenario Manager (found under Data > What-If Analysis > Scenario Manager).
| Scenario | Occupancy | Nightly Rate | Annual Revenue | Annual Cash Flow |
|---|---|---|---|---|
| Best Case | 72% | $195 | $51,246 | -$6,110 |
| Base Case | 58% | $175 | $37,100 | -$20,899 |
| Worst Case | 40% | $155 | $22,630 | -$35,369 |
The table above uses the same property from the worked example. Even the best case produces negative cash flow, which tells this investor to renegotiate the purchase price or walk away. Without scenario planning, a host might only see the base case and proceed with a losing investment.
For each scenario, also model a regulation risk case: what happens if your city caps short-term rentals at 90 days per year? Cities including New York, San Francisco, and Barcelona have imposed strict short-term rental limits that dramatically change financial viability. Build a 90-day cap scenario into your model if you’re buying in a regulated market.
Scenario planning across 3 cases reveals that even the best case for this property produces negative cash flow — a signal to renegotiate or walk away.
Common Airbnb Financial Modeling Mistakes to Avoid
These 5 mistakes appear in nearly every first-time host’s financial model. Each one makes a property look more profitable than it actually is.
Mistake 1: Using a Single Annual Occupancy Rate
Fix: Build a 12-month occupancy table. A flat 60% annual rate hides the months where you earn nothing and the months where you’re fully booked.
Mistake 2: Forgetting Vacancy Periods for Maintenance
Fix: Block out at least 10 to 15 days per year for deep cleaning, repairs, and restocking. These days produce zero revenue but still incur fixed costs.
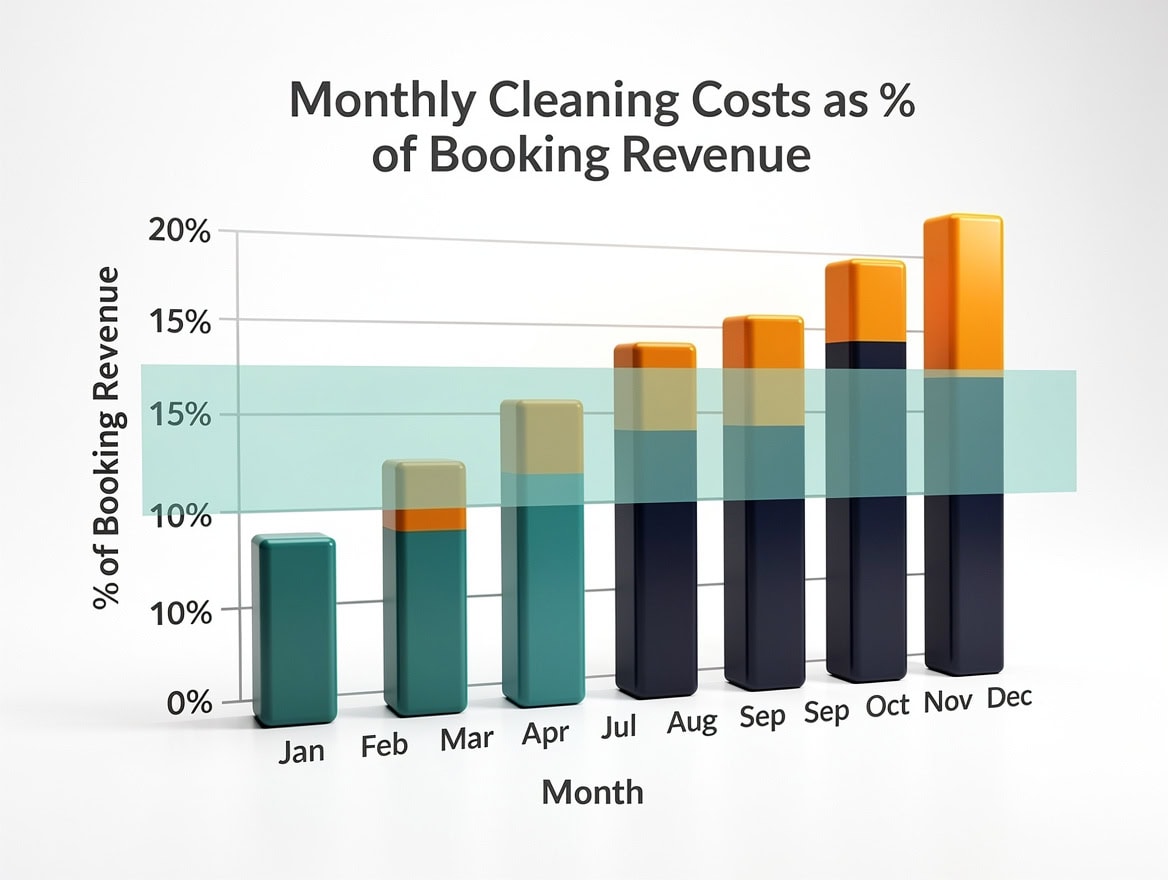
Mistake 3: Underestimating Cleaning Costs
Fix: Get actual quotes from local cleaning services before you model. Cleaning costs for a 3-bedroom property in a high-cost-of-living city can run $200 to $300 per turnover.
Mistake 4: Ignoring Startup Costs in ROI Calculations
Fix: Include furniture, photography, initial supplies, and any renovation costs in your total cash invested figure. The average startup cost to furnish and equip a 2-bedroom Airbnb runs $15,000 to $30,000 according to host community surveys.
Mistake 5: Modeling Airbnb Fees Incorrectly
Fix: Airbnb’s 3% host fee applies to the booking subtotal (nightly rate × nights), not including the cleaning fee you set. Model these separately in your expense schedule.
Each of these 5 mistakes makes a property appear more profitable than it is — fix them before you commit capital.
Using Your Model for Ongoing Pricing and Business Decisions
A financial model isn’t just a one-time evaluation tool. Once you’re live, it becomes your operating dashboard for 4 key decisions.
Pricing Adjustments: Update your nightly rate inputs monthly and compare projected vs. actual revenue. If actual occupancy exceeds your base case, test a 10% rate increase and model the impact on annual revenue.
When to Hire Property Management: Run your model with a 25% management fee added to expenses. If the property still cash-flows positively, management may be worth the cost. If it turns negative, you’re self-managing or selling.
Expansion Decisions: Use the same template structure for a second property. Compare the two properties’ cash-on-cash returns side by side to prioritize capital allocation.
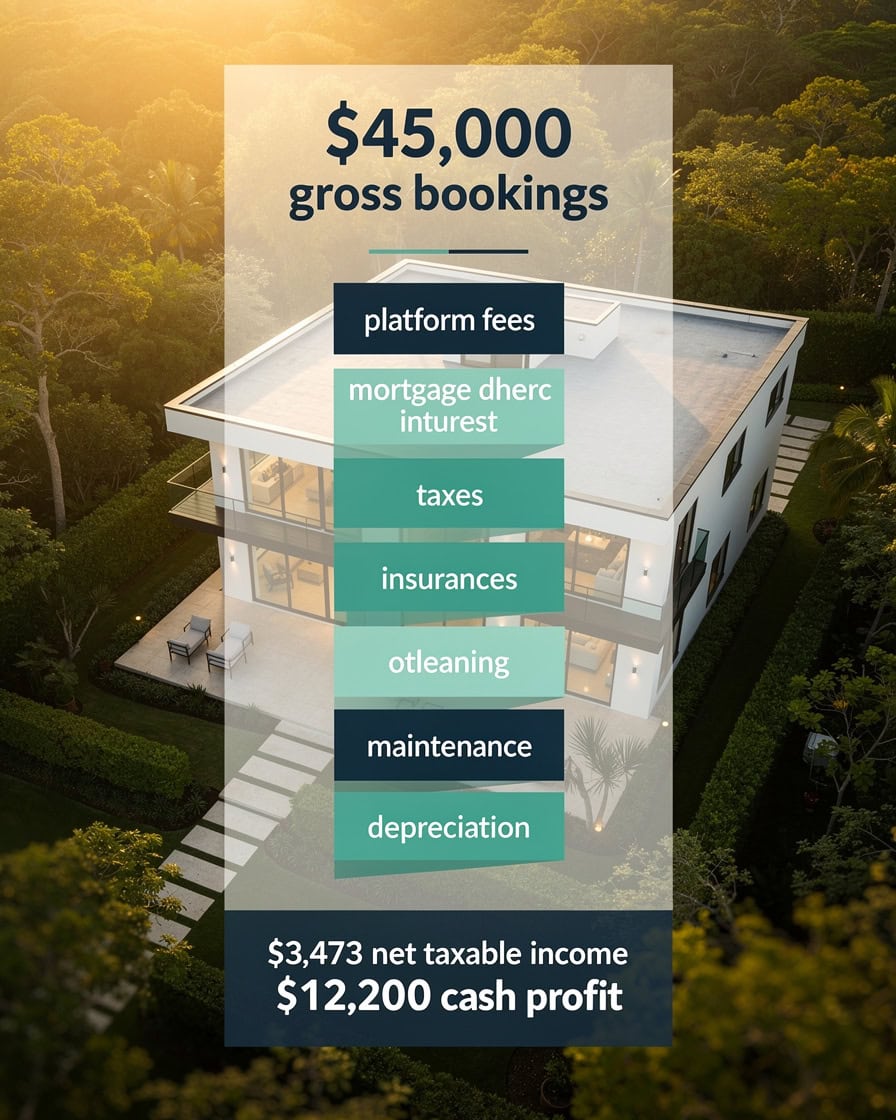
Tax Planning: Your model’s expense schedule feeds directly into Schedule E (for U.S. hosts) or equivalent tax forms. Keeping the model updated monthly makes tax preparation significantly faster.
For hosts managing multiple properties, the eFinancialModels Airbnb financial model templates include portfolio-level dashboards that aggregate metrics across properties. You can also explore startup financial model templates if you’re treating your Airbnb as a business from day one, or 5-year financial projections templates for longer-horizon investment analysis.
Update your Airbnb financial model monthly in year one — actual vs. projected variance data improves every future pricing and expansion decision.
Frequently Asked Questions About Airbnb Financial Models
What should an Airbnb financial model template in Excel include?
An Airbnb financial model template in Excel should include at minimum: a revenue projection tab with monthly nightly rates and occupancy inputs, a 12-month operating expense schedule broken into fixed and variable categories, a cash flow statement showing monthly and annual net cash flow, and a metrics dashboard calculating NOI, cash-on-cash return, gross rental yield, and break-even occupancy rate. The eFinancialModels Airbnb template includes all of these plus a 3-scenario planning tab (best, base, worst case) and a startup cost tracker. Most hosts need at least 30 line items across revenue and expense categories to build a model that reflects real operating conditions.
What is a realistic occupancy rate to model for a new Airbnb?
For a new listing with no reviews, model 40% to 50% occupancy in your base case for the first 3 months. Airbnb’s algorithm favors listings with reviews and booking history, so new properties typically underperform market averages initially. After 6 months and 10 or more reviews, occupancy often climbs to market-rate levels. AirDNA data shows that urban U.S. markets averaged 62% occupancy in 2023, but new listings in those same markets often start 15 to 20 percentage points below that benchmark. Always model a ramp-up period in your first-year projections rather than assuming full market-rate occupancy from day one.
How do I calculate break-even occupancy for my Airbnb?
Break-even occupancy is the minimum percentage of nights you must book to cover all expenses including your mortgage. The formula is: Break-Even Occupancy = Total Monthly Fixed Costs / (Nightly Rate × Days in Month). For example, if your total monthly costs (mortgage + insurance + utilities + taxes) equal $2,800 and your nightly rate is $175, your break-even is $2,800 / (175 × 30) = 53.3%. You need to book at least 16 nights per month just to break even. Add variable costs like cleaning and supplies and your true break-even rises further. Build this calculation into your Excel model so it updates automatically when you change your nightly rate.
What is a good cash-on-cash return for an Airbnb investment?
A cash-on-cash return of 8% to 12% is generally considered a strong result for a short-term rental investment in a competitive U.S. market, based on data from the National Association of Realtors and short-term rental investor benchmarks. Cash-on-cash return measures annual pre-tax cash flow divided by total cash invested (down payment + closing costs + startup costs). Returns below 5% may not justify the operational complexity of running an Airbnb versus a long-term rental. Returns above 15% are possible in high-demand vacation markets with low purchase prices, but they typically require high occupancy (65%+) and active pricing management. Always calculate this metric in your Excel model before purchasing.
How do Airbnb platform fees affect my financial model?
Airbnb charges hosts a 3% service fee on the booking subtotal (nightly rate multiplied by number of nights, not including the cleaning fee you set). This fee is deducted from your payout automatically. On a $1,000 booking, Airbnb keeps $30 from the host side. Guests pay an additional variable fee of approximately 14% to 16% of the booking subtotal, which affects your competitiveness on price but doesn’t come out of your payout. In your Excel model, calculate the host fee as 3% of gross nightly revenue (excluding cleaning fees) and list it as a separate line item in your operating expenses. VRBO’s host fee structure differs: hosts choose between a 5% commission plus 3% payment processing fee per booking, or an annual subscription of approximately $499 for unlimited bookings.
Can I use an Airbnb financial model for a property I don’t own yet?
Yes, and that’s the most valuable use case. An Airbnb financial model template lets you evaluate a property before you buy it by inputting the asking price, estimated mortgage terms, local market occupancy data, and comparable nightly rates. The model outputs tell you whether the property can generate positive cash flow at realistic occupancy levels. Run the model for at least 3 scenarios (best, base, worst case) and check whether the property breaks even in the worst case. If it doesn’t break even at 40% occupancy in the worst case, the investment carries significant financial risk. The eFinancialModels Airbnb template is specifically designed for pre-purchase analysis, with acquisition cost inputs and a startup cost tracker built into the first tab.
How often should I update my Airbnb financial model?
Update your Airbnb financial model monthly during the first year of operation, then quarterly once you have a full year of actual data. Each month, enter your actual revenue and expenses and compare them to your projections. Track your variance (actual minus projected) to identify where your assumptions were off. Common variances include higher-than-expected cleaning costs, lower occupancy in shoulder seasons, and maintenance expenses that exceed your reserve. After 12 months of actual data, rebuild your projections using real numbers as the base. This process turns your model from a one-time evaluation tool into a living operating dashboard that improves your pricing and expense decisions every quarter.
Conclusion
An Airbnb financial model template in Excel is the difference between buying a property based on optimism and buying one based on data. The worked example in this guide shows exactly how a property that looks attractive on gross revenue can produce negative cash flow at realistic occupancy rates — and how scenario planning reveals that before you sign a purchase agreement.
The 7 components, 5 common mistakes, and 4 key metrics covered here give you the framework. What you need next is a template that does the math automatically.
I recommend downloading the eFinancialModels Airbnb Financial Model Template — it includes pre-built revenue projections, a 12-month seasonality table, a complete expense schedule, scenario planning tabs, and an ROI dashboard, all ready to customize for your specific property in Excel.























































