
0 ITEMS

Thailand Resort Hotels: 4.5% RevPAR Growth to 2031

Thailand’s southern resort market is at an inflection point: national arrivals fell 7.2% in 2025, yet Phuket’s luxury tier posted average daily rates 30% above 2019 levels and a $14 billion branded-residence pipeline is reshaping how resorts get financed and exited.
Key Takeaways
- Thailand recorded 32.97 million international arrivals in 2025, down from 35.55 million in 2024, with virtually the entire shortfall caused by slower Chinese demand recovery.
- Phuket’s luxury and upper-upscale hotels ran near 80% occupancy in H1 2025 with an average daily rate (ADR) of approximately 5,652 baht, up 7.8% year-on-year.
- Phuket is the world’s largest market for branded leisure residences, with roughly 4,267 units, over $2.3 billion in inventory, and a development pipeline estimated near $14 billion.
- The Base Case scenario projects resort RevPAR (revenue per available room) CAGR of 4.5% from 2026 to 2031, with Thailand’s international arrivals recovering to approximately 41 million by 2031.
- Malaysia overtook China as Thailand’s largest source market in 2025 with 4.52 million visitors, signaling a structural demand diversification that reduces single-origin concentration risk.
- Thailand’s wellness economy is growing at close to 30% per year, turning Phuket and Koh Samui into longevity hubs that lift length of stay, spa capture rates, and ADR above conventional beach resorts.
- New resort development IRR targets range from 12% to 18%, while stabilized prime resort net yields sit at 5.5% to 7.0%, rewarding well-located, differentiated assets over undifferentiated mid-market builds.
The Thailand Hospitality Market in 2025: Headline vs. Reality
The national arrivals decline tells only half the story. Thailand welcomed 32.97 million international tourists in 2025, generating roughly 1.53 trillion baht in international receipts, according to the Tourism Authority of Thailand (TAT). The shortfall was concentrated almost entirely in Chinese demand, which softened due to domestic economic caution, competing destinations, and lingering safety perceptions.
The resort tier covered in this study tells a different story. Phuket handled 17.4 million airport passengers in 2025, recovering to about 96% of its pre-pandemic volume (according to data reported by The Thaiger). Its luxury segment sits more than 30% above 2019 benchmarks on both rate and RevPAR. The lesson for analysts: the national arrivals headline is a poor proxy for the investable resort tier. A southern Thai resort priced to a diversified international guest base outperformed the country average by a wide margin.
RevPAR (revenue per available room) is the hospitality industry’s core operating metric: it equals ADR multiplied by occupancy rate. TRevPAR (total revenue per available room) extends this to include food and beverage, spa, and wellness revenue, and it is the more relevant measure for a full-service southern Thai resort. Revenue per available room is widely recognized as one of the most critical performance indicators in hotel management, and industry benchmarking bodies such as STR track it across more than 65,000 properties globally to enable peer-set comparisons.
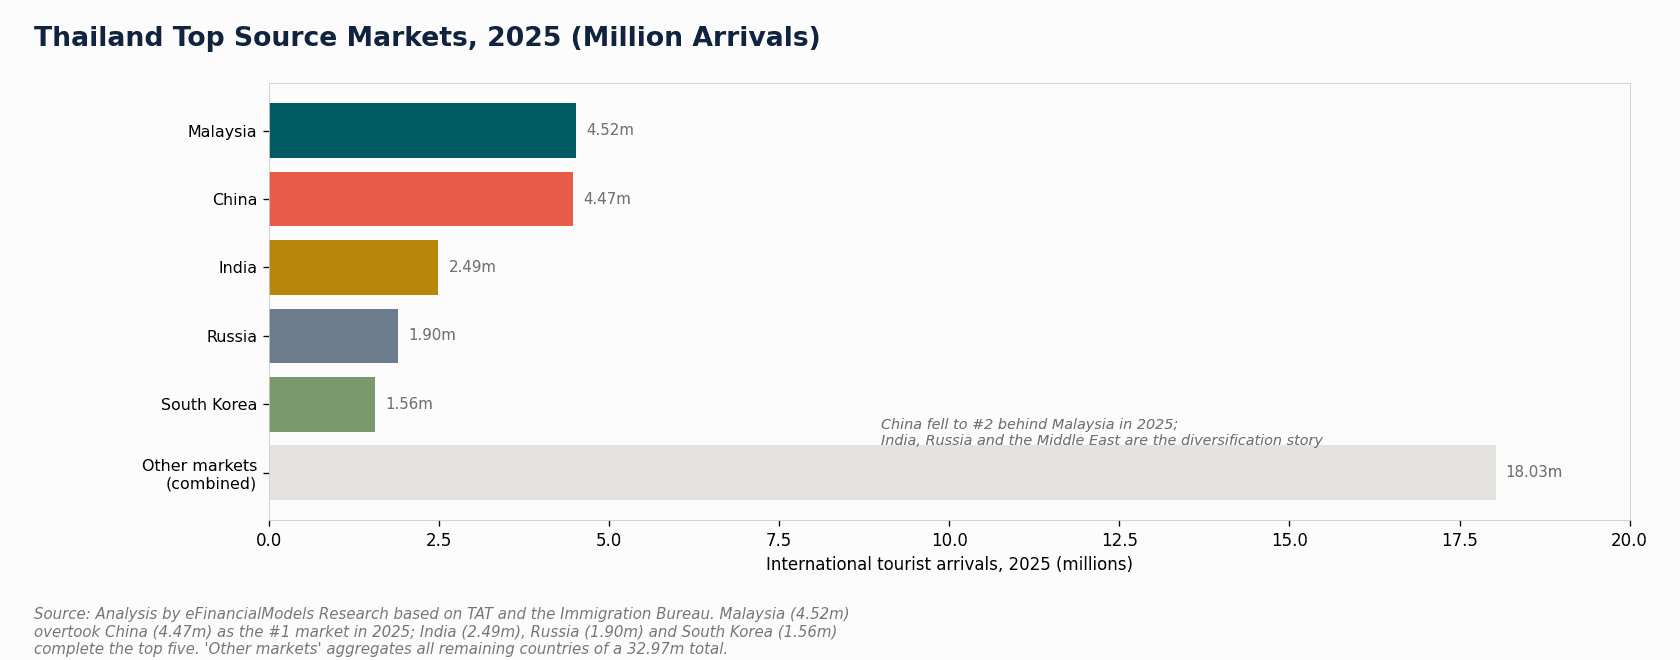
Malaysia overtook China as Thailand’s largest source market in 2025, a structural shift that reduces single-origin concentration risk for resort operators.
Source-Market Diversification: The Dominant Demand Theme
The single most important demand shift for the 2026 to 2031 forecast window is the rotation away from Chinese-led demand toward a balanced portfolio of origins. In 2025, Malaysia (4.52 million arrivals) overtook China (4.47 million) as Thailand’s largest source market, with India (2.49 million), Russia (1.90 million), and South Korea (1.56 million) completing the top five, according to TAT data. The Middle East and Europe grew into the gap left by Chinese softness.
For the analyst, this diversification cuts in the resort tier’s favor. Phuket draws Russians, Chinese, Indians, Koreans, Australians, Germans, British, Israelis, Saudis, and Malaysians. Koh Samui is majority European. Krabi leans European, Scandinavian, and domestic. Each origin carries different seasonalities, length-of-stay patterns, and rate tolerances, which smooth the overall demand profile.
The TAT is targeting 36.7 million arrivals and 2.78 trillion baht in total tourism revenue for 2026, explicitly through diversification and a quality-over-volume positioning strategy. For the financial model, this means demand should be built as a sum of source-market segments, not a single national arrivals assumption, and the Chinese recovery should be treated as a scenario variable rather than a base-case certainty.
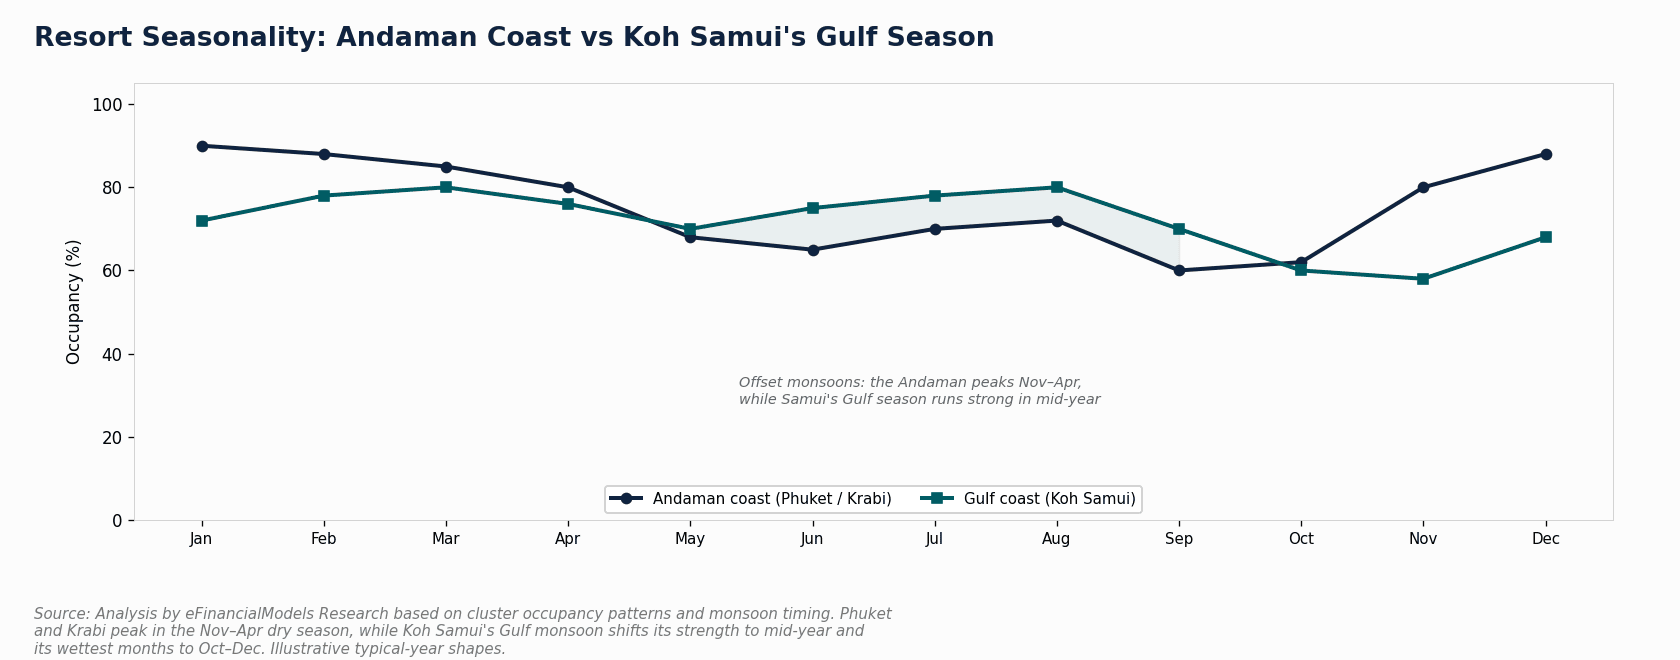
Koh Samui’s offset Gulf season complements Phuket’s Andaman high season, giving a multi-cluster portfolio more consistent year-round demand.
Supply-Side Dynamics: Constraint Favors the Premium Tier
Phuket added approximately 2,134 hotel rooms in 2025, more than double the 884 rooms added in 2024, according to Knight Frank Thailand. This supply acceleration creates genuine mid-market pressure even as demand recovers. At the same time, physical and regulatory constraints protect the premium end of the market.
Beachfront land is scarce and expensive. Coastal-setback and building-height rules constrain prime locations. Environmental Impact Assessment (EIA) requirements, which are mandatory government reviews for larger hotel developments, lengthen project timelines and raise costs. On Phuket specifically, a dry-season water constraint, where water must be trucked or desalinated, caps how much new capacity the island can physically carry.
The net effect: undifferentiated mid-market new builds compete hard, while scarce, well-located, licensed luxury and boutique assets remain structurally advantaged. Repositioning, branded-residence development, and wellness conversion are the dominant value-creation routes, not undifferentiated new build.
Leading Operators Across the Three Clusters
| Operator | Cluster Position | Brand Posture |
|---|---|---|
| Minor Hotels | Deep luxury and upscale | Anantara, Avani; wellness |
| Centara (Central Group) | Family and upscale | Resort, family; Reserve luxury |
| Dusit International | Thai heritage luxury | Dusit Thani; ASAI lifestyle |
| Banyan Group | Laguna Phuket (7 hotels) | Banyan Tree, Angsana; residences |
| Onyx Hospitality | Mid-to-upscale resort | Amari, OZO, Shama |
| Accor / Marriott / IHG | All tiers, deep south | Six Senses, Sofitel, JW Marriott |
| Boutique field (Sri Panwa, Trisara, Kamalaya) | Ultra-luxury and wellness | Top of the rate ladder |
Minor Hotels, one of Asia’s largest operators with more than 560 properties across 57 countries, reported 32% profit growth in 2025 and is targeting 850 properties by 2027. Banyan Group opened its 100th property in late 2025 and continues branded-residence launches at Laguna Phuket.

The modern southern Thai resort blends hotel operating cash flow, wellness revenue, and branded-residence sell-down into a single mixed-use return profile.
Branded Residences and Wellness: The New Return Drivers
The modern southern Thai resort is a blended operating-and-real-estate business, not a pure room-night business. Two structural forces are reshaping its economics: branded residences and wellness.
A branded residence is a for-sale residential unit operated under a hotel brand, often with a rental pool arrangement that shares room revenue between the developer or operator and unit owners. Phuket is the world’s largest market for branded leisure residences, ahead of Dubai, Miami, and the Caribbean, with roughly 4,267 units and over $2.3 billion in inventory, according to C9 Hotelworks. Branded product commands a 20% to 40% price premium over unbranded comparable product, with reported villa capital appreciation of 12% to 18% per year and rental-pool yields of 6% to 10%.
The branded-residence sell-down is frequently the mechanism that makes a southern-island project financeable. It front-loads capital recovery and reshapes the return profile, which is why analysts should model it as an explicit revenue line rather than a footnote.
On the wellness side, Thailand’s wellness economy is growing at close to 30% per year (Global Wellness Institute data cited by TAT Newsroom), and resorts such as Kamalaya on Koh Samui, Six Senses, and the longevity hubs on Phuket command rate and length-of-stay premiums that few beach destinations match. The global wellness economy was valued at $5.6 trillion in 2022.
Thailand’s outsized 30% annual growth rate reflects how effectively the southern resort tier has captured this expanding segment. For the financial model, the wellness and spa department should appear as a separate high-margin profit center that lifts both ADR and TRevPAR.
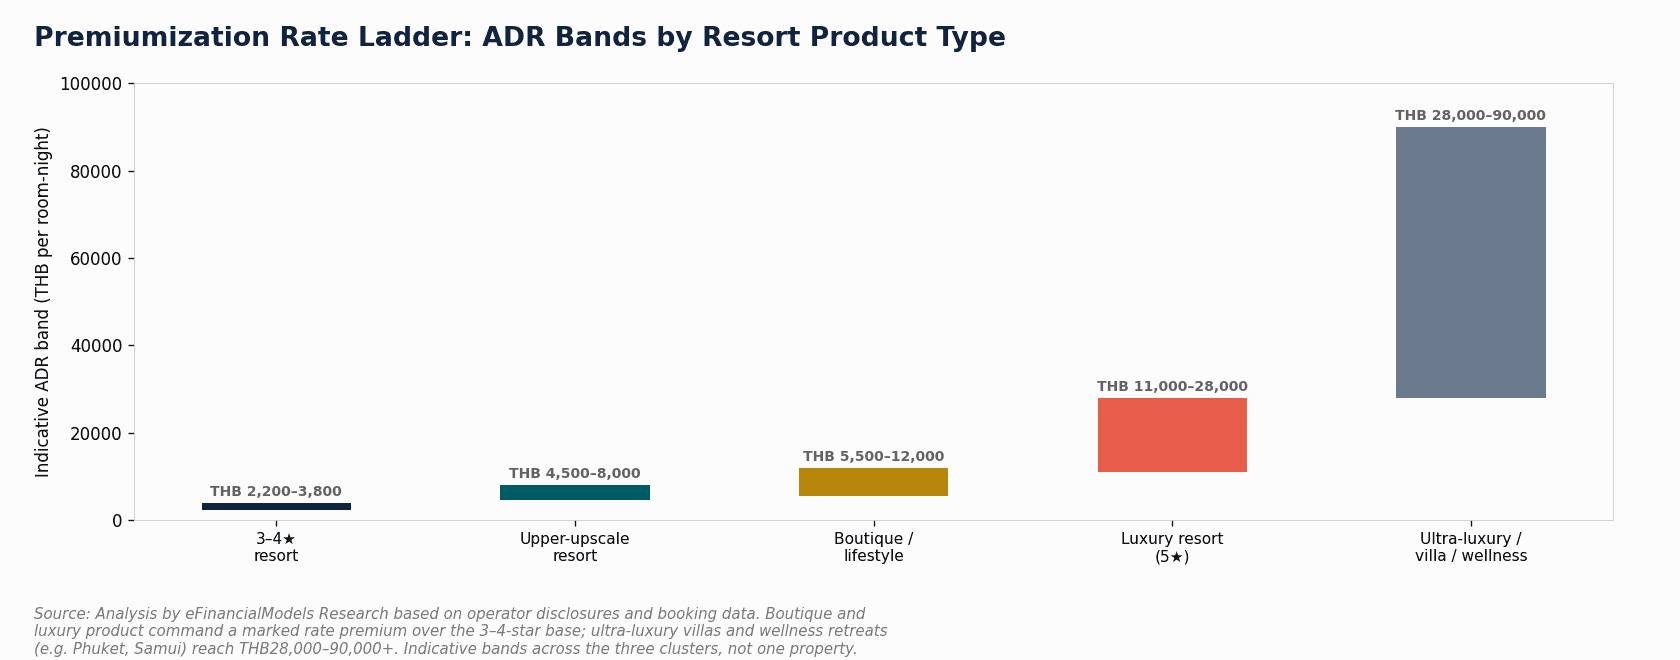
Phuket’s 4,267 branded residence units command a 20-40% price premium over unbranded product, with rental-pool yields of 6-10% to unit owners.
Worked Example: Base Case RevPAR Build for a Phuket Luxury Resort

Here’s the math for a 100-room upper-upscale Phuket resort using the Base Case assumptions from the EFM market study.
Starting inputs (2026):
- ADR: 5,652 baht (2025 market average, per CBRE Thailand H1 2025 data)
- Occupancy: 80%
- RevPAR = ADR x Occupancy = 5,652 x 0.80 = 4,522 baht
- ADR growth rate: 4.5% per year (Base Case CAGR)
Step 1: Project ADR to 2031 (5 years of 4.5% growth)
ADR 2031 = 5,652 x (1.045)^5 = 5,652 x 1.2462 = 7,044 baht
Step 2: Project occupancy to 2031
Base Case occupancy rises from 80% to approximately 81.5% as demand recovers.
Step 3: Calculate RevPAR at 2031
RevPAR 2031 = 7,044 x 0.815 = 5,741 baht
Step 4: Add wellness and F&B uplift (TRevPAR)
A resort with a functioning wellness department and food and beverage operation typically generates TRevPAR 25% to 40% above RevPAR. At 30% uplift:
TRevPAR 2031 = 5,741 x 1.30 = 7,463 baht per available room per night
Step 5: Annual total revenue for 100 rooms
Total revenue = 7,463 x 100 rooms x 365 nights = 272.4 million baht per year
This is the base-case revenue ceiling before branded-residence sell-down proceeds, which are modeled separately as a capital event rather than an operating line.
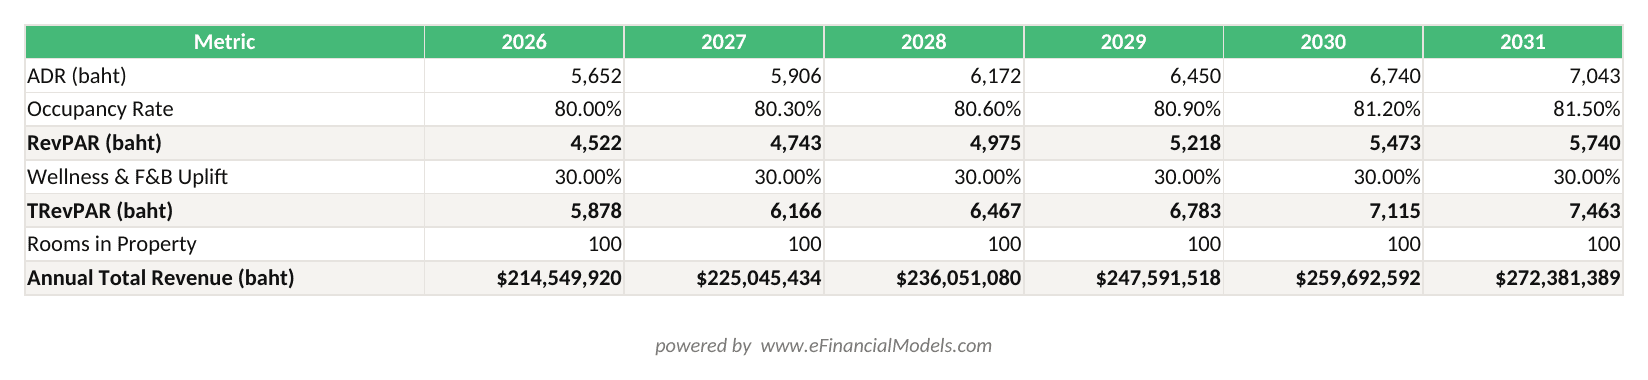
Base Case: RevPAR grows from 4,522 baht in 2026 to 5,741 baht in 2031 at 4.5% CAGR; TRevPAR reaches 7,463 baht with 30% wellness and F&B uplift.
Three Scenarios to 2031: Bear, Base, and Bull
The EFM study presents three scenarios with explicit probability weights. Analysts should run all three and weight them accordingly rather than anchoring on a single forecast.
| Metric at 2031 | Bear (25%) | Base (50%) | Bull (25%) |
|---|---|---|---|
| Resort RevPAR CAGR | ~2.0%/yr | ~4.5%/yr | ~6.5%/yr |
| Thailand arrivals | ~36 million | ~41 million | ~45 million |
| Phuket peak occupancy | ~80% | ~85% | ~88% |
| China recovery | Weak / partial | Gradual / steady | Rebound / accelerates |
| Indicative value-add return | Below hurdle | Low double digits | Low-to-mid teens |
The Bear Case (25% probability) holds arrivals near 36 million and RevPAR growth near 2.0% per year, driven by prolonged Chinese weakness, regional instability, a safety-perception shock, or mid-market oversupply in Phuket. The Base Case (50% probability) sees arrivals recover to roughly 41 million by 2031, in line with TAT’s 36.7 million target for 2026 and steady diversification thereafter. The Bull Case (25% probability) lifts arrivals to about 45 million and RevPAR growth to about 6.5% per year on a Chinese rebound, faster Indian and Middle Eastern growth, and the potential legalization of integrated entertainment complexes.
The entertainment-complex bill, which would allow casino-anchored destination resorts, was withdrawn in July 2025. Analysts should underwrite the base case without casino upside and treat any legislation as optionality to monitor, not a plan.

The Base Case (50% probability) projects 4.5% RevPAR CAGR and 41 million arrivals by 2031; the Bull Case adds casino optionality and a Chinese demand rebound.
Common Modeling Mistakes and How to Fix Them
Analysts building southern Thai resort models consistently make five errors that distort returns.
Mistake 1: Using national arrivals as the demand input. Thailand’s 7.2% arrivals decline in 2025 had almost no impact on Phuket’s luxury occupancy. Fix: build demand as a sum of source-market segments at the cluster and tier level, not from the national headline.
Mistake 2: Treating the Chinese recovery as a base-case certainty. China was historically Thailand’s largest and most rate-elastic source market, and its slow recovery drove the 2025 shortfall. Fix: model Chinese demand as a scenario variable with a Bear, Base, and Bull path, and stress the base case against a slow recovery.
Mistake 3: Omitting branded-residence revenue from the return model. A Phuket resort with a branded-residence component generates a materially different return profile than a pure hotel. Fix: add a branded-residence sell-down schedule and rental-pool revenue share as explicit model lines.
Mistake 4: Ignoring water and resilience capex. Phuket’s dry-season water constraint is a binding operating cost, not a footnote. Fix: carry water, desalination, and energy resilience as a recurring capital line and stress it against a drought scenario.
Mistake 5: Applying a single blended ADR across all room types. Rate dispersion between a standard room and an ultra-luxury villa on the same property can be 5x or more. Fix: build a room-type rate ladder weighted by inventory mix, and model premiumization as a shift in that mix over time.
Investment Returns and Capital Flows
Hotel investment in Thailand reached a record of roughly 22 billion baht (approximately $650 million) in 2024 and normalized to around 20 billion baht in 2025, with JLL reporting that Bangkok accounts for the clear majority of transaction volume. Resort-island deals are a minority of national flow, though a growing one, and the average deal size has risen toward 1.8 billion baht, up approximately 80% on the 10-year average. For context on how hotel transaction benchmarks are tracked globally, JLL’s Hotels & Hospitality Group monitors more than $10 billion in annual hotel investment transactions across Asia Pacific alone, underscoring how Thailand’s record 2024 volume fits within a broader regional capital rotation toward leisure assets.
For the investor, the return benchmarks from the Base Case are: stabilized prime resort net yields of 5.5% to 7.0%, new resort development IRR of 12% to 18% (reflecting construction, entitlement, and ramp-up risk), branded-residence premiums of 20% to 40% over unbranded product, and rental-pool yields of 6% to 10% to unit owners. These returns concentrate at the luxury, boutique, and wellness top of the market, not in undifferentiated mid-market capacity.
The practical implication: land scarcity, coastal-setback rules, and the cost of repositioning all advantage the in-place owner of a scarce, well-located, licensed asset. Repositioning and wellness conversion generate better risk-adjusted returns than undifferentiated new build in a supply-pressured market.
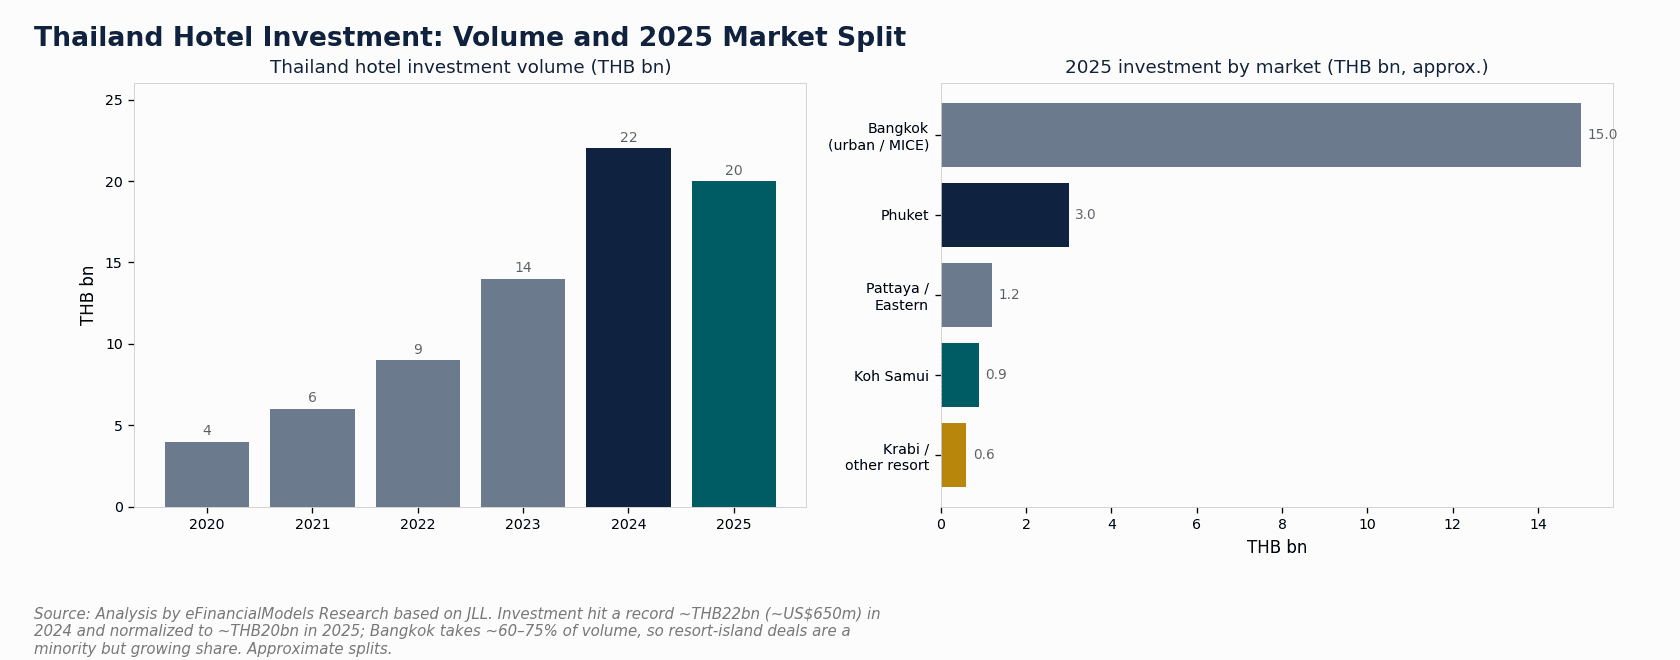
Thailand hotel investment normalized to 20 billion baht in 2025 after a record 22 billion baht in 2024, with Bangkok accounting for 60-75% of transaction volume.
Risks: What Could Break the Thesis
The southern Thai resort thesis is attractive but carries five distinctive risks that analysts must stress-test.
Source-market concentration remains the highest-severity risk. The 2025 decline proved that historical over-reliance on Chinese demand can produce a 7.2% national arrivals fall even when the resort tier holds its rate. A resort whose own guest mix is skewed to one origin is exposed to exactly this shock.
Mid-market oversupply in Phuket is the most certain near-term operating pressure. With 2,134 rooms added in 2025 and a deep pipeline behind them, the mid-market faces genuine rate compression. The mitigation is premium and boutique positioning with strong differentiation.
Water and resource stress on Phuket is a binding constraint, not a cyclical one. Dry-season water must be trucked or desalinated, and the cost rises with new capacity. Resilience capex belongs in the capital plan and the discount-rate assumptions.
Regulatory and political uncertainty, including the withdrawn casino bill, pending elections, and the reversion of the visa-exemption period from 60 days back to 30 days in 2026, creates policy flux that analysts should handle by underwriting without optionality and monitoring for upside.
Branded-residence sell-down risk is moderate but real: if demand or pricing softens on for-sale units, the capital structure of a mixed-use resort can be stressed. Phased releases and strong rental-pool yields are the primary mitigations.
Tools and Templates for Southern Thai Resort Modeling
Building a credible southern Thai resort model requires a structure that handles multiple revenue streams simultaneously. The Hospitality Financial Model Bundle from eFinancialModels provides the integrated framework for combining room-type rate ladders, wellness and F&B revenue builds, and branded-residence sell-down schedules in a single pro forma.
For operators and investors who need a broader hospitality template suite, the Hospitality Financial Model Template Bundle covers the full range of property types and structures relevant to the southern Thai market. Analysts working on market-entry feasibility can also reference the Market Studies tag on eFinancialModels for comparable research across other leisure markets.
The key modeling disciplines for this market are: build demand as a portfolio of source markets, model wellness and branded-residence revenue as separate high-margin lines, carry water and resilience capex as a recurring cost, and run all three scenarios (Bear, Base, Bull) rather than anchoring on a single forecast.
Frequently Asked Questions
Why did Thailand’s resort tier outperform the national arrivals decline in 2025?
Thailand’s 7.2% national arrivals decline in 2025 was driven almost entirely by slower-than-expected Chinese demand recovery. The southern resort tier, however, draws from a genuinely diversified mix of origins: Russians, Indians, Europeans, Australians, Middle Easterners, and Koreans, among others. Because no single origin dominated, the resort tier absorbed the Chinese shortfall without a corresponding drop in occupancy or rate. Phuket’s luxury segment ran near 80% occupancy in H1 2025 and posted an ADR of approximately 5,652 baht, up 7.8% year-on-year. The lesson for analysts is that the national arrivals headline is a poor proxy for the investable resort tier, and cluster-level and tier-level performance metrics are the correct anchors for a financial model.
What makes Phuket’s branded-residence market globally significant?
Phuket is the world’s largest market for branded leisure residences, ahead of Dubai, Miami, and the Caribbean, with roughly 4,267 units and over $2.3 billion in inventory, according to C9 Hotelworks. The development pipeline is estimated near $14 billion. Branded residences are for-sale units operated under a hotel brand, typically with a rental-pool arrangement that shares room revenue between the developer or operator and unit owners. Branded product commands a 20% to 40% price premium over unbranded comparable product, with reported villa capital appreciation of 12% to 18% per year and rental-pool yields of 6% to 10%. For investors, the branded-residence sell-down is frequently the mechanism that makes a southern-island project financeable, front-loading capital recovery and reshaping the overall return profile.
How should analysts model the Chinese demand recovery?
The Chinese recovery should be treated as an explicit scenario variable, not a base-case certainty. In the Bear Case (25% probability), Chinese demand remains weak or partially recovers, holding Thailand’s total arrivals near 36 million by 2031 and resort RevPAR growth near 2.0% per year. In the Base Case (50% probability), Chinese demand recovers gradually alongside steady diversification, lifting arrivals to roughly 41 million and RevPAR growth to 4.5% per year. In the Bull Case (25% probability), a Chinese rebound combines with faster Indian and Middle Eastern growth to push arrivals to about 45 million and RevPAR growth to 6.5% per year. The practical modeling approach is to build the base case on the more predictable diversified markets and stress the Chinese recovery separately in each scenario.
What are the key cost risks for a Phuket resort operator?
The cost stack for a Phuket luxury resort has four primary pressure points. Labor costs grow ahead of CPI in a service-intensive luxury operation. Water is a binding island constraint: dry-season shortages require trucked or desalinated water, and this cost rises with new capacity additions. Energy costs are elevated by the island’s infrastructure and the need for resilience systems including solar and storage. Land and lease costs reflect the scarcity of beachfront locations and the premium that coastal-setback rules place on existing licensed assets. Analysts should carry all four as explicit cost lines in the model, stress the water line against a drought scenario, and include a recurring capital budget for water and energy resilience rather than treating it as a one-time expense.
How do Phuket, Koh Samui, and Krabi differ as investment markets?
The three clusters have distinct demand profiles, seasonality patterns, and investment characteristics. Phuket is the anchor market: the largest, most internationally diversified, and the center of the branded-residence and wellness boom. Its Andaman coast high season runs November to April, and it carries the deepest operator competition and the most new supply pressure, particularly in the mid-market. Koh Samui is majority European in its guest mix, has an offset Gulf-coast season that provides year-round demand when combined with Phuket, and is positioned as a wellness and boutique luxury destination anchored by properties like Kamalaya. Krabi leans European, Scandinavian, and domestic, with a nature and value positioning constrained by national-park boundaries, coastal-setback rules, and building-height limits that protect its environmental character. Each cluster should be modeled separately with its own seasonality curve, source-market mix, and supply pipeline.
What return benchmarks should investors use for southern Thai resorts?
The EFM Base Case sets the following benchmarks for the 2026 to 2031 period: Phuket occupancy rising from approximately 80% to 81.5%, resort ADR growth of 4% to 5% per year, resort RevPAR CAGR of 4.5%, stabilized prime resort net yields (cap rates) of 5.5% to 7.0%, and new resort development IRR of 12% to 18% reflecting construction, entitlement, and ramp-up risk. Branded-residence premiums of 20% to 40% over unbranded product and rental-pool yields of 6% to 10% to unit owners add a real-estate return layer on top of the hotel operating cash flow. A resort that underperforms these benchmarks on rate, capture, or real-estate monetization is either mispriced or operationally weak.
Is the Thailand casino and entertainment-complex bill relevant to resort investment?
The integrated entertainment-complex bill, which would have allowed casino-anchored destination resorts, was withdrawn in July 2025 after political opposition. It remains a potential demand catalyst if it returns after the political cycle resolves, because casino-anchored resorts would add a new demand driver and could lift arrivals and length of stay materially. However, the timing and form of any future legislation are genuinely uncertain. The correct modeling approach is to underwrite the base case entirely without casino upside, carry the legislation as optionality to monitor, and include it only in the Bull Case as an incremental demand scenario. Investors who price in casino upside before legislation passes take on regulatory risk that the market does not currently support.
Conclusion
Thailand’s southern resort market is not a single-market, occupancy-driven business. It’s a diversified-demand, rate-and-capture, and increasingly real-estate-led asset class where the returns come from premiumization, wellness, and branded-residence monetization rather than from volume. The 2025 arrivals decline exposed the cost of Chinese concentration at the national level, but the resort tier’s performance proved that a well-positioned, diversified asset can hold its pricing power through a demand shock. The Base Case projects 4.5% RevPAR CAGR to 2031, with the upside driven by continued premiumization, wellness-led length-of-stay growth, and a $14 billion branded-residence pipeline that is reshaping how southern Thai resorts are financed and valued.
I recommend building your pro forma with the Hospitality Financial Model Bundle, which provides the integrated room-type rate ladder, wellness and F&B revenue build, and branded-residence sell-down structure that this market requires.























































