
0 ITEMS

Spain Resort Hotels: €4.28bn Investment Surge 2026–2031
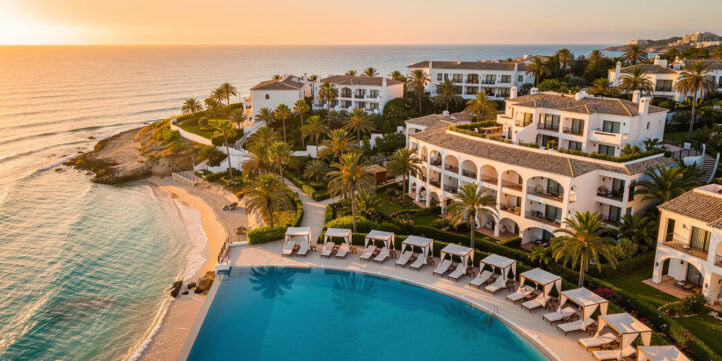
Spain’s sun-and-beach resort sector entered 2026 as Europe’s most resilient leisure hospitality market, with receipts growing nearly twice as fast as arrivals — the clearest signal that the industry now runs on rate and yield, not headcount.
Key Takeaways
- Spain welcomed a record 96.8 million international tourists in 2025, generating €134.7 billion in receipts — receipts grew 6.8% while arrivals grew only 3.2%, proving the market is monetizing on rate.
- Spanish hotel investment reached €4.28 billion in 2025, the second-highest figure on record, with the resort segment capturing 55% (€2.34 billion) across 82 deals.
- The Canary Islands led investment for a third consecutive year with over €1 billion, and the €430 million Resort Mare Nostrum deal in Tenerife became the largest single hotel-asset transaction in Spain’s history.
- Island resort RevPAR reached roughly €120–130 in 2025; the EFM Base Case projects a 4.5% annual CAGR through 2031, reaching approximately 110 million international arrivals.
- The Spanish statutory minimum wage (SMI) rose 61% between 2018 and 2026 to €1,221 per month, making labor the dominant cost risk and premium-rate positioning the primary defense.
- Regulation now acts as a supply lever: the Balearic containment decree of 2025 bans new tourist accommodation in multi-family dwellings, and the Canary Islands paused new tourist-rental licenses for five years.
- The all-inclusive (AI) plan is a revenue-capture mechanism, not a discount — it internalizes food, beverages, and activities into one rate, lifting total revenue per available room above a bed-and-breakfast base at identical occupancy.
Spain Hospitality Market: The 2025 Baseline
Spain’s resort hospitality market is the largest sun-and-beach market in Europe, and its 2025 numbers set the baseline for every forecast in this study. The country recorded 96.8 million international arrivals in 2025, up 3.2% year-on-year, according to Spain Resort & All-Inclusive Hospitality Market Study 2026-2031 based on Spain’s INE FRONTUR statistics. Those arrivals generated €134.7 billion in receipts, up 6.8% — receipts growing roughly twice as fast as arrivals is the defining feature of the current cycle.

The three clusters in scope — the Costa del Sol, the Balearic Islands, and the Canary Islands — together account for roughly a third of all arrivals. The Balearics and Canaries each drew about 15.7 million international tourists in 2025, and the Costa del Sol welcomed 14.65 million visitors (Andalucia Today, 2025). The United Kingdom, Germany, and the Nordic countries dominate the source-market mix across all three clusters, creating both a structural demand floor and a concentration risk the analyst must stress-test.
RevPAR (revenue per available room, calculated as ADR multiplied by occupancy rate) reached roughly €120–130 in the island clusters in 2025, with island peak occupancy running in the mid-80s. Marbella on the Costa del Sol posted Spain’s highest hotel rates, reaching a €375 average daily rate (ADR) and €296 RevPAR in July 2025 — figures that stand comparison with the French Riviera and the Italian coast, according to eFinancialModels Research. Spain’s hotel sector comprises more than 15,000 hotel establishments (Instituto Nacional de Estadística), underscoring the scale of the market in which these resort clusters compete.
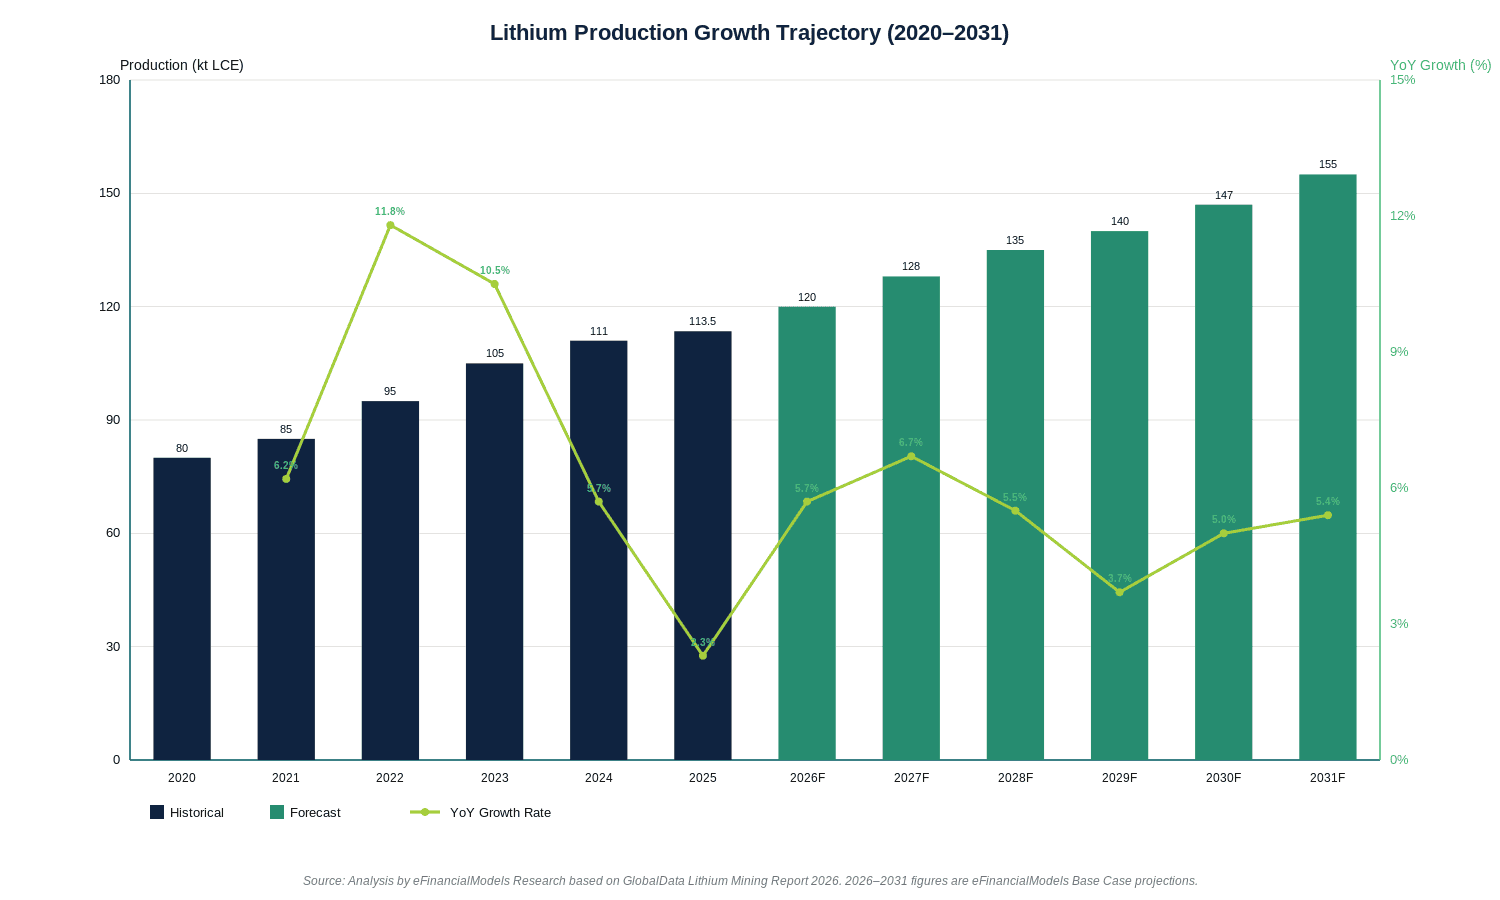
Receipts growing at 6.8% versus arrivals at 3.2% is the defining signal that Spain’s resort market now prices on rate and yield, not headcount.
Supply-Side Dynamics: Regulation as a Rate Lever
New licensed resort supply in Spain’s three clusters is structurally gated by policy, which protects occupancy and rate for in-place owners and makes repositioning the dominant value-creation route. The Balearic Islands’ Decree-Law 4/2025 bans the creation of new tourist accommodation in multi-family dwellings and holds the total number of tourist places flat, while a Menorca moratorium suspends new licenses pending a carrying-capacity study (Garrigues, 2025). The Canary Islands passed Spain’s toughest holiday-let law in November 2025, pausing new tourist-rental licenses for five years, capping tourism at 10% of housing stock, and allowing municipalities to prohibit short-term rentals by zone (Spanish Property Insight, 2025).
The combined effect is twofold. First, it gates new competing supply, which keeps occupancy high and supports rate growth in licensed resort hotels. Second, it re-channels leisure demand away from unlicensed short-term rentals back toward hotels, supporting both occupancy and rate. For the investor, this is a structural tailwind for existing assets and a constraint on greenfield development.
Spanish hotel investment reached €4.28 billion in 2025 across 194 transactions, the second-highest figure on record, according to. Colliers Hotel Investment in Spain 2025 The resort segment took 55% of the total (€2.34 billion across 82 deals at an average ticket of approximately €28 million, well above the urban average). The Canary Islands led for a third consecutive year with over €1 billion and 24% of the national total. Domestic investors took 63% of the total, a sign of deep local conviction in the resort thesis.
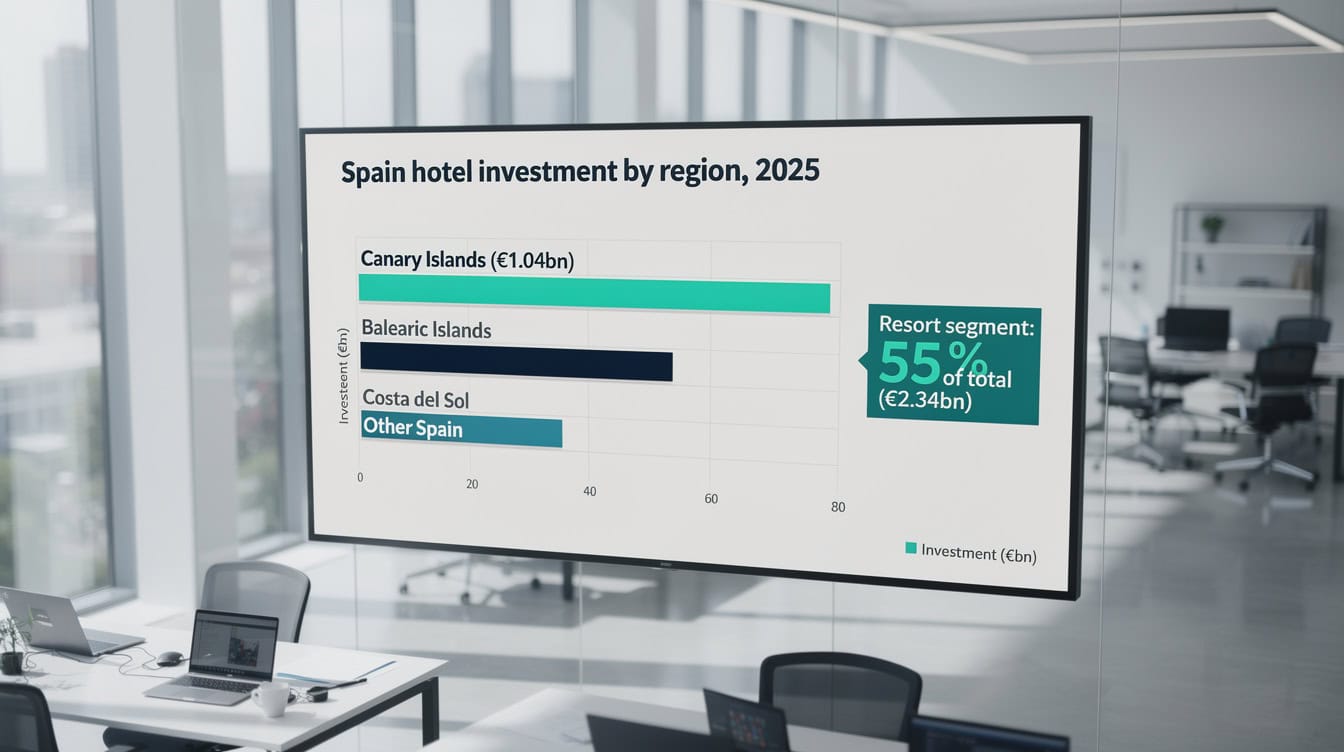
The Canary Islands led Spanish hotel investment for a third consecutive year in 2025, capturing 24% of the €4.28 billion national total.
The All-Inclusive Revenue Build: A Worked Example
The all-inclusive (AI) plan is the sector’s most under-analyzed economic engine, and modeling it correctly is what separates a well-built Spanish resort pro forma from a generic hotel model. An all-inclusive resort bundles meals, most beverages, and many on-site activities into a single nightly rate, internalizing spend that a bed-and-breakfast or half-board rate leaves uncaptured.
Here’s the math for a 300-room, 4-star island resort operating at 84% occupancy:
Step 1: Calculate occupied room-nights per year
300 rooms × 365 nights × 84% occupancy = 91,980 occupied room-nights
Step 2: Set the rate ladder
- Standard AI ADR: €150 per room-night
- Adults-only / premium AI ADR: €210 per room-night
- Assume 60% of rooms sell at standard AI, 40% at premium AI
- Blended ADR: (0.60 × €150) + (0.40 × €210) = €90 + €84 = €174
Step 3: Calculate room revenue
91,980 room-nights × €174 blended ADR = €16,004,520
Step 4: Add AI capture revenue (food, beverage, activities)
Capture rate: €45 per occupied room-night (net of cost-of-sales)
91,980 × €45 = €4,139,100
Step 5: Total Revenue per Available Room (TRevPAR)
Total revenue: €16,004,520 + €4,139,100 = €20,143,620
TRevPAR: €20,143,620 / (300 × 365) = €184 per available room-night
A comparable bed-and-breakfast resort at the same occupancy and a €130 ADR would generate a TRevPAR of roughly €109, assuming minimal on-property capture. The AI plan adds approximately €75 per available room-night in this example — a 69% TRevPAR uplift — which is why the model must decompose the board-plan mix rather than burying it in one blended ADR.
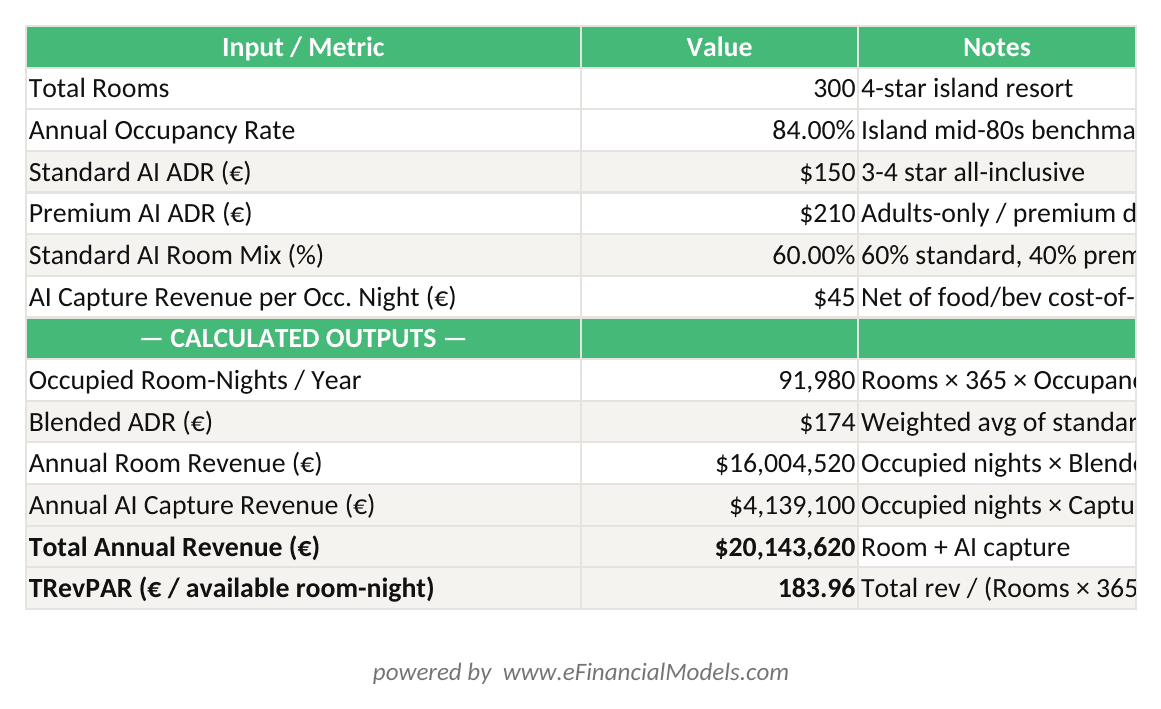
TRevPAR = (Room Revenue + AI Capture Revenue) / Total Available Room-Nights. Premium AI mix lifts TRevPAR from ~€109 (B&B base) to ~€184 — a 69% uplift at identical occupancy.
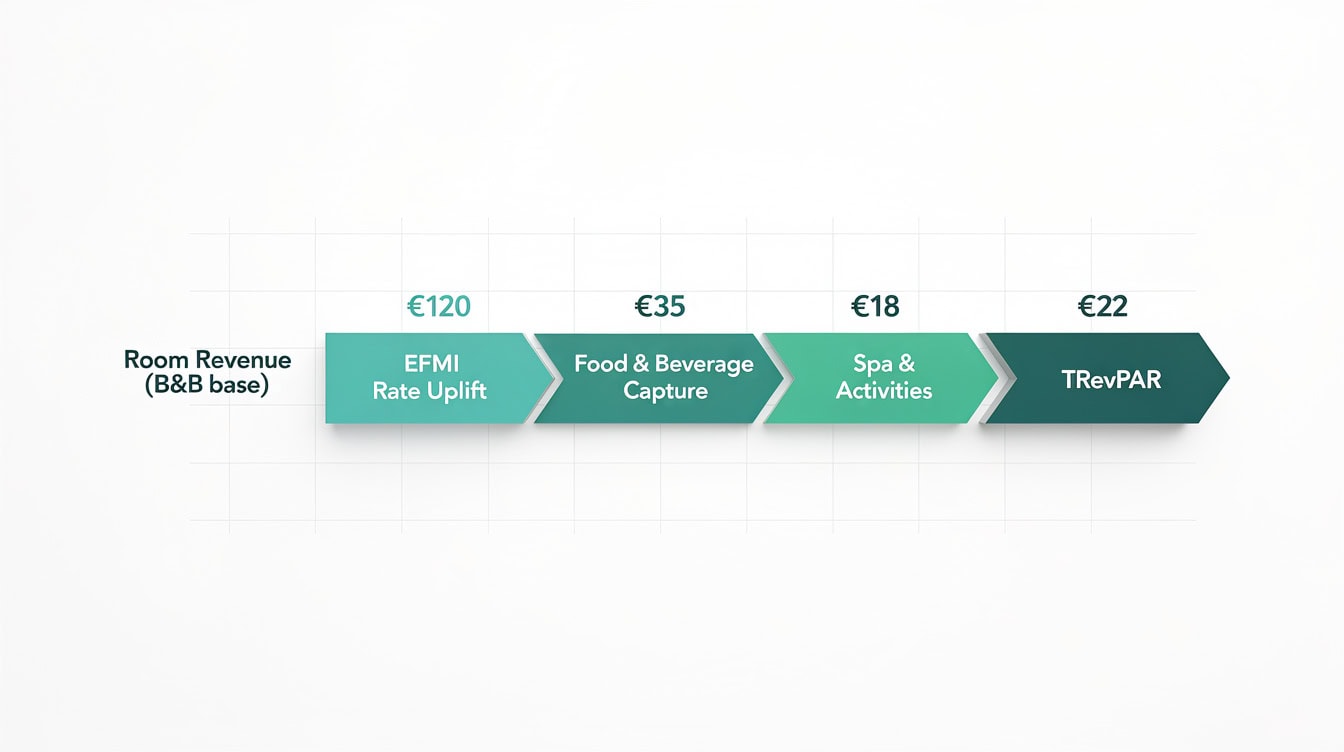
The AI plan adds approximately €75 per available room-night in TRevPAR versus a comparable bed-and-breakfast resort at identical occupancy — a 69% uplift in the worked example.
Premiumization: The Rate Ladder and Where Margin Lives
Premiumization is the principal growth lever in a market where peak-season occupancy is already at practical capacity. Spanish resorts are moving up the rate ladder from standard 3-to-4-star all-inclusive toward adults-only, premium dine-around, and luxury repositioning, and each step commands a marked rate premium. The rate range within the sector is enormous: standard all-inclusive sits at the bottom, family and adults-only 4-star product in the middle, and premium dine-around and luxury resorts at the top.
These premiums are driven by three forces: scarcity of quality product in a supply-constrained market, brand intensification as international luxury groups enter, and an affluent guest willing to pay for adults-only privacy, premium food and beverage, and wellness. Meliá Hotels International, listed and asset-light, has shifted hard toward premium and luxury, which now account for 63% of its portfolio and 78% of its pipeline (Meliá Hotels International Annual Results, 2025). RIU ended 2025 with 100 hotels and 54,412 rooms and remains the sun-and-beach all-inclusive leader (Travel Market Report, 2026).
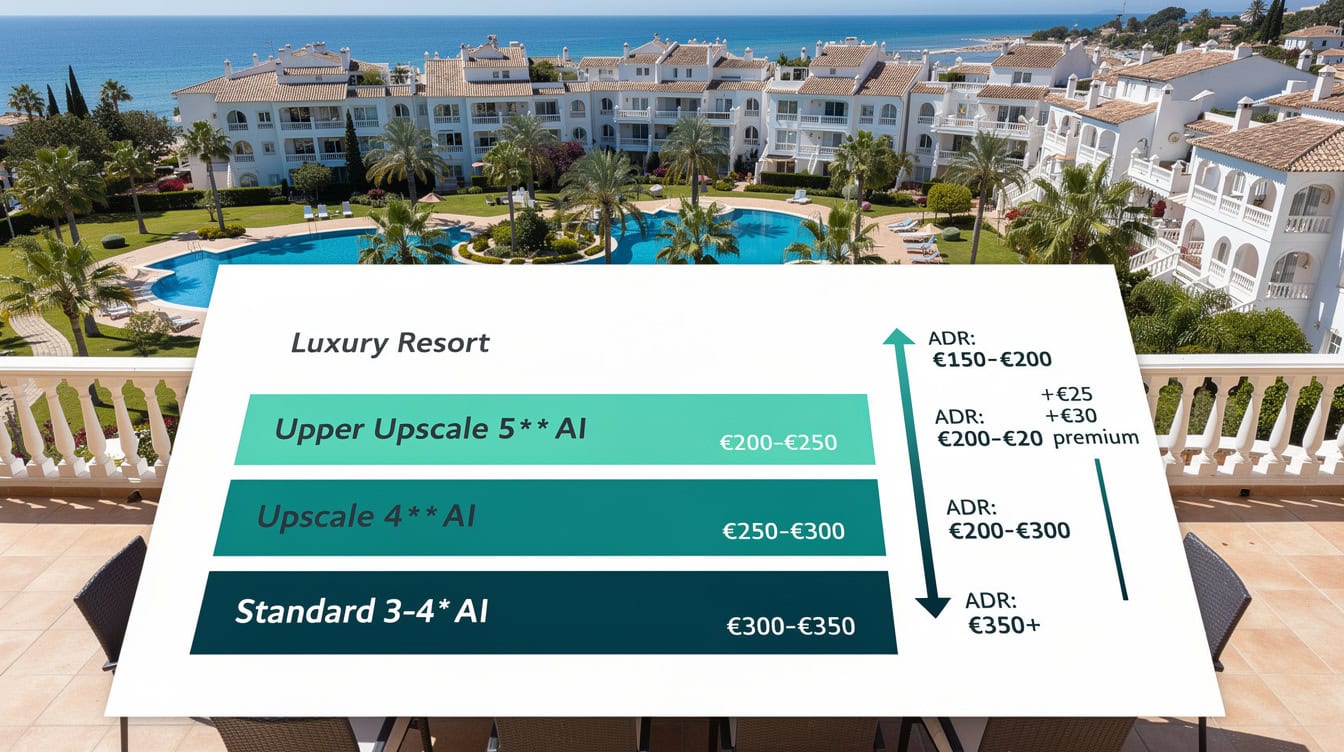
Marbella’s luxury tier reached a €375 ADR in July 2025 — more than 4x the rate of a standard all-inclusive property in the same market.
Scenario Comparison: Bear, Base, and Bull Cases to 2031
The three scenarios below reflect the EFM Research team’s probability-weighted outlook for the Spanish resort sector through 2031. Each scenario models a different combination of demand growth, premiumization pace, regulatory environment, and cost-stack pressure.
| Metric at 2031 | Bear (25%) | Base (50%) | Bull (25%) |
|---|---|---|---|
| RevPAR CAGR 2026–31 | ~2.0%/yr | ~4.5%/yr | ~6.0%/yr |
| Spain Int’l Arrivals | ~102 million | ~110 million | ~116 million |
| Island Peak Occupancy | ~82% | ~84% | ~86% |
| Premiumization Pace | Stalls | Steady | Accelerates |
| Value-Add Return | Below hurdle | High single digits | Low double digits |
| Stabilized Prime Yield | ~5.0–5.5% | ~4.5–5.0% | ~4.0–4.5% |
The Base Case (50% probability) projects resort RevPAR growth of approximately 4.5% per year as constrained licensed supply meets steady Northern-European demand and the premium tier absorbs the higher cost stack through pricing power. The Bear Case (25%) projects approximately 2.0% RevPAR growth on a European demand slowdown, an overtourism-driven reputation shock, and heavier cost and climate friction. The Bull Case (25%) projects approximately 6.0% RevPAR growth on sustained premiumization, de-seasonalization that lifts shoulder months, and a genuine shortage of licensed quality product.
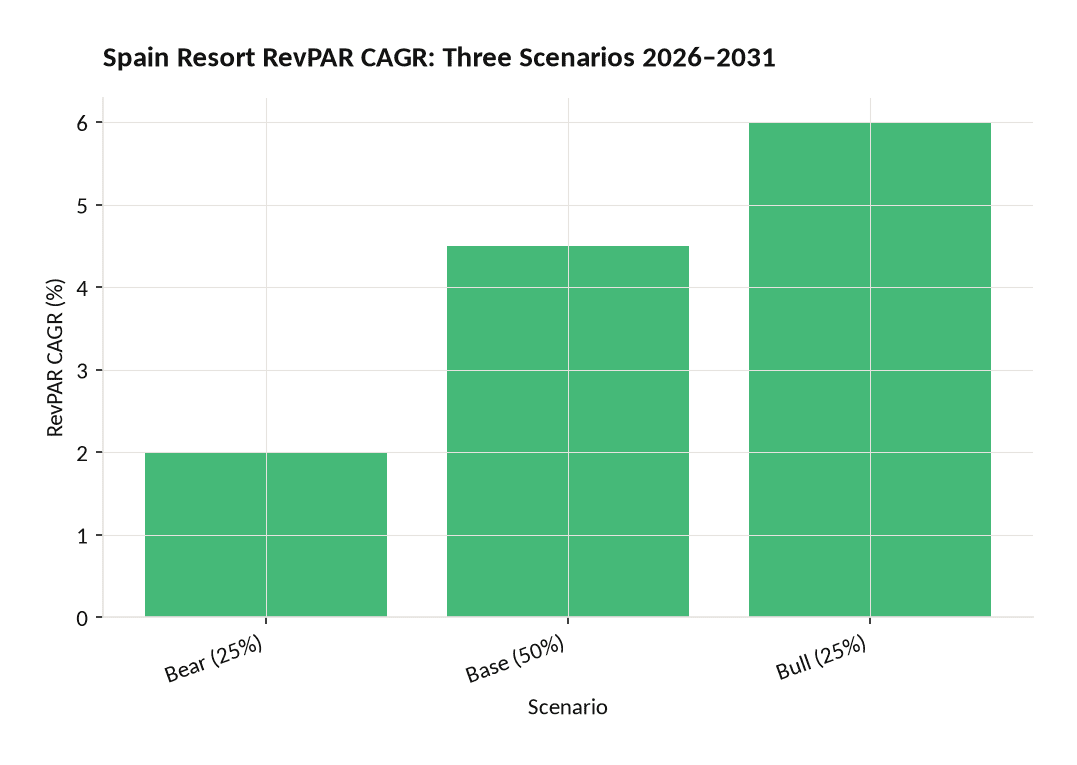
EFM Base Case assigns 50% probability to 4.5% annual RevPAR growth; the Bull Case (25%) reaches 6.0% on accelerating premiumization and supply scarcity.
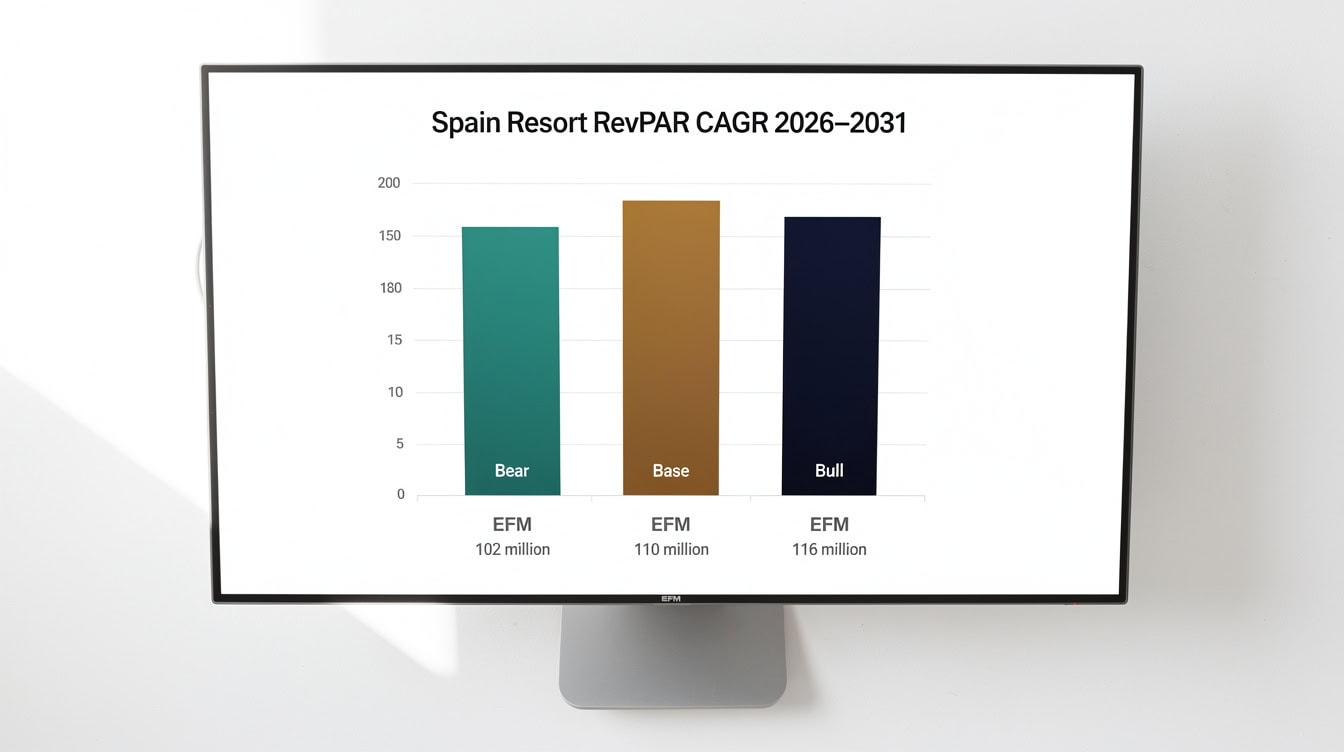
The EFM Base Case (50% probability) projects 4.5% annual RevPAR growth and 110 million international arrivals by 2031; the Bull Case reaches 6.0% CAGR and 116 million arrivals.
The Cost Stack: Labor, Eco-Tax, and Climate
The cost stack is rising and labor-led, and it structurally advantages the premium tier. Spain’s statutory minimum wage (SMI) rose 61% between 2018 and 2026 to €1,221 per month, according to La Moncloa (2025). Source Sector collective-bargaining agreements (convenios) push effective wages higher still, and energy, water, and the Balearic eco-tax (Sustainable Tourism Tax, or ITS, at €1–4 per guest per night in high season by category) add further cost pressure. To put the scale of Spain’s hospitality workforce in context, the accommodation and food service sector employed approximately 1.7 million people in Spain as of recent years (, Encuesta de Población Activa), Instituto Nacional de Estadística meaning even modest SMI increases translate into enormous aggregate cost pressure across the sector.
These costs fall as a small share of a premium rate and a large share of a budget one, structurally advantaging the top of the market. A resort running a €210 ADR absorbs a €5 per room-night labor cost increase far more easily than one running a €90 ADR. The model must grow the labor line ahead of general inflation and test the margin against a scenario where rate growth fails to keep pace with the cost stack.
Climate exposure adds a third cost dimension. Tenerife declared a drought emergency in early 2024 and extended its water emergency declaration into 2025 (Euronews, 2024; Canarian Weekly, 2025). The prudent model treats water and energy resilience as a recurring capital expenditure line, not a tail risk to be ignored, and lets climate exposure inform the discount rate applied to Canary Islands assets.
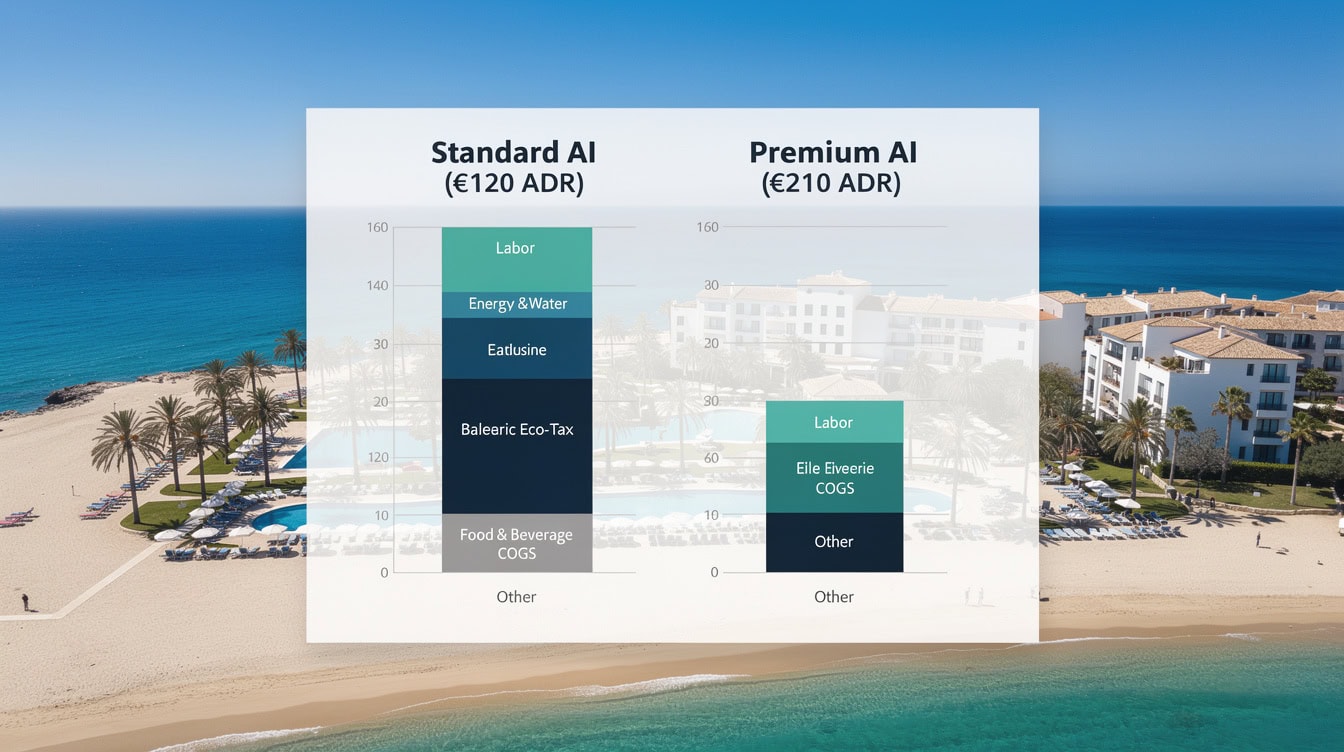
A rising SMI falls as a small share of a €210 premium AI rate but as a large share of a €120 standard AI rate — the structural argument for premiumization in a rising-wage environment.
Common Modeling Mistakes and How to Fix Them
Five specific errors appear repeatedly in Spanish resort financial models, and each one distorts the output in a predictable direction.
Mistake 1: Using a single blended ADR instead of a board-plan rate ladder. A resort with a 60/40 mix of standard and premium AI product has a materially different revenue profile than one running 90% standard AI. Fix: build the room-type and board-plan rate ladder explicitly (B&B / HB / standard AI / adults-only / premium AI) and weight by actual room-night mix.
Mistake 2: Modeling occupancy growth as the primary revenue lever. Island occupancy is already in the mid-80s and supply-capped by regulation. Fix: anchor the model on rate growth and premiumization, not on filling rooms that are already full in season.
Mistake 3: Growing the labor line at CPI. The SMI has risen 61% since 2018, far ahead of general inflation, and convenios compound the effect. Fix: grow the labor line at SMI trajectory plus a sector premium, and stress-test the margin against a scenario where rate growth lags.
Mistake 4: Omitting the eco-tax and resilience capex as explicit line items. The Balearic ITS (€1–4 per guest per night) and water/energy resilience capital are real, recurring costs. Fix: carry both as named line items in the operating model and the capital plan.
Mistake 5: Modeling all three clusters with the same seasonal shape. The Canary Islands run high occupancy year-round on the winter-sun market; the Balearics and Costa del Sol are sharply summer-peaked. Fix: model each cluster separately, month by month, because the seasonal shape drives the gross-operating-profit profile.

The Canaries’ year-round winter-sun profile produces a smoother GOP curve than the Balearics or Costa del Sol, where profit concentrates in 4-5 summer months.
Tools and Templates for Spanish Resort Modeling
Building a credible Spanish resort pro forma requires a model that handles the board-plan rate ladder, the all-inclusive revenue build, the labor-led cost stack, and the three-scenario sensitivity in one integrated structure. Generic hotel models typically lack the board-plan decomposition and the cluster-specific seasonality that the Spanish resort sector demands.
The EFM Hospitality Financial Model Bundle provides an integrated starting point for resort and hotel underwriting, covering revenue build, cost stack, and return scenarios. For investors and developers who need a broader set of hospitality templates, the EFM Hospitality Financial Model Template Bundle covers multiple asset types and structures. Analysts building market-entry or feasibility models can also draw on the EFM Market Studies library for comparable sector benchmarks.
Frequently Asked Questions
What is RevPAR and why does it matter more than occupancy for Spanish resorts?
RevPAR (revenue per available room) equals ADR multiplied by occupancy rate. It matters more than occupancy alone because a resort can have 84% occupancy at a €100 ADR (RevPAR of €84) or at a €150 ADR (RevPAR of €126) — a 50% difference in revenue from the same number of guests. In Spain’s island clusters, where peak occupancy is already in the mid-80s and supply is capped by regulation, the only meaningful growth lever is rate. The EFM Base Case projects island RevPAR of roughly €120–130 in 2025 growing at approximately 4.5% per year through 2031, reaching approximately €150–160 by the end of the forecast window. Anchoring a model on occupancy growth in this market produces a systematically optimistic revenue forecast.
How does the all-inclusive plan actually improve resort economics?
The all-inclusive plan converts uncertain, leak-prone à la carte spend into a single high rate booked in advance, internalizing food, most beverages, and many activities. The operator controls most points of sale on an AI resort, so capture rates are high and spend is predictable. In the worked example above, a 300-room island resort running a blended AI ADR of €174 at 84% occupancy generates a TRevPAR (total revenue per available room) of approximately €184, compared to roughly €109 for a comparable bed-and-breakfast resort — a 69% uplift. The trade-off is that the resort carries the consumption and cost-of-delivery risk, so the model must attach a realistic capture rate and cost-of-sales ratio to each revenue line (rooms, food, beverage, spa, activities) rather than assuming the full AI rate flows to the bottom line.
What does the Balearic containment decree mean for investors?
The Balearic Decree-Law 4/2025 bans the creation of new tourist accommodation in multi-family dwellings and holds the total number of tourist places flat, while a Menorca moratorium suspends new licenses pending a carrying-capacity study. For investors, this means two things. First, new competing supply is gated, which protects occupancy and rate in licensed resort hotels already operating in the islands. Second, greenfield development is effectively off the table in most locations, making repositioning and quality upgrade of existing assets the dominant value-creation route. The 2025 investment surge — €4.28 billion nationally, with the resort segment taking 55% — reflects exactly this dynamic: capital is flowing into acquisition and repositioning, not new build.
What are the main risks to the Spanish resort investment thesis?
Four risks dominate the 2026–2031 horizon. First, source-market concentration: the UK, Germany, and Nordics account for the majority of demand across all three clusters, so a single-market shock (recession, airfare spike, geopolitical event) hits the sector hard. Second, the labor-led cost stack: the SMI rose 61% between 2018 and 2026 to €1,221 per month, and sector convenios push effective wages higher still — in a labor-intensive all-inclusive resort, this compounds every year. Third, climate and water stress: Tenerife declared a drought emergency in 2024 and extended it into 2025, and Mediterranean summer heat is intensifying. Fourth, regulatory risk cuts both ways — the containment decrees are a supply-side benefit today, but a more aggressive policy direction could constrain hotel operations or raise the eco-tax. The prudent model stress-tests rate, arrivals, and cost together against all four risks simultaneously.
How should I model the three clusters differently?
The Canary Islands, Balearic Islands, and Costa del Sol have materially different cash-flow shapes that require separate models. The Canaries run high occupancy year-round on the winter-sun market (British, German, and Nordic demand through the Northern-Hemisphere winter), producing a smoother revenue profile and lower seasonal risk. The Balearics and Costa del Sol are sharply summer-peaked, with demand concentrated from May to September and a disproportionate share of gross operating profit earned in a few months. The Costa del Sol also has a meaningful domestic Spanish shoulder-season market. Modeling all three clusters with the same annual occupancy and ADR assumptions produces a revenue forecast that is wrong for all three. Build each cluster month by month, because the seasonal shape drives the gross-operating-profit profile and the cash-flow timing.
What investment returns can a Spanish resort realistically achieve?
Returns vary significantly by asset type and strategy. Stabilized prime resort net yields (cap rates, defined as net operating income divided by asset value) run approximately 4.5–5.5% in the Base Case, based on Colliers, Cushman and Wakefield, and Savills data. Value-add and repositioning strategies — acquiring a scarce, well-located asset and moving it up the premiumization ladder to adults-only, premium AI, or luxury — target approximately 8–11% returns, reflecting execution and ramp risk. New resort development IRRs run approximately 11–16%, reflecting construction risk, ramp risk, and the regulatory constraints on new build. The €430 million Resort Mare Nostrum deal in Tenerife, the largest single hotel-asset transaction in Spain’s history, illustrates how much capital is chasing the repositioning thesis at the top of the market.
Which operators dominate Spain’s resort and all-inclusive sector?
The supply side is dominated by Spanish resort groups that built and scaled the all-inclusive model, with international luxury brands entering selectively at the top. RIU ended 2025 with 100 hotels and 54,412 rooms and is the sun-and-beach all-inclusive leader in the islands. Meliá Hotels International runs the broadest portfolio through its Sol, Meliá, and Paradisus brands and has shifted toward premium and luxury, which now account for 63% of its portfolio. Barceló operates approximately 300 hotels worldwide through Barceló, Occidental, and Allegro. Iberostar, rooted in Mallorca and still owned by the Fluxá family, leads on sustainability positioning. H10, Hipotels, and Lopesan hold deep island and Costa del Sol positions. International groups including Marriott, Hilton, Accor, and Four Seasons are entering the luxury tier, particularly on the Costa del Sol, intensifying brand competition at the top of the market.
Conclusion
Spain’s resort and all-inclusive sector enters the 2026–2031 window with a structural advantage that few mature leisure markets can claim: demand is large and internationally sourced, supply is policy-capped, and the market has decisively shifted from volume to rate. The €4.28 billion investment surge of 2025, the record €430 million single-asset deal, and the 61% rise in the minimum wage since 2018 all point to the same conclusion: this is a rate-and-capture business, and the models that treat it as an occupancy business will systematically undervalue the premium tier and underestimate the cost stack.
The analyst’s job is to build the board-plan rate ladder explicitly, decompose the all-inclusive revenue build line by line, grow labor ahead of inflation, carry the eco-tax and resilience capex as named line items, and model each cluster separately. The opportunity set is unusually attractive precisely because regulation has turned supply discipline into a structural feature, and the clearest play is repositioning: acquiring a scarce, well-located asset and moving it up the premiumization ladder in a supply-constrained, brand-intensifying market.
I recommend starting with the EFM Hospitality Financial Model Bundle to build your Spanish resort pro forma — it provides the integrated revenue build, cost stack, and scenario structure this market demands.























































