
0 ITEMS

Seed Round Financial Model: 7 Components VCs Require

The best financial model for seed round fundraising is a 3-statement, driver-based workbook covering 18 to 36 months at monthly granularity, with explicit unit economics, a hiring plan, and a use-of-funds breakdown that shows exactly how long your runway lasts.
Key Takeaways
- A fundable seed financial model includes 7 non-negotiable components: P&L, balance sheet, cash flow statement, unit economics, hiring plan, runway calculator, and use-of-funds breakdown.
- Project monthly detail for the first 24 months, then quarterly to year 5. Seed models differ from Series A models because you have little or no historical data to anchor projections.
- Seed investors scrutinize 6 core metrics above all others: CAC (customer acquisition cost), LTV (lifetime value), burn rate, months of runway, gross margin, and LTV:CAC ratio.
- The 3 most credible revenue modeling approaches at seed stage are cohort-based projections, bottom-up channel assumptions, and comparable benchmark triangulation.
- The 5 mistakes that kill seed model credibility are: hockey-stick projections without driver logic, ignoring hiring lead times, omitting seasonality, over-optimizing for best-case only, and presenting a single scenario.
- Pre-built templates cut model-build time from an estimated 40+ hours to under 10 hours and reduce structural errors that flag during investor due diligence.
- eFinancialModels offers a Startup Financial Model used by 500+ funded startups, pre-built with all 7 components VCs expect.
What Makes a Seed-Stage Financial Model Different
A seed-stage financial model differs from later-stage models because it must project forward almost entirely from assumptions, not history. You’re not reporting what happened. You’re making a credible argument for what will happen, and every number needs a defensible driver behind it.
At Series A, investors expect 12 to 24 months of operating data. At seed, they know you may have zero revenue. What they’re evaluating is the quality of your thinking, not the precision of your forecast.
This changes everything about how you build the model. You can’t anchor growth rates to your own historical trend. Instead, you anchor them to market data, comparable companies, and a bottom-up logic that shows how each dollar of spend converts to revenue.
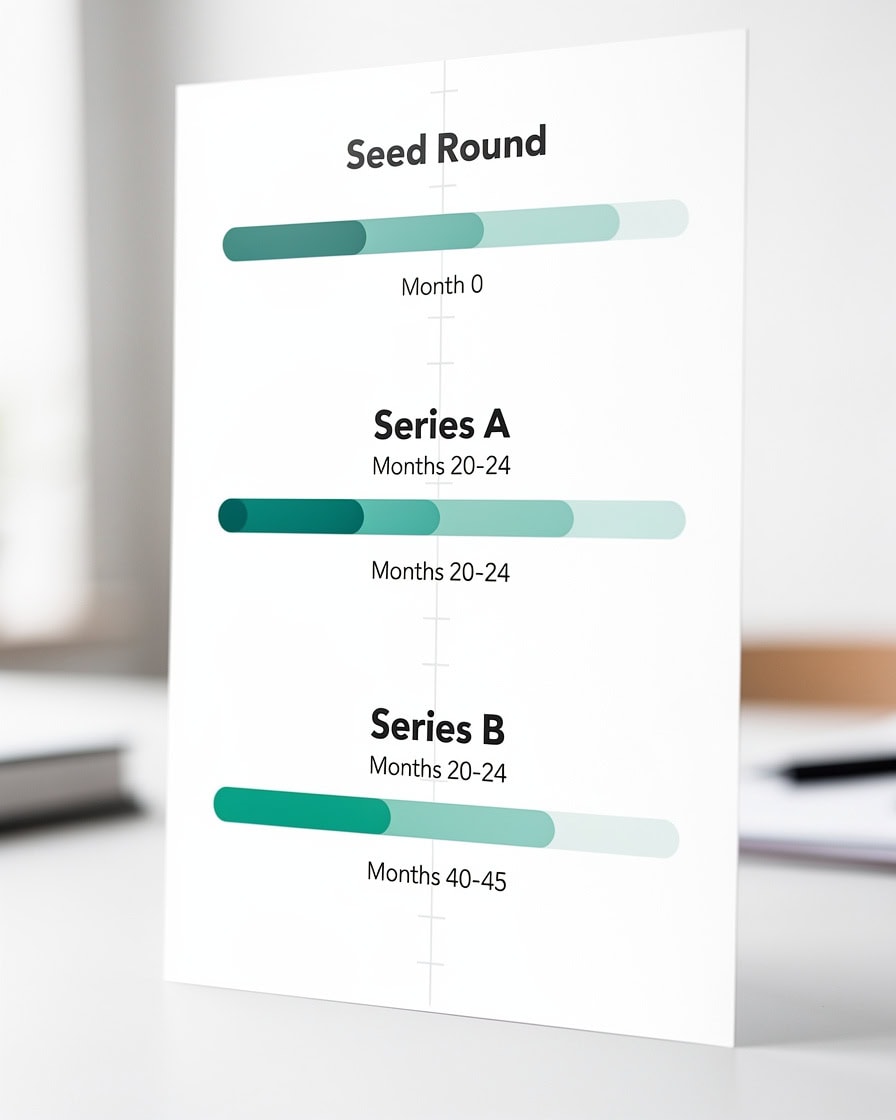
Seed models project forward from assumptions, not history. Every growth rate must trace back to a specific, defensible driver.
The 7 Non-Negotiable Components of a Fundable Seed Financial Model
Every investor-ready seed financial model must contain these 7 components. Missing even one signals inexperience and creates friction in due diligence.
1. Profit and Loss Statement (P&L): The P&L, also called the income statement, shows revenue minus expenses to arrive at net profit or loss. At seed stage, you’ll almost certainly show losses. That’s expected. What matters is that the path to profitability is visible and logical.
2. Balance Sheet: The balance sheet shows what the company owns (assets), what it owes (liabilities), and what’s left for shareholders (equity) at a point in time. Seed investors use it to verify that your cash position matches your cash flow statement.
3. Cash Flow Statement: This tracks actual cash moving in and out of the business each month. It’s the most important statement for seed investors because it shows your burn rate (how much cash you spend per month) and runway (how many months until you run out of money).
4. Unit Economics: Unit economics means the revenue and cost associated with a single customer or transaction. The two headline metrics are CAC (how much it costs to acquire one customer) and LTV (the total revenue you expect from that customer over their lifetime).
5. Hiring Plan with Salaries: A month-by-month schedule of every planned hire, their role, start date, and fully-loaded cost (salary plus benefits plus payroll taxes, typically 1.2 to 1.3 times base salary). Hiring is usually the largest expense driver at seed stage.
6. Runway Calculator: A simple output that shows how many months of cash remain under your base, upside, and downside scenarios. Investors want to see at least 18 months of runway post-raise.
7. Use-of-Funds Breakdown: A clear allocation of the seed capital you’re raising across categories: product development, sales and marketing, hiring, operations, and a contingency buffer. This tells investors you’ve thought carefully about capital efficiency.
You can build all 7 components using the financial model templates available at eFinancialModels, or start from the dedicated Startup Financial Model template.
Time Horizons and Granularity: How Far Out to Project
For seed stage, project monthly for the first 24 months and quarterly from months 25 through 60 (5 years total). This structure gives investors the near-term detail they need to stress-test your assumptions while showing you understand the longer arc of the business.
Series A models typically start with 12 to 24 months of actuals and project 3 to 5 years forward. Seed models have no such anchor. Monthly granularity in the first two years is critical because it reveals cash pinch points that annual or quarterly views hide. A company might look fine on an annual basis but run out of cash in month 14 if a key hire is delayed or a sales cycle takes longer than expected.
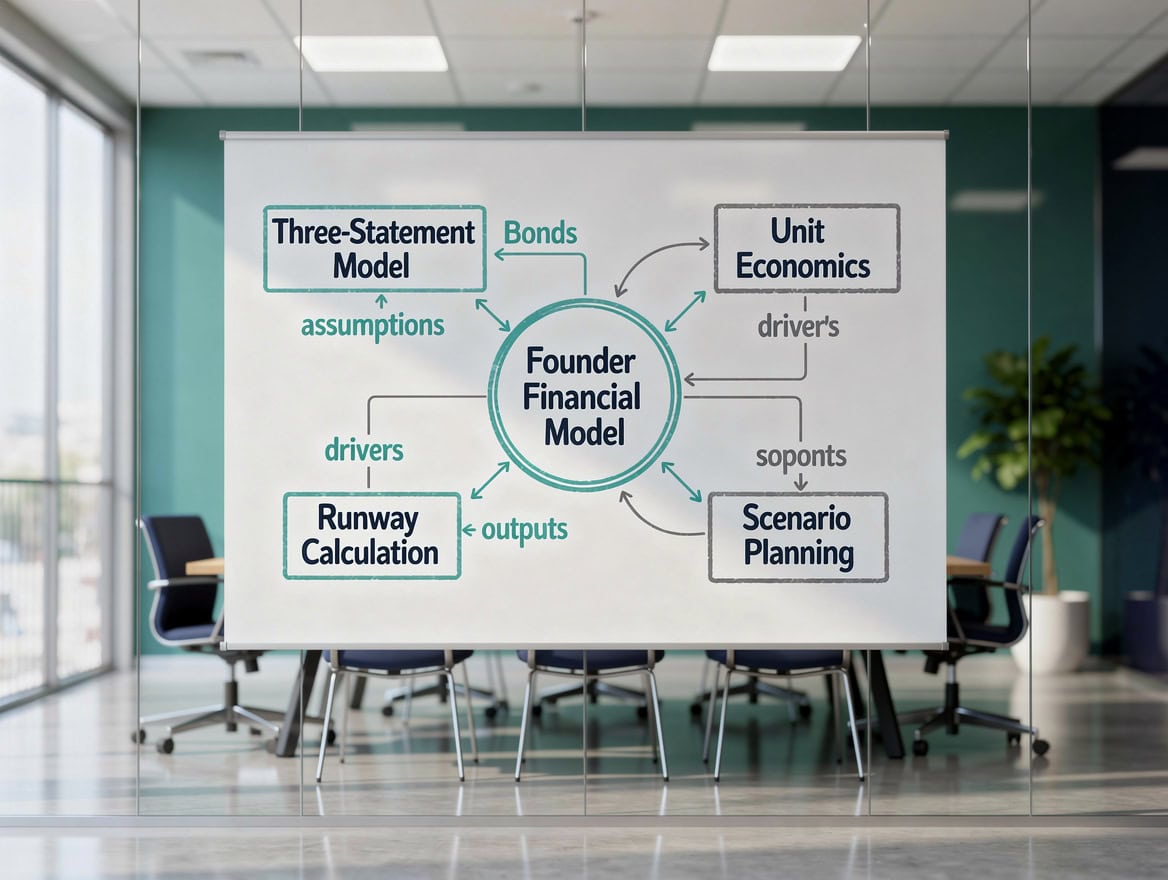
Monthly granularity in the first 24 months reveals cash pinch points that quarterly or annual views hide entirely.
Modeling Revenue Before Product-Market Fit
You can build a credible revenue model at seed stage even with zero customers. The key is using a bottom-up, driver-based approach rather than top-down market share assumptions.
Three frameworks investors accept:
Cohort-based projection: Define your acquisition channels (paid search, outbound sales, partnerships). Assign a monthly volume of new customers per channel, a conversion rate, and an average contract value. Model each monthly cohort separately, applying churn (the percentage of customers who cancel each month) to show how revenue compounds or decays over time.
Bottom-up channel model: Start with your sales team headcount. Assign each salesperson a ramp period (typically 3 to 6 months before full productivity), a quota, and an attainment rate. Revenue is the output of headcount times attainment, not a top-down percentage of a market.
Benchmark triangulation: Use publicly available data from comparable companies at similar stages.
Anchoring your assumptions to published benchmarks makes them defensible.
The rule: every growth rate in your model must trace back to a specific driver. “We assume 15% month-over-month growth” is not a driver. “We plan to hire 2 SDRs in month 3, each generating 8 qualified opportunities per month at a 25% close rate and $12,000 ACV” is a driver.
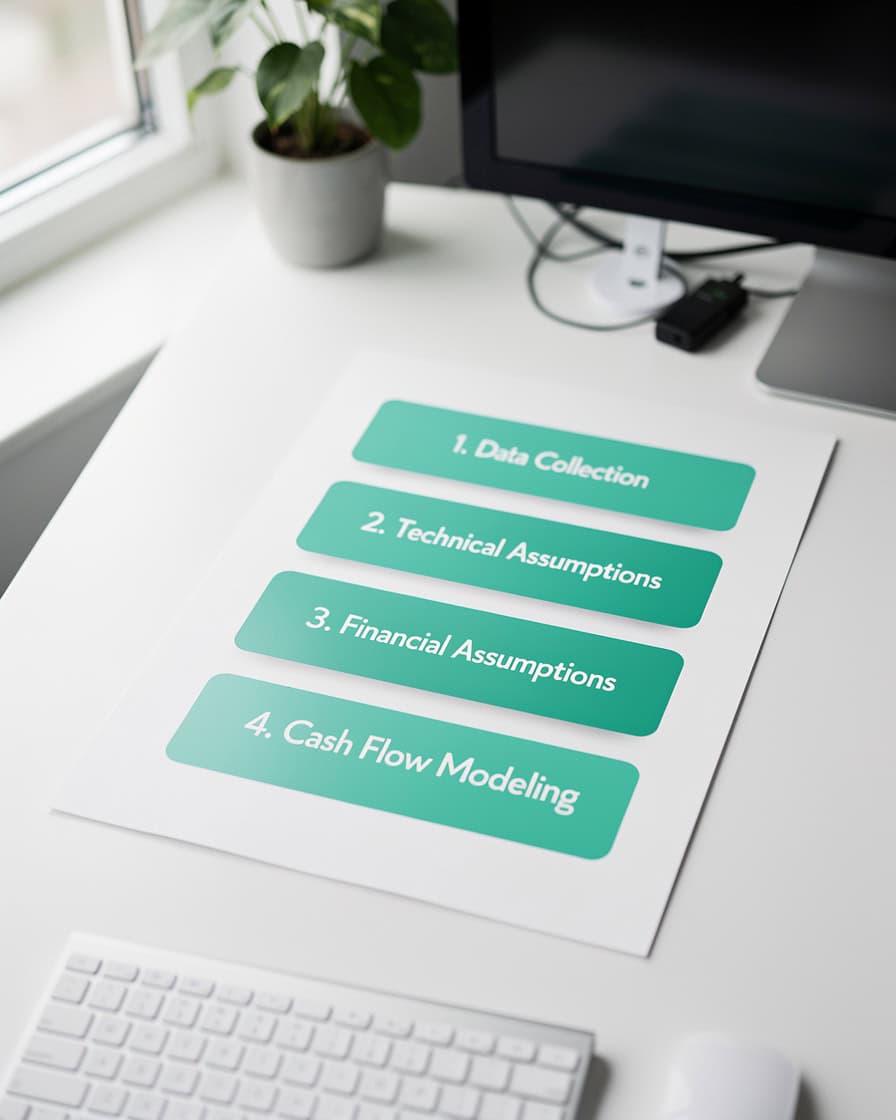
Three frameworks investors accept for pre-traction revenue modeling: cohort-based, bottom-up channel, and benchmark triangulation.
Unit Economics and Key Metrics Seed Investors Scrutinize
Seed investors focus on 6 metrics above all others. Surface these on a dedicated KPI dashboard tab in your model so they’re impossible to miss.
| Metric | Definition | Seed-Stage Benchmark |
|---|---|---|
| CAC | Cost to acquire one customer | Varies by channel; LTV:CAC must be 3:1+ |
| LTV | Lifetime revenue per customer | LTV = ARPU / Churn Rate |
| LTV:CAC Ratio | Return on customer acquisition spend | 3:1 minimum; 5:1 strong |
| Gross Margin | Revenue minus direct costs, as % | SaaS: 70-80%; Marketplace: 40-60% |
| Monthly Burn | Net cash outflow per month | Typically $50K-$200K at seed |
| Runway | Months of cash remaining | 18+ months post-raise target |
Tracking these KPIs in a dedicated dashboard tab is standard practice in investor-ready models. Investors should be able to open your model and find these numbers within 30 seconds.

Investors should find all 6 headline KPIs within 30 seconds of opening your model. A dedicated dashboard tab makes this possible.
Building Your Hiring Plan and Burn Rate Model
Your hiring plan is the single biggest lever in your burn rate model. Build it first, before you model revenue, because headcount drives most of your costs.
Here’s the step-by-step process:
- List every role you plan to hire in the next 24 months, with a target start month.
- Assign a base salary to each role using market data (Levels.fyi for tech roles, BLS Occupational Employment Statistics for broader benchmarks).
- Multiply base salary by 1.25 to get fully-loaded cost (accounting for payroll taxes, benefits, and equipment).
- Sum all fully-loaded costs by month to get your total people cost.
- Add non-headcount operating expenses: software subscriptions, office space, marketing spend, legal and accounting fees.
- Subtract total monthly expenses from your starting cash balance to produce a month-by-month cash balance. The month that balance hits zero is your runway end date.
Worked Example:
Assume you raise $1.5M in seed funding. Your starting cash is $1.5M.
- Month 1: Hire 2 engineers at $120K base each. Fully-loaded: $120K x 1.25 x 2 / 12 = $25,000/month.
- Month 3: Hire 1 head of sales at $100K base. Fully-loaded: $100K x 1.25 / 12 = $10,417/month.
- Non-headcount expenses: $15,000/month (software, legal, marketing).
- Month 1-2 burn: $25,000 + $15,000 = $40,000/month.
- Month 3+ burn: $40,000 + $10,417 = $50,417/month.
- Runway: $1,500,000 / $50,417 = approximately 29.7 months.
This gives you roughly 30 months of runway before adding any revenue, which is a strong position for a seed raise.
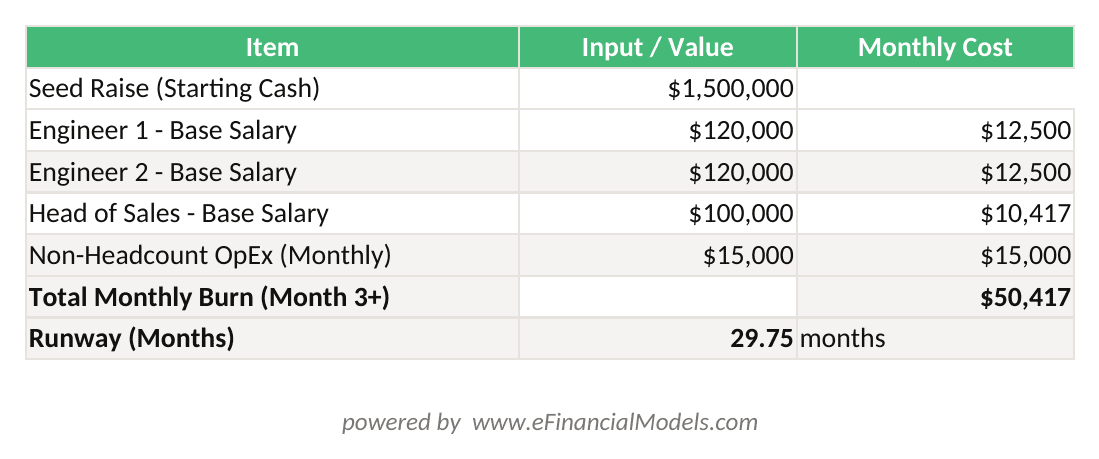
Runway = Starting Cash / Monthly Burn. With $1.5M raised and $50,417/month burn from month 3 onward, this model shows approximately 29.7 months of runway.
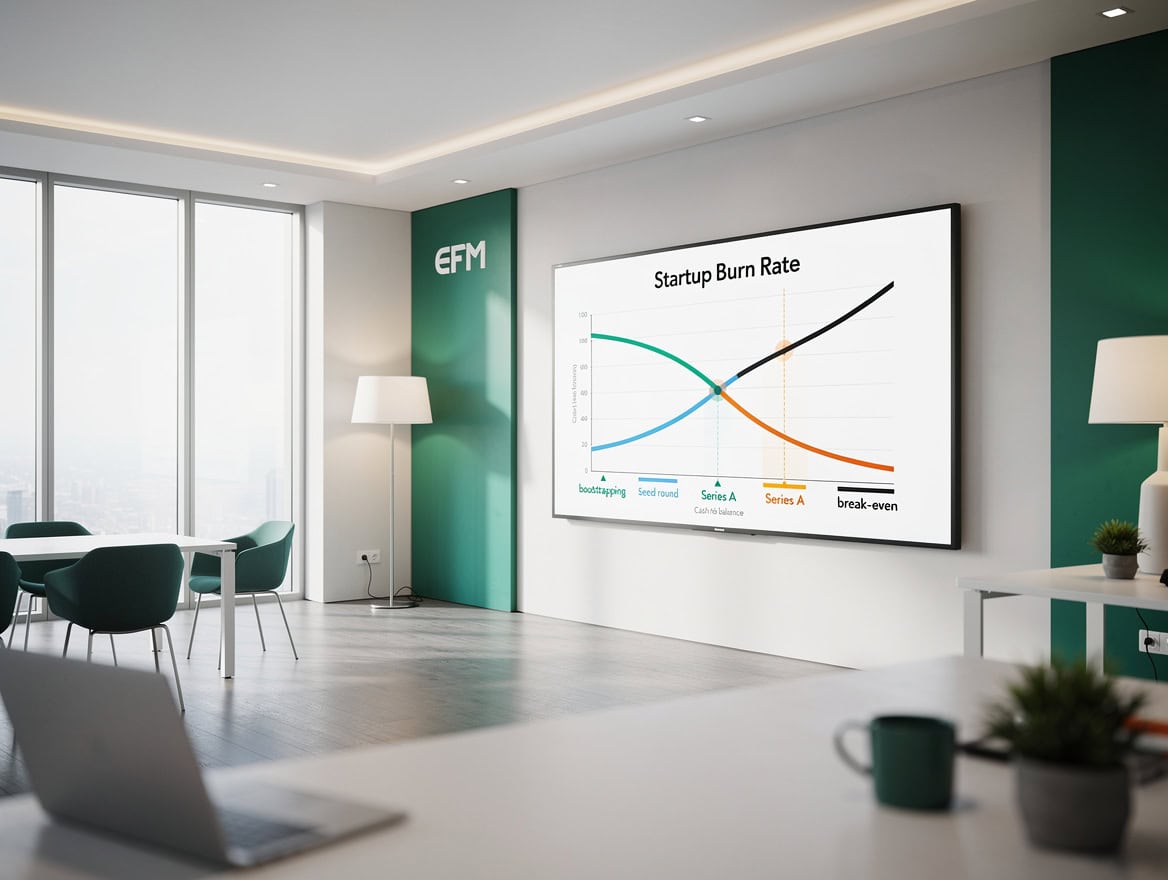
Build your hiring plan first. Every new hire adds to monthly burn immediately, but revenue contribution lags by 3 to 6 months for sales roles.
The 5 Biggest Seed Financial Modeling Mistakes
These 5 mistakes appear in the majority of seed models that fail investor scrutiny. Each one is fixable.
Mistake 1: Hockey-stick projections without driver logic. A revenue curve that goes flat for 6 months then suddenly triples is a red flag unless you can explain exactly what changes in month 7. Fix: every inflection point in your model must correspond to a specific event (a new hire reaching full productivity, a marketing campaign launching, a partnership going live).
Mistake 2: Ignoring hiring lead times. Founders often model a new VP of Sales starting in month 2, then generating revenue in month 3. In reality, executive searches take 3 to 5 months, and sales reps take 3 to 6 months to ramp. Fix: add a 2-month buffer to every planned hire date and a 4-month ramp period for revenue-generating roles.
Mistake 3: Omitting seasonality. B2B SaaS companies typically see slower sales in July, August, and December. Consumer businesses spike in Q4. Ignoring this makes your monthly projections look unrealistic to any investor who has operated in your sector. Fix: apply a seasonality index to monthly revenue projections based on industry benchmarks.
Mistake 4: Presenting only a best-case scenario. A model with a single scenario tells investors you haven’t stress-tested your assumptions. Fix: build 3 scenarios (base, upside, downside) with clearly labeled assumption sets. The downside scenario should still show a path to your next milestone.
Mistake 5: Over-engineering the model. A 47-tab model with circular references and macros that only you understand is worse than a clean 8-tab model. Fix: prioritize clarity over complexity. Every formula should be traceable, every assumption labeled.
Template vs. Custom Build: Choosing the Right Approach
For most first-time founders, a pre-built template is the right choice. Building a seed financial model from scratch takes an estimated 40 or more hours for someone without financial modeling experience, and the structural errors introduced during that process (broken 3-statement links, incorrect cash flow logic, circular references) are exactly the kind of issues that surface during investor due diligence. Excel supports up to 64 levels of nested functions.
Source: Microsoft Support, Excel specifications and limits
This means complex driver-based models can be built entirely within native Excel formulas without macros — but only if the structural framework is sound from the start.
| Factor | Pre-Built Template | Custom Build |
|---|---|---|
| Build Time | 5-10 hours | 40-80 hours |
| Structural Errors | Low (pre-tested) | High (founder-built) |
| Investor Familiarity | High (standard format) | Variable |
| Flexibility | Moderate | High |
| Cost | $50-$500 | $2,000-$10,000 (consultant) |
| Best For | First-time founders | Complex business models |
Excel remains the standard for investor due diligence data rooms. Google Sheets is acceptable for early sharing and collaboration, but most institutional investors will request an Excel file before closing.
If you build in Google Sheets, ensure your model exports cleanly to Excel without broken formulas.
The eFinancialModels Startup Financial Model template includes all 7 components described above, pre-built with 3-statement integration, a unit economics calculator, scenario planning, and a KPI dashboard. For SaaS-specific businesses, the financial projections templates include MRR waterfall, churn modeling, and cohort analysis built in.
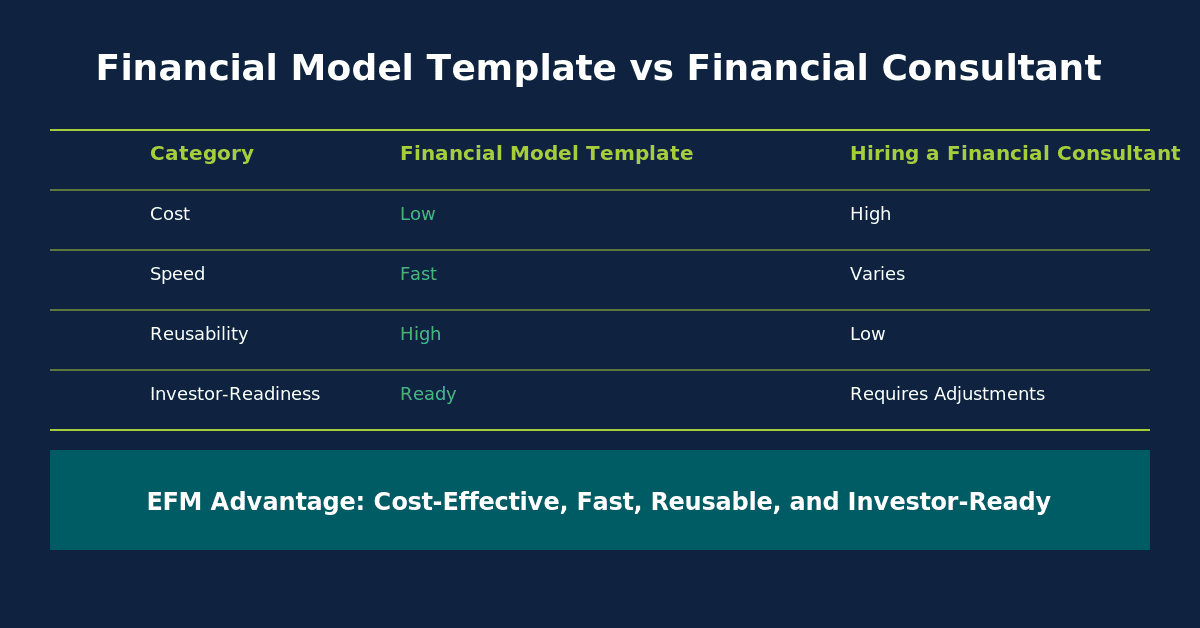
Your financial model needs two versions: a clean summary slide for pitch decks and a full workbook for investor due diligence data rooms.
How to Present Your Model: Pitch Deck vs. Data Room
Your financial model serves two different purposes at two different stages of the fundraising process, and you need two different versions.
Pitch deck version: A single slide showing 5-year revenue, gross margin, and EBITDA projections in a simple bar or line chart, plus 3 to 4 headline KPIs (burn rate, runway, LTV:CAC, gross margin). This is not the place for detailed assumptions. It’s the place to show the shape of the business and prompt a follow-up conversation.
Data room version: The full workbook, including all 7 components, 3 scenarios, a clearly labeled assumption tab, and a KPI dashboard. Investors will spend 30 to 90 minutes in this file during due diligence. Every formula must work, every assumption must be labeled, and the model must be navigable by someone who has never seen it before. Excel’s maximum worksheet size is 1,048,576 rows by 16,384 columns.
Source: Microsoft Support, Excel specifications and limits
So even the most granular monthly cohort model will never run into structural size constraints.
A practical rule: if an investor has to ask you how to use your model, the model isn’t ready for the data room.
Step-by-Step: Building Your Seed Financial Model in One Week
You can build a complete, investor-ready seed financial model in 5 working days using this sequence. Start with the constraints (cash and time), then build outward to revenue.
Day 1: Use-of-Funds and Runway Target. Decide how much you’re raising and what you need to achieve before your next raise (your next milestone). Allocate the raise across categories: typically 50 to 60% to headcount, 20 to 30% to sales and marketing, 10 to 15% to operations and infrastructure, and 5 to 10% as a contingency buffer.
Day 2: Hiring Plan. List every planned hire for 24 months. Assign start dates, base salaries, and fully-loaded cost multipliers. This becomes the foundation of your expense model.
Day 3: Unit Economics. Define your CAC by channel, your average contract value or transaction value, your gross margin per unit, and your churn rate. Calculate LTV = (Gross Margin per Customer) / (Monthly Churn Rate). Verify your LTV:CAC ratio exceeds 3:1.
Day 4: Revenue Projection. Build your bottom-up revenue model using one of the 3 frameworks described above. Connect revenue to your hiring plan (sales headcount drives pipeline, pipeline drives revenue).
Day 5: 3-Statement Integration and Scenarios. Connect your revenue and expense assumptions into a P&L. Build the balance sheet and cash flow statement. Add your base, upside, and downside scenarios. Verify that your ending cash balance in the cash flow statement matches your balance sheet cash line in every month.
Using a financial model template compresses this timeline significantly because the 3-statement integration is already built and tested.
Frequently Asked Questions
What is the best financial model for seed round fundraising?
The best financial model for seed round fundraising is a driver-based, 3-statement integrated workbook that covers 24 months at monthly granularity and includes unit economics, a hiring plan, a runway calculator, and a use-of-funds breakdown. eFinancialModels’ Startup Financial Model template is specifically designed for this purpose, with all 7 investor-required components pre-built. The model should include 3 scenarios (base, upside, downside) and a KPI dashboard that surfaces CAC, LTV, burn rate, and runway within 30 seconds of opening the file. Investors at seed stage evaluate the quality of your assumptions and the logic of your drivers, not the precision of your numbers.
How many months of runway should my seed model show?
Your seed financial model should show at least 18 months of runway after the raise closes, with 24 months being the target most institutional seed investors prefer. The logic is straightforward: if you raise seed funding and have 18 months of runway, you have roughly 12 months to hit your Series A milestones before you need to start fundraising again (fundraising itself takes 3 to 6 months). A model showing less than 15 months of runway post-raise will prompt investors to question whether the raise size is sufficient or whether your burn rate assumptions are too aggressive. Always show runway under your downside scenario, not just your base case.
How do I model revenue at seed stage with no customers?
Model revenue at seed stage using a bottom-up, driver-based approach. Start with your acquisition channels, assign a monthly volume of leads or prospects per channel, apply a conversion rate to get new customers, and multiply by your average contract value or transaction value. For example: 500 website visitors per month x 2% trial conversion x 30% trial-to-paid conversion x $200/month ACV = $600 in new MRR per month from organic traffic. Layer in each channel separately. Anchor your conversion rate assumptions to published benchmarks for your sector. According to OpenView Partners’ SaaS benchmarks, median free-to-paid conversion rates for PLG (product-led growth) SaaS companies range from 2% to 5%, which gives you a defensible range to work within.
What is a good LTV:CAC ratio for a seed-stage startup?
A good LTV:CAC ratio for a seed-stage startup is 3:1 or higher, meaning the lifetime value of a customer is at least 3 times the cost to acquire them. A ratio of 5:1 or above is considered strong and signals efficient unit economics. LTV:CAC below 3:1 suggests your business model may not be economically viable at scale, which is a significant red flag for seed investors. To calculate LTV, divide your gross margin per customer by your monthly churn rate. For example: if a customer pays $200/month, your gross margin is 70%, and monthly churn is 2%, then LTV = ($200 x 0.70) / 0.02 = $7,000. If CAC is $1,500, your LTV:CAC ratio is 4.7:1, which is strong for seed stage.
Should I use Excel or Google Sheets for my seed financial model?
Build your seed financial model in Excel if you’re targeting institutional investors, because Excel remains the standard format for due diligence data rooms. Google Sheets is acceptable for early-stage sharing and collaboration with advisors or angels, but most institutional seed funds and Series A investors will request an Excel file before closing. If you start in Google Sheets, test your model’s export to Excel before sending it to any investor. Common issues include broken named ranges, formula incompatibilities, and formatting shifts. The eFinancialModels Startup Financial Model template is delivered in Excel format, which eliminates this conversion risk entirely.
How long does it take to build a seed financial model from scratch?
Building a seed financial model from scratch takes an estimated 40 to 80 hours for a founder without financial modeling experience, based on the complexity of the business model and the number of revenue streams. The most time-consuming components are the 3-statement integration (ensuring P&L, balance sheet, and cash flow statement are correctly linked) and the unit economics module. Using a pre-built template from eFinancialModels reduces this to 5 to 10 hours of customization, because the structural framework, formulas, and 3-statement links are already built and tested. The time saved is better spent refining your assumptions and preparing to defend them in investor conversations.
What do seed investors look for in a financial model that most founders miss?
Seed investors most commonly flag three things that founders miss: first, the absence of a downside scenario (presenting only a base or best case signals overconfidence); second, hiring plans that don’t account for ramp time (a new sales hire doesn’t generate revenue on day one, and modeling them as immediately productive is a credibility killer); and third, unit economics that don’t close (an LTV:CAC ratio below 1:1 means you lose money on every customer, which no investor will fund). A fourth common miss is the use-of-funds breakdown: investors want to see a specific allocation, not a vague statement that funds will be used for “growth and operations.” The financial projections framework at eFinancialModels addresses all four of these gaps with built-in prompts and validation checks.
Conclusion
A fundable seed financial model is not about predicting the future with precision. It’s about demonstrating that you understand your business drivers, you’ve stress-tested your assumptions, and you know exactly how long your capital will last. The 7 components outlined here, built in the sequence described, give investors everything they need to say yes.
I recommend downloading the eFinancialModels Startup Financial Model template as your starting point. It includes all 7 investor-required components, a pre-built unit economics calculator, 3-statement integration, and scenario planning tools, and it’s been used by 500+ funded startups to close their seed rounds.























































