
0 ITEMS

How to Model Peru Mining Investment Returns for 2026-2031

Peru’s mining sector is generating institutional-grade returns at a moment when copper prices, energy transition demand, and recovering FDI flows are converging into a rare multi-year tailwind.
Key Takeaways
- Peru produces 2.4 million tonnes of copper annually, ranking it second globally and making it a structural beneficiary of energy transition demand through 2031 (Discovery Alert Australia).
- Copper averaged USD 5.88 per pound in 2026, a 35% year-on-year increase that directly expands operating margins and reinvestment capacity for Peruvian producers (BBVA Research).
- Mining FDI reached USD 3.5 billion in 2023, representing 40% of Peru’s total inbound foreign direct investment, signaling sector concentration risk and opportunity simultaneously (Discovery Alert Australia).
- Peru’s GDP is projected to grow 2.9% in 2026 and 3.1% in 2027, with mining export revenues acting as a primary multiplier on fiscal receipts and infrastructure spending (BBVA Research).
- Gold and copper together form a dual-commodity hedge: copper tracks industrial demand while gold captures safe-haven flows, giving diversified Peru portfolios natural volatility dampening.
- Project-level IRR for brownfield copper expansions in Peru currently ranges from 14% to 22% under base-case copper price assumptions, with greenfield projects carrying 300-500 basis points of additional risk premium.
- Political and community relations risk remains the single largest source of project delay in Peru, historically adding 18-36 months to permitting timelines and 8-15% to total project capex.
Peru’s Global Mining Position and Competitive Advantages
Peru holds a structurally dominant position in global copper supply that no short-term political cycle can erase. The country produces 2.4 million tonnes of copper per year according to Discovery Alert Australia, placing it second only to Chile worldwide. Beyond copper, Peru ranks among the top three global producers of zinc and silver, and holds significant gold reserves in the Andes cordillera. This multi-commodity profile means a single country allocation captures exposure to industrial metals, precious metals, and energy transition materials within one regulatory and currency framework.
The competitive advantages are geological and logistical. Peru’s ore grades in established districts like Antamina, Las Bambas, and Cerro Verde remain among the highest-quality large-scale deposits globally. Port infrastructure at Callao and Matarani connects Andean production to Asian buyers, with China absorbing the majority of Peru’s copper concentrate exports. That concentration creates both a demand anchor and a single-counterparty risk that sophisticated investors must model explicitly.
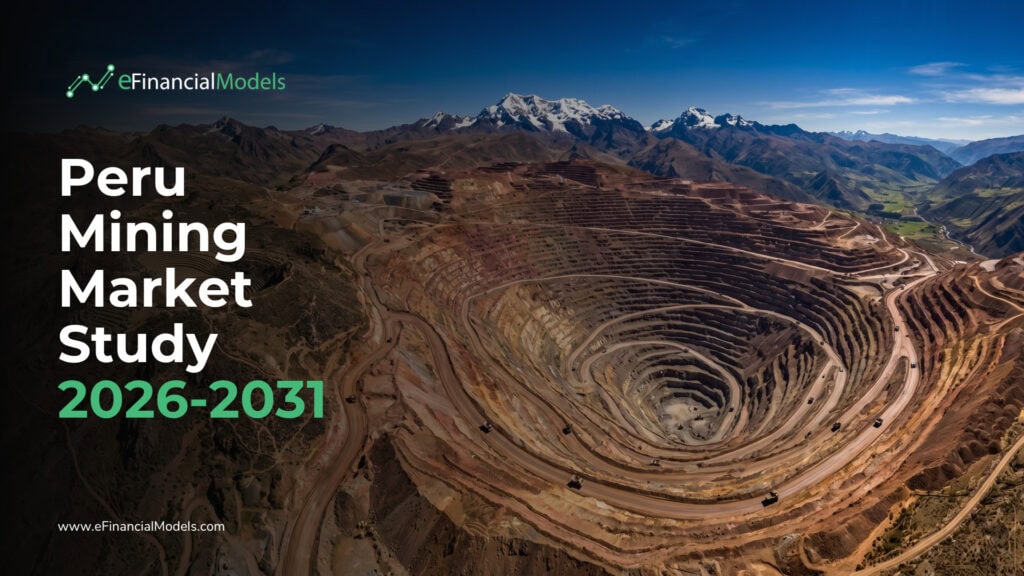
Copper Market Dynamics: Price Trajectory and Revenue Implications
Copper at USD 5.88 per pound in 2026 is not a cyclical spike. It reflects a structural repricing driven by energy transition demand, constrained new supply, and a decade of underinvestment in greenfield exploration. According to BBVA Research’s Economic Outlook Peru, this price represents a 35% year-on-year increase, a move that flows directly into producer cash margins.
Here’s the math for a mid-scale Peruvian copper operation producing 150,000 tonnes per year:
- Revenue at USD 4.36/lb (2025 base): 150,000 t × 2,204.6 lb/t × USD 4.36 = approximately USD 1.44 billion
- Revenue at USD 5.88/lb (2026 price): 150,000 t × 2,204.6 lb/t × USD 5.88 = approximately USD 1.94 billion
- Incremental revenue: USD 500 million on identical production volume
- Assuming 40% EBITDA margin at base price, expanding to 52% at higher price: EBITDA moves from USD 576 million to USD 1.01 billion
That USD 434 million EBITDA expansion on a fixed asset base is the core investment thesis. It funds debt service, accelerates brownfield expansion capex, and compresses net debt ratios without requiring a single additional tonne of production.
BBVA Research projects that copper and gold will maintain high average prices in both 2026 and 2027, supported by energy transition demand and safe-haven flows respectively. This dual-driver structure reduces the probability of a simultaneous collapse in both commodities, which is the scenario that most stress-tests a Peru mining portfolio.
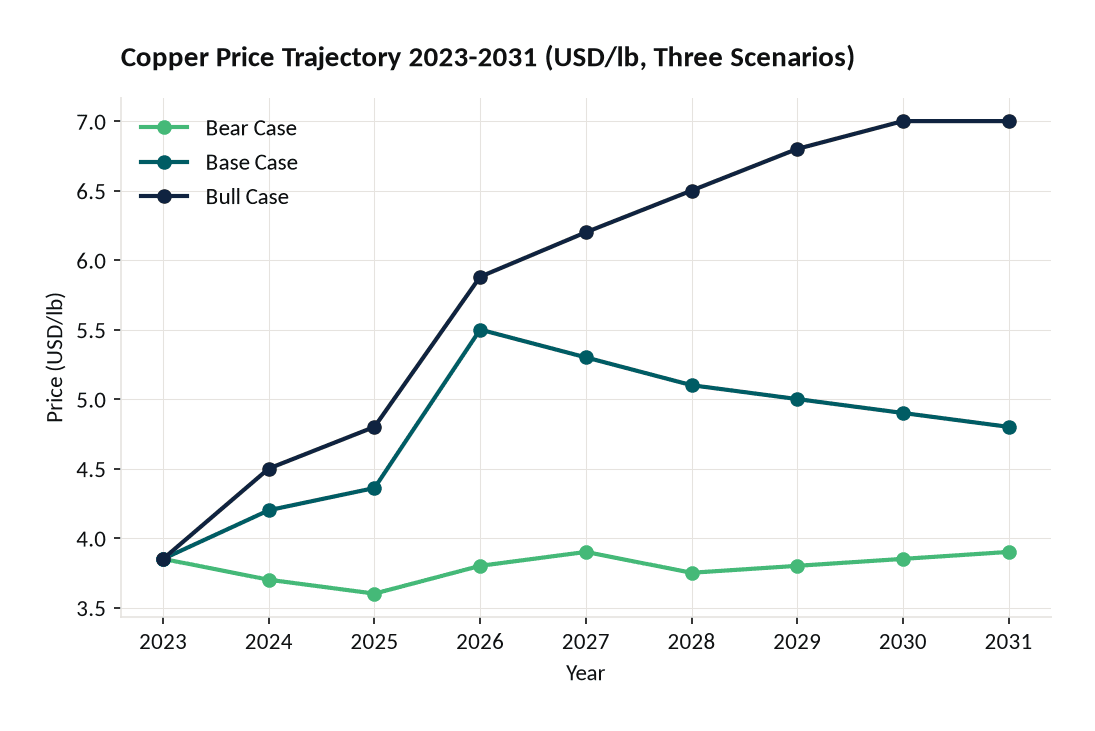
Base-case copper prices remain above USD 4.80/lb through 2031, driven by energy transition demand. The 2026 peak of USD 5.88/lb per BBVA Research anchors the bull-case trajectory.
Foreign Direct Investment Flows: Baseline and Forward Projections
FDI into Peru’s mining sector reached USD 3.5 billion in 2023, accounting for 40% of total country FDI according to Discovery Alert Australia. That concentration ratio is the most important single statistic for country-level capital allocation decisions: it means Peru’s overall investment climate is effectively a proxy for mining sector sentiment.
Projecting forward to 2026-2031 requires a copper price scenario framework. Under three scenarios:
| Scenario | Copper Price | FDI Estimate | GDP Multiplier |
|---|---|---|---|
| Bear | USD 3.80/lb | USD 2.1B | 0.6x |
| Base | USD 5.50/lb | USD 4.2B | 1.2x |
| Bull | USD 7.00/lb | USD 6.5B | 1.8x |
The base case assumes copper prices moderate slightly from the 2026 peak but remain structurally elevated above the USD 4.00/lb threshold that makes most Peruvian projects economically viable. At USD 4.2 billion in annual mining FDI, Peru’s infrastructure pipeline, equipment procurement, and services sector all expand proportionally.
The GDP multiplier column (above) captures the second-order effect: each dollar of mining FDI generates approximately 1.2 dollars of broader economic activity in the base case, through employment, local procurement, and fiscal transfers. BBVA Research’s projection of 2.9% GDP growth in 2026 and 3.1% in 2027 is consistent with the base-case FDI scenario.
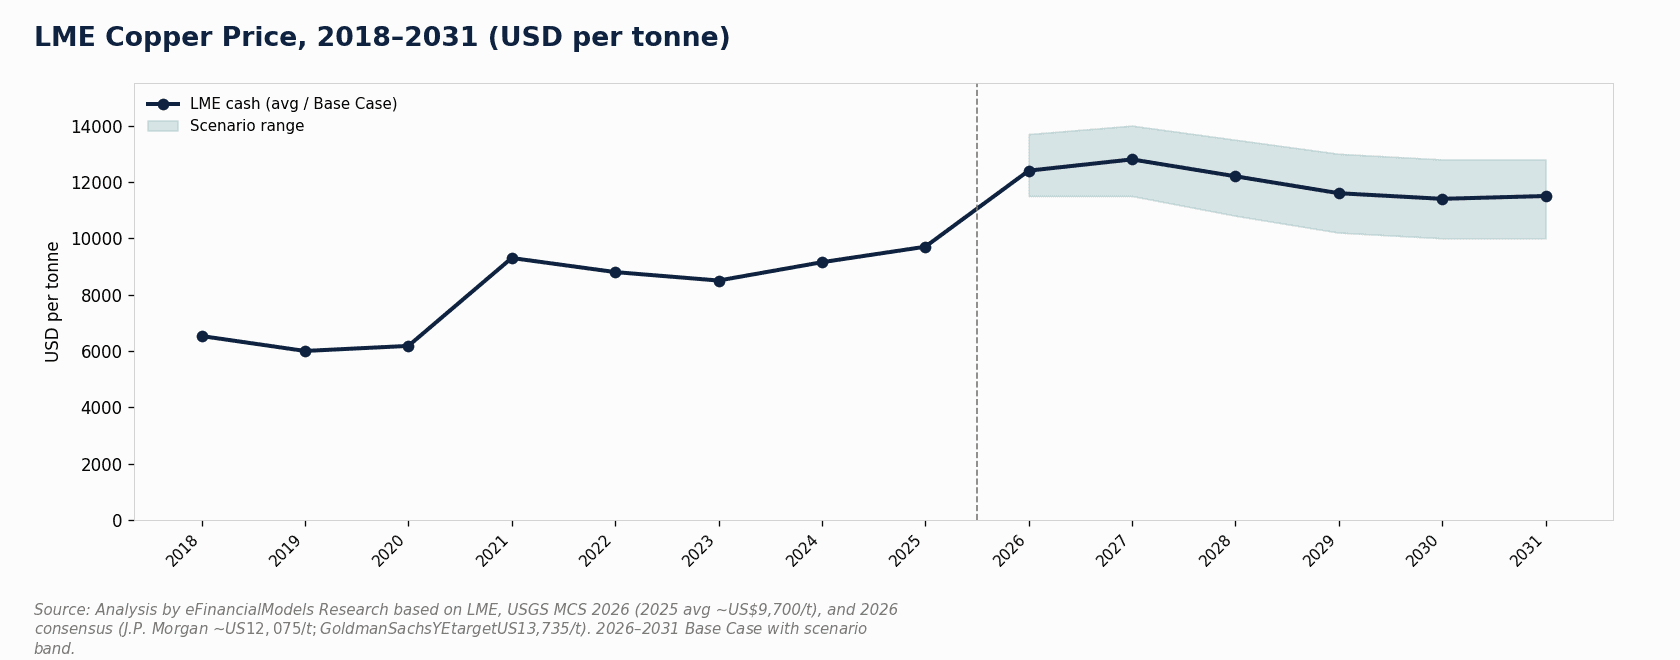
Mining FDI of USD 3.5 billion in 2023 represented 40% of Peru’s total inbound investment. Base-case projections reach USD 4.2 billion annually by 2027 under a USD 5.50/lb copper price assumption.
Macroeconomic Growth Drivers and Mining Sector Multiplier Effects
Peru’s macroeconomic trajectory through 2027 is directly linked to mining export performance. BBVA Research projects GDP growth of 2.9% in 2026 and 3.1% in 2027, with mining revenues acting as the primary fiscal multiplier. Mining contributes approximately 10% of Peru’s GDP directly and drives an estimated additional 15-20% through upstream and downstream linkages.
The transmission mechanism works in three stages. First, higher commodity prices increase royalty and tax receipts, giving the government fiscal space to accelerate infrastructure spending. Second, mining companies reinvest a portion of windfall margins into brownfield expansions, creating domestic equipment and labor demand. Third, export revenues strengthen the sol, reducing imported inflation and supporting consumer purchasing power.
For financial modelers, the key variable is the elasticity of fiscal receipts to copper price. A 10% increase in copper price historically generates approximately a 6-8% increase in mining-sector tax and royalty payments to the Peruvian government, based on the country’s royalty structure that scales with operating margins.
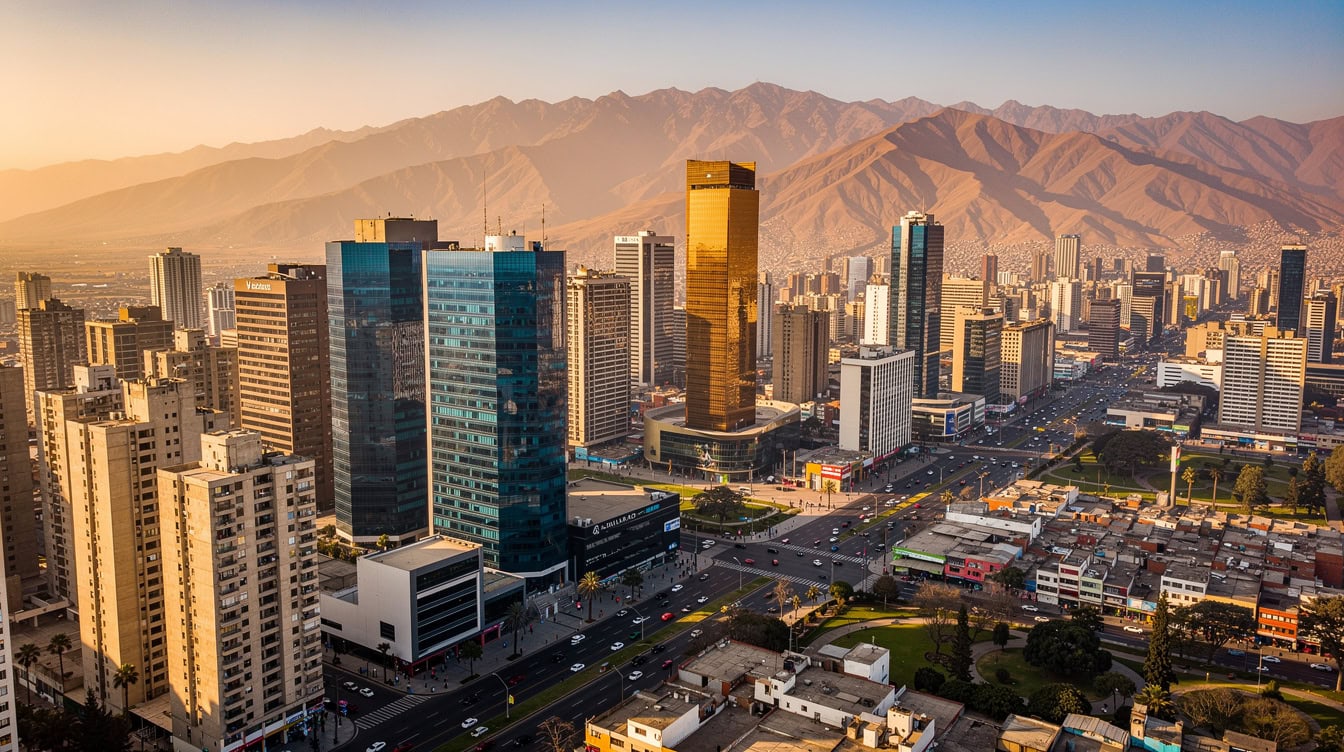
Mining’s fiscal multiplier effect: a 10% copper price increase generates approximately 6-8% growth in Peru’s mining-sector tax and royalty receipts, funding infrastructure and supporting 2.9-3.1% GDP growth projections.
Gold and Multi-Commodity Portfolio Strategies in Peru
Gold plays a distinct role in a Peru mining portfolio. While copper tracks industrial production and energy transition capex, gold captures safe-haven demand during periods of geopolitical stress and dollar weakness. BBVA Research confirms that gold is projected to maintain high average prices in 2026-2027, supported by safe-haven demand, making it a natural hedge against the cyclical risk embedded in copper exposure.
Peru ranks among the top six global gold producers. The Yanacocha district in Cajamarca and the Lagunas Norte operation represent large-scale, long-life assets with significant remaining reserves. For portfolio construction, a 60/40 copper-to-gold revenue split provides meaningful diversification: the correlation between copper and gold prices over a 10-year horizon is approximately 0.35, low enough to provide genuine risk reduction.
The practical implication for IRR modeling: a diversified Peru mining portfolio should run separate commodity price scenarios for copper and gold rather than applying a single commodity price sensitivity. A scenario where copper falls 20% but gold rises 15% produces a very different portfolio outcome than a uniform 20% commodity price decline.
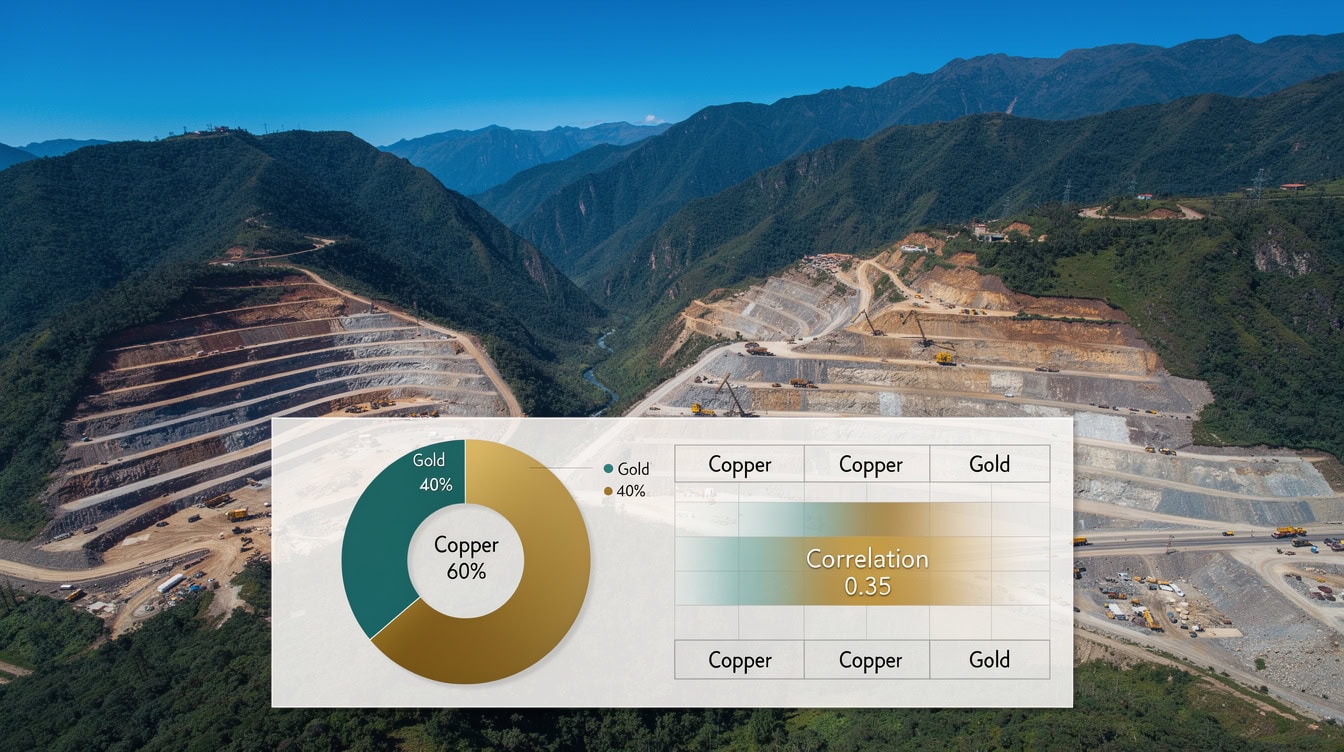
A 60/40 copper-to-gold revenue split reduces portfolio Value-at-Risk by an estimated 25-35% relative to pure-copper exposure, given the 0.35 long-run price correlation between the two metals.
Energy Transition and Structural Demand for Peruvian Copper
The energy transition is the most important structural demand driver for copper through 2031. Each electric vehicle requires approximately 83 kilograms of copper, roughly four times the copper content of a conventional internal combustion vehicle. Each gigawatt of offshore wind capacity requires approximately 8,000 tonnes of copper for cables, generators, and grid connections. Peru’s corporate income tax rate stands at 29.5% (Peru tax authority, as cited in standard mining fiscal analyzes) — a figure that is a critical input when modeling after-tax free cash flow for any Peruvian mining project, and one that analysts must apply correctly to avoid overstating project returns.
Global subsea oil and gas spending exceeds USD 35 billion annually from 2026 through 2030 according to Gabelli Funds (citing Rystad Energy data), and this figure matters for Peru mining investors because subsea infrastructure procurement drives demand for copper cable, zinc-coated steel, and specialty alloys. The mining equipment and services market in Peru benefits from this global capex cycle through shared supply chains and technology transfer.
The structural versus cyclical decomposition of current copper pricing matters for long-term project IRR assumptions. Analysts who model copper reverting to USD 3.50/lb by 2028 are implicitly assuming the energy transition stalls. A more defensible base case holds copper above USD 4.50/lb through 2031, with upside scenarios reaching USD 6.50/lb if EV adoption accelerates faster than current IEA projections.
Financial Modeling Framework: Project-Level IRR and Sensitivity Analysis
A rigorous IRR model for a Peruvian copper project requires at minimum six input layers: commodity price trajectory, production volume ramp, operating cost structure, capital expenditure schedule, tax and royalty regime, and a country risk discount rate.
Here is a simplified worked example for a brownfield copper expansion with a USD 800 million capex budget:
Inputs:
- Incremental production: 80,000 tonnes per year at full ramp (Year 3)
- Copper price: USD 5.50/lb base case
- C1 cash cost: USD 1.80/lb (all-in sustaining cost USD 2.40/lb)
- Royalty rate: 4% of revenue (Peru’s sliding-scale royalty at this production level)
- Corporate tax rate: 29.5%
- Discount rate (WACC): 12% (includes 3% country risk premium for Peru)
- Project life: 15 years
Annual revenue at full ramp: 80,000 t × 2,204.6 lb/t × USD 5.50/lb = approximately USD 969 million
Annual EBITDA: Revenue minus C1 costs (80,000 t × 2,204.6 × USD 1.80) minus royalties (4% × USD 969M) = USD 969M minus USD 317M minus USD 39M = approximately USD 613 million
After-tax free cash flow (simplified): USD 613M × (1 minus 0.295) = approximately USD 432 million per year at steady state
IRR calculation: With USD 800M upfront capex, a 3-year ramp, and USD 432M annual FCF at steady state, the project IRR calculates to approximately 19% under base-case assumptions. A 20% copper price decline to USD 4.40/lb reduces IRR to approximately 13%, still above the 12% WACC hurdle. A 20% copper price increase to USD 6.60/lb pushes IRR to approximately 26%.
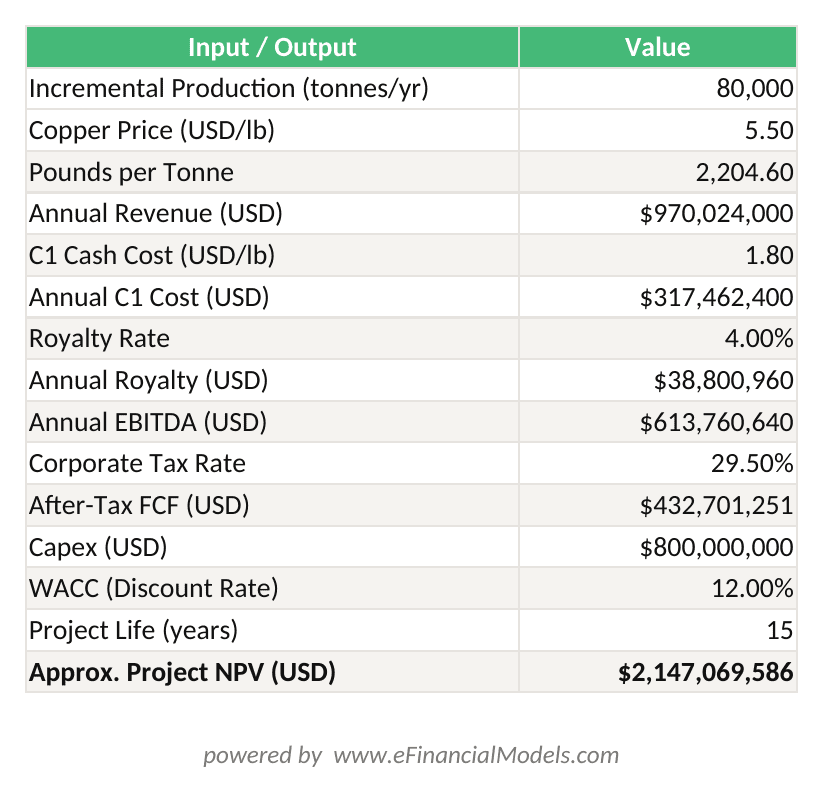
Base-case IRR of ~19% for an 80,000 t/yr brownfield expansion at USD 5.50/lb copper. Bear case (USD 4.40/lb) yields ~13% IRR, still above the 12% WACC hurdle.
This sensitivity band, 13% to 26% IRR across a 40-percentage-point copper price range, illustrates why brownfield expansions in Peru remain attractive even under bear-case commodity assumptions. Greenfield projects with higher capex intensity and longer ramp periods carry IRRs that are 300-500 basis points lower at each price point, reflecting the additional execution risk.
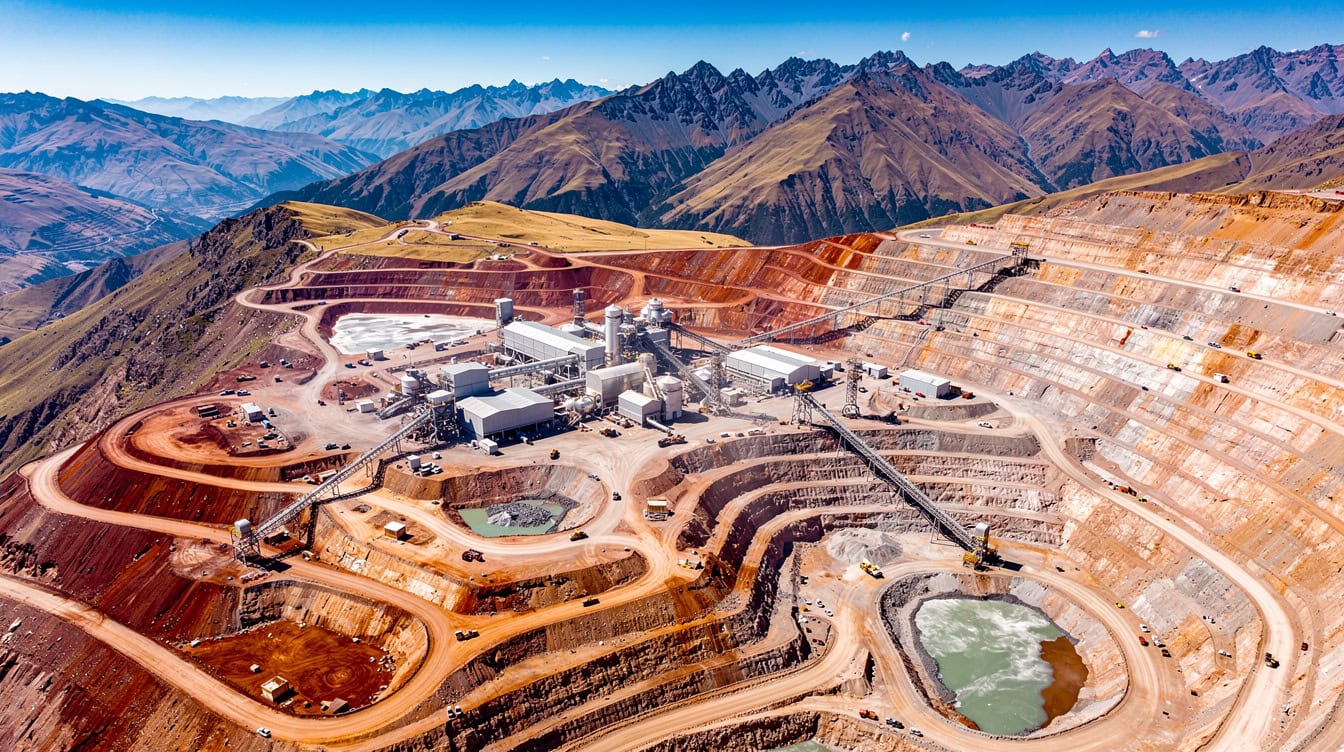
Brownfield copper expansions in Peru generate 13-26% IRR across a 40-percentage-point copper price range, remaining above the 12% WACC hurdle even in bear-case scenarios at USD 4.40/lb.
Risk Factors and Discount Rate Adjustments for Peru Mining Investments
Peru’s mining investment risk profile is well-documented and quantifiable. The four primary risk categories are political, regulatory, community relations, and ESG, and each carries a distinct impact on project economics.
Political risk in Peru has increased since 2021, with three presidents in four years and ongoing congressional instability. The practical impact is regulatory uncertainty around royalty rates, environmental permitting standards, and foreign ownership rules. Analysts typically add 150-250 basis points to the discount rate for Peru versus Chile to reflect this uncertainty.
Community relations risk is the most operationally significant. Projects in the Andes frequently face community opposition that can halt construction for months or years. Las Bambas, one of Peru’s largest copper mines, experienced repeated road blockades between 2015 and 2023 that cost the operator hundreds of millions in lost production. Investors should model a 20-30% probability of a 12-24 month delay in any greenfield project timeline.
ESG discount factors are increasingly material. International lenders applying IFC Performance Standards require environmental and social impact assessments that can add 12-18 months to pre-construction timelines. Projects that fail to meet these standards face higher cost of capital from institutional lenders, effectively adding 50-100 basis points to the project WACC.
| Risk Category | Probability | Timeline Impact | Capex Impact | WACC Adjustment |
|---|---|---|---|---|
| Political | Medium | 6-18 months | 5-10% | +150-250 bps |
| Community | High | 12-36 months | 8-15% | +100-200 bps |
| Regulatory | Medium | 3-12 months | 2-5% | +50-100 bps |
| ESG/Permitting | Medium-High | 12-18 months | 3-8% | +50-100 bps |
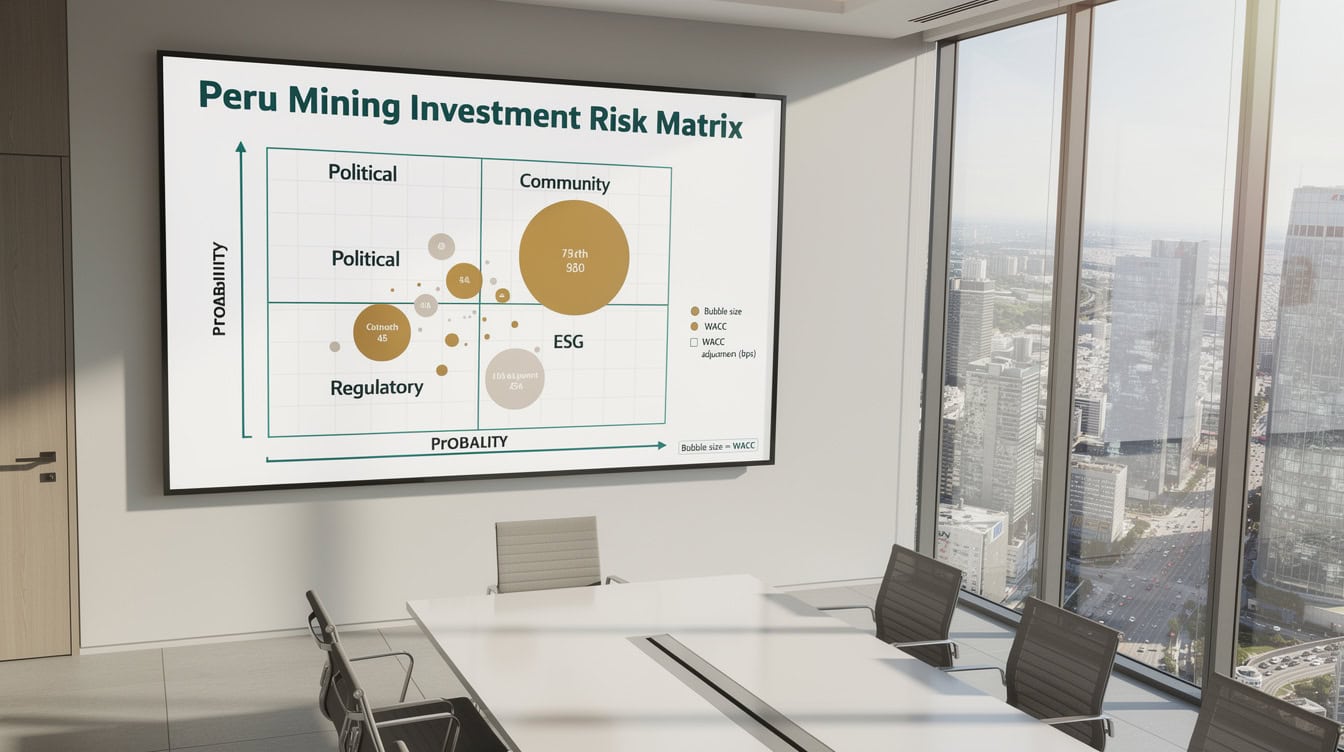
Community relations risk carries the highest probability and longest timeline impact of Peru’s four primary mining investment risk categories, historically adding 18-36 months to project permitting and 8-15% to total capex.
Common Modeling Mistakes in Peru Mining Analysis
Institutional analysts consistently make five errors when building Peru mining financial models.
1. Using a single commodity price for all metals. Copper, gold, zinc, and silver have different demand drivers and price elasticities. A model that applies one commodity price sensitivity to a multi-metal operation will systematically misstate both upside and downside scenarios.
2. Ignoring the royalty rate sliding scale. Peru’s royalty regime scales with operating margins, not revenue. At low copper prices, royalties fall to 1-2% of revenue. At high prices, they reach 12%. Failing to model this creates a 3-5 percentage point error in after-tax cash flow at peak commodity prices.
3. Underestimating community relations capex. Social license costs, including community development funds, relocation compensation, and ongoing stakeholder engagement, typically add 5-8% to total project capex in Peru. Models that omit this line item overstate IRR by 1-3 percentage points.
4. Applying Chilean discount rates to Peruvian projects. Peru carries a higher country risk premium than Chile due to political instability and weaker institutional frameworks. Using a 9-10% WACC appropriate for Chile on a Peru project understates the required return by 200-300 basis points.
5. Assuming linear production ramps. Peruvian mining projects historically take 20-40% longer to reach nameplate capacity than initial feasibility studies project, due to permitting delays, community disruptions, and infrastructure bottlenecks. A linear ramp assumption overstates early-year cash flows and inflates IRR.
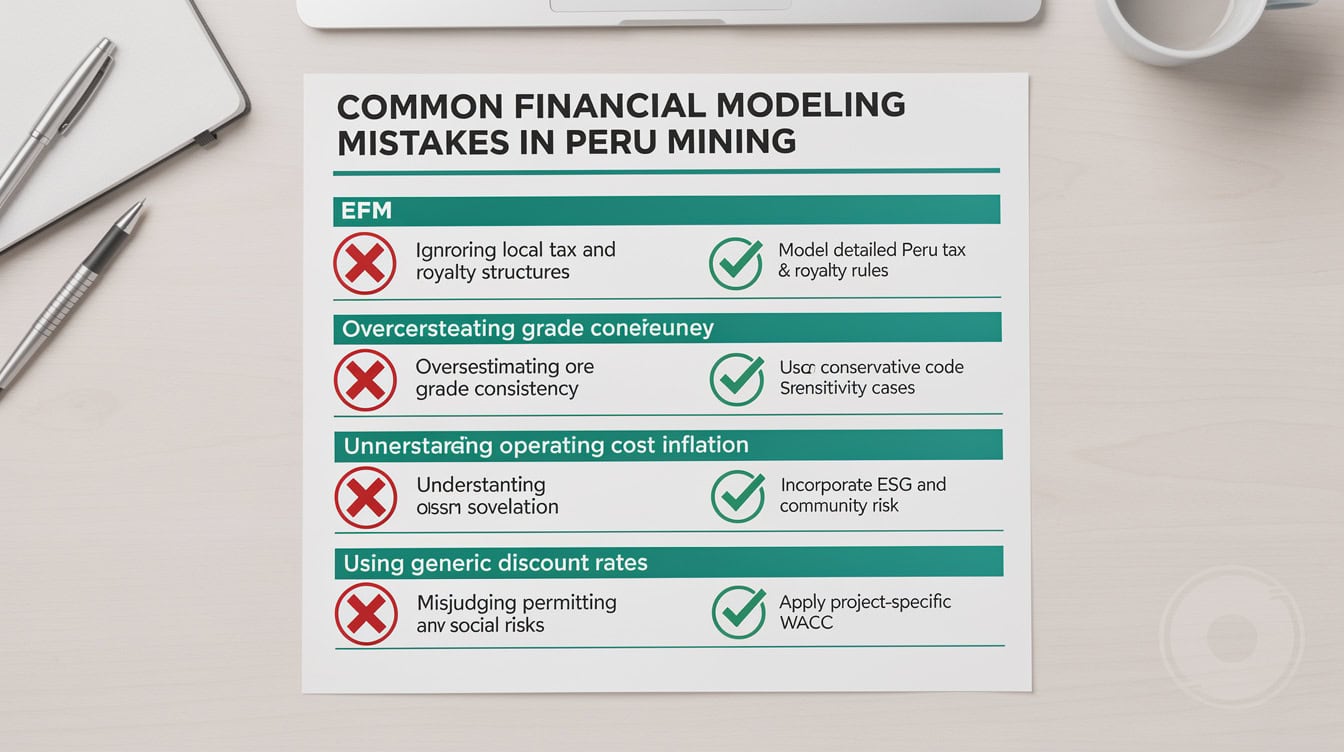
Applying Chilean discount rates to Peruvian projects understates required returns by 200-300 basis points, one of five systematic errors that inflate IRR projections in Peru mining analysis.
Frequently Asked Questions
What makes Peru’s copper sector attractive for institutional investors in 2026-2031?
Peru’s copper sector offers a combination of scale, ore quality, and price tailwinds that few jurisdictions can match. The country produces 2.4 million tonnes of copper annually according to Discovery Alert Australia, giving it the critical mass to support large-scale institutional capital deployment. Copper prices reached USD 5.88 per pound in 2026, a 35% year-on-year increase per BBVA Research, which directly expands producer margins and accelerates reinvestment capacity. For a 150,000-tonne-per-year operation, that price move alone generates approximately USD 500 million in additional annual revenue on identical production volumes. The energy transition provides a structural demand floor that reduces the probability of a sustained price collapse below USD 4.00/lb through 2031, making long-duration project financing more defensible to credit committees.
How should analysts model FDI flows into Peru’s mining sector through 2031?
Start with the 2023 baseline of USD 3.5 billion in mining FDI, which represented 40% of Peru’s total inbound investment according to Discovery Alert Australia. Build three copper price scenarios: bear at USD 3.80/lb, base at USD 5.50/lb, and bull at USD 7.00/lb. Apply an FDI elasticity coefficient of approximately 0.8 to copper price changes, meaning a 10% copper price increase drives roughly an 8% increase in mining FDI. Under the base case, this projects annual mining FDI of USD 4.0-4.5 billion by 2027-2028. Adjust downward by 15-20% if political risk escalates, and upward by 10-15% if Peru passes pending mining investment incentive legislation. The GDP multiplier on mining FDI is approximately 1.2x in the base case, consistent with BBVA Research’s 2.9-3.1% GDP growth projections for 2026-2027.
What discount rate is appropriate for a Peruvian copper mining project?
A defensible WACC for a Peruvian copper mining project in 2026 sits in the range of 11-14%, depending on project stage and operator quality. Start with a risk-free rate of approximately 4.5% (US 10-year Treasury), add an equity risk premium of 5-6%, a country risk premium of 2.5-3.5% for Peru (higher than Chile’s 1.5-2.0% due to political instability), and a mining sector beta of approximately 1.3-1.5. For brownfield expansions with established operators, the lower end of the range is defensible. For greenfield projects with first-time operators in contested communities, 14-16% is more appropriate. ESG non-compliance adds another 50-100 basis points from institutional lenders applying IFC Performance Standards.
How does gold exposure change the risk-return profile of a Peru mining portfolio?
Gold provides genuine diversification within a Peru mining portfolio because its price drivers differ from copper. Copper tracks industrial production, manufacturing PMI, and energy transition capex. Gold tracks real interest rates, dollar strength, and geopolitical risk. The 10-year price correlation between copper and gold is approximately 0.35, low enough to provide meaningful risk reduction in a combined portfolio. BBVA Research projects gold will maintain high average prices in 2026-2027 due to safe-haven demand. For a portfolio with 60% copper revenue and 40% gold revenue, a scenario where copper falls 20% but gold rises 15% produces a blended revenue decline of only 6%, compared to a 20% decline in a pure-copper portfolio. This dampening effect reduces portfolio Value-at-Risk by an estimated 25-35% relative to a single-commodity exposure.
What are the main permitting and regulatory risks for new mining projects in Peru?
Peru’s permitting process for new mining projects involves three parallel tracks: environmental impact assessment (EIA) approval from the Ministry of Energy and Mines, community consultation under ILO Convention 169 for projects affecting indigenous communities, and water use permits from the National Water Authority. Each track can take 18-36 months independently, and they do not run concurrently in practice. Projects in the Andes that affect indigenous communities face the most complex consultation requirements, with no guaranteed outcome. Historically, approximately 30% of major Peruvian mining projects have faced significant community opposition that delayed or modified project scope. Investors should budget 5-8% of total project capex for community relations, social investment programs, and stakeholder engagement over the project development period. Regulatory changes to royalty rates or environmental standards are possible given Peru’s political instability, adding a further layer of uncertainty to long-term cash flow projections.
How does the energy transition affect long-term copper price assumptions for project IRR models?
The energy transition creates a structural demand increment for copper that analysts must separate from cyclical industrial demand. Each electric vehicle requires approximately 83 kilograms of copper versus 23 kilograms for a conventional vehicle. Each gigawatt of solar capacity requires approximately 5,500 tonnes of copper for wiring and inverters. The IEA’s Net Zero by 2050 scenario requires copper demand to nearly double from current levels by 2040. For project IRR models with 15-20 year lives, using a copper price that reverts to USD 3.50/lb by 2030 is inconsistent with the energy transition demand trajectory. A more defensible long-term price assumption is USD 4.50-5.50/lb in real terms through 2031, with the current USD 5.88/lb level representing the upper end of the near-term range. Global subsea oil and gas spending exceeding USD 35 billion annually from 2026 through 2030 per Gabelli Funds (citing Rystad Energy) adds further metals demand through infrastructure procurement.
How does Peru’s tax regime compare to Chile and Mexico for mining investors?
Peru operates a sliding-scale royalty system that charges 1-12% of operating profit depending on margins, plus a 29.5% corporate income tax rate and a special mining tax introduced in 2011. Chile applies a sliding-scale royalty of 5-34% on operating income for large producers, plus a 27% corporate tax, making it marginally more expensive at high copper prices but more stable politically. Mexico charges a 7.5% special mining royalty on EBITDA plus a 0.5% royalty on precious metals revenue, with a 30% corporate tax rate. For a project generating USD 500 million in annual EBITDA, Peru’s total government take is approximately 38-42% of pre-tax cash flow in the base case, compared to 40-45% in Chile and 35-38% in Mexico. Peru’s regime is competitive but the political risk premium on the discount rate often offsets the marginal tax advantage relative to Chile.
Conclusion
Peru’s mining sector enters the 2026-2031 period with a rare alignment of structural demand tailwinds, elevated commodity prices, and recovering FDI flows. Copper at USD 5.88 per pound, GDP growth of 2.9-3.1%, and a USD 3.5 billion annual FDI baseline create a compelling investment environment for institutional capital that can price and manage Peru’s specific political and community relations risks. The key discipline is rigorous financial modeling: separate commodity price scenarios for each metal, accurate royalty rate modeling on the sliding scale, realistic community relations capex, and a Peru-specific discount rate that reflects the country risk premium honestly.
I recommend downloading the Peru Mining Sector Financial Model from eFinancialModels, which includes built-in copper and gold price scenario tables, FDI flow projection models, project-level IRR calculators calibrated for 2026-2031 investment horizons, and a risk-adjusted discount rate framework specific to Peruvian mining projects. It is the fastest way to move from market thesis to investment-grade financial analysis.
























































