
0 ITEMS

Cash-Flow Forecasting for Small Business Survival

The eFinancialModels Editorial Team — financial modeling specialists with 10+ years building financial models for SaaS, real estate, and energy projects.
Key Takeaways
- 82% of small business failures trace back to cash flow problems, not lack of profit The #1 Reason Small Businesses Fail – And How to Avoid It— making forecasting a survival skill, not a finance exercise.
- A 12-month cash flow forecast tracks opening balance, cash inflows, cash outflows, and closing balance for every month, giving you a 12-week early-warning system.
- Profitable businesses go bankrupt when customers pay in 60 days but suppliers demand payment in 30 — the profit vs. cash timing gap kills solvent companies.
- Three scenarios (best-case, worst-case, most-likely) let you stress-test your business before reality does it for you.
- Four metrics to watch weekly: cash conversion cycle, burn rate, runway, and days cash on hand — each has a formula and a danger threshold.
- 64% of small businesses still use spreadsheets rather than accounting software — spreadsheets work fine at early stages if structured correctly.
- One in four UK businesses holds less than three months of cash reserves How Many Businesses Fail Due to Cash Flow Problems? — the global cash crisis is not unique to any one market.
A proactive cash flow forecast gives owners 30-90 days of advance warning before a shortfall hits — enough time to act rather than react.
Why 82% of Small Businesses Fail: The Cash Flow Crisis
82% of small businesses in the U.S. fail because of poor cash flow management or a poor understanding of cash flow The #1 Reason Small Businesses Fail – And How to Avoid It. That number is not a warning — it is a verdict on what happens when founders treat cash flow as an accounting afterthought.
The problem is not always revenue. Many failed businesses were generating sales right up to the moment they closed. The problem is timing: money owed to you does not pay your rent. Invoices sitting in accounts receivable (the money customers owe you but have not yet paid) are not cash. Inventory sitting on shelves is not cash. A signed contract is not cash.
The scope is global. 45% of UK SMEs cited cash flow as a concern in the last 12 months, and one in four UK businesses holds less than three months of cash reserves. Three months is the minimum buffer most financial advisors recommend. Being below it means one bad quarter ends the business.
Cash-flow forecasting is the discipline of projecting exactly when cash enters and leaves your bank account — not when you earn it or when you owe it. Done correctly, it gives you 30 to 90 days of advance warning before a shortfall hits, enough time to act.
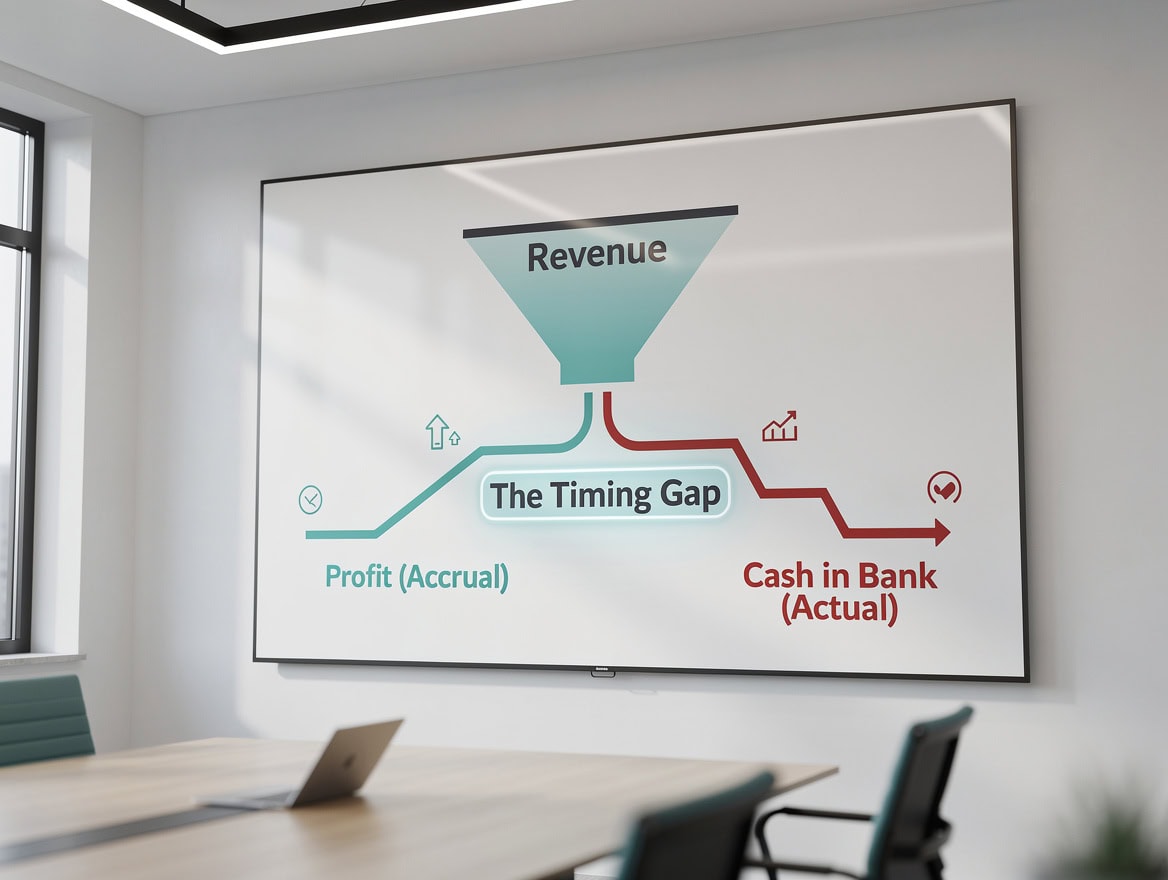
The timing gap between earning revenue and receiving cash is the mechanism behind most small business insolvencies — even profitable ones.
Cash Flow Forecasting vs. Budgeting: A Critical Distinction
Cash flow forecasting and budgeting are related but answer different questions. A budget asks “how much do we plan to spend and earn?” A cash flow forecast asks “when will the money actually move through our bank account?”
A budget might show $50,000 in revenue for March. But if your payment terms are net-60, that $50,000 arrives in May. Your budget looks healthy. Your bank account in March does not. This distinction is why profitable companies go bankrupt: they budget well but forecast poorly.
Forecasting also differs from budgeting in frequency. Budgets are typically annual documents, reviewed quarterly. Cash flow forecasts should be updated weekly for businesses with tight margins, and at minimum monthly for stable businesses. A rolling 13-week forecast (updated every week, always looking 13 weeks ahead) is the gold standard for small businesses managing tight liquidity.

A budget answers ‘how much?’ — a cash flow forecast answers ‘when?’ The distinction determines whether a profitable business stays solvent.
The Three Components Every Cash Flow Forecast Must Include
Every complete cash flow forecast covers three categories of cash movement. Miss any one of them and your forecast will mislead you.
1. Operating Activities — the day-to-day cash your business generates and spends.
Inflows: customer payments received (not invoiced), cash sales, advance deposits, refunds received.
Outflows: supplier payments, payroll, rent, utilities, insurance, tax payments, loan interest, marketing spend.
2. Investing Activities — cash spent on or received from long-term assets.
Inflows: proceeds from selling equipment, property, or investments.
Outflows: equipment purchases, leasehold improvements, software licenses, vehicle purchases.
3. Financing Activities — cash from or to lenders and owners.
Inflows: bank loans drawn down, investor equity injections, owner contributions.
Outflows: loan principal repayments, dividend payments, owner drawings.
Most small business forecasts are 80% operating activities. But ignoring a $40,000 equipment purchase in month 3 (investing) or a $15,000 loan repayment in month 6 (financing) will make your forecast dangerously optimistic.
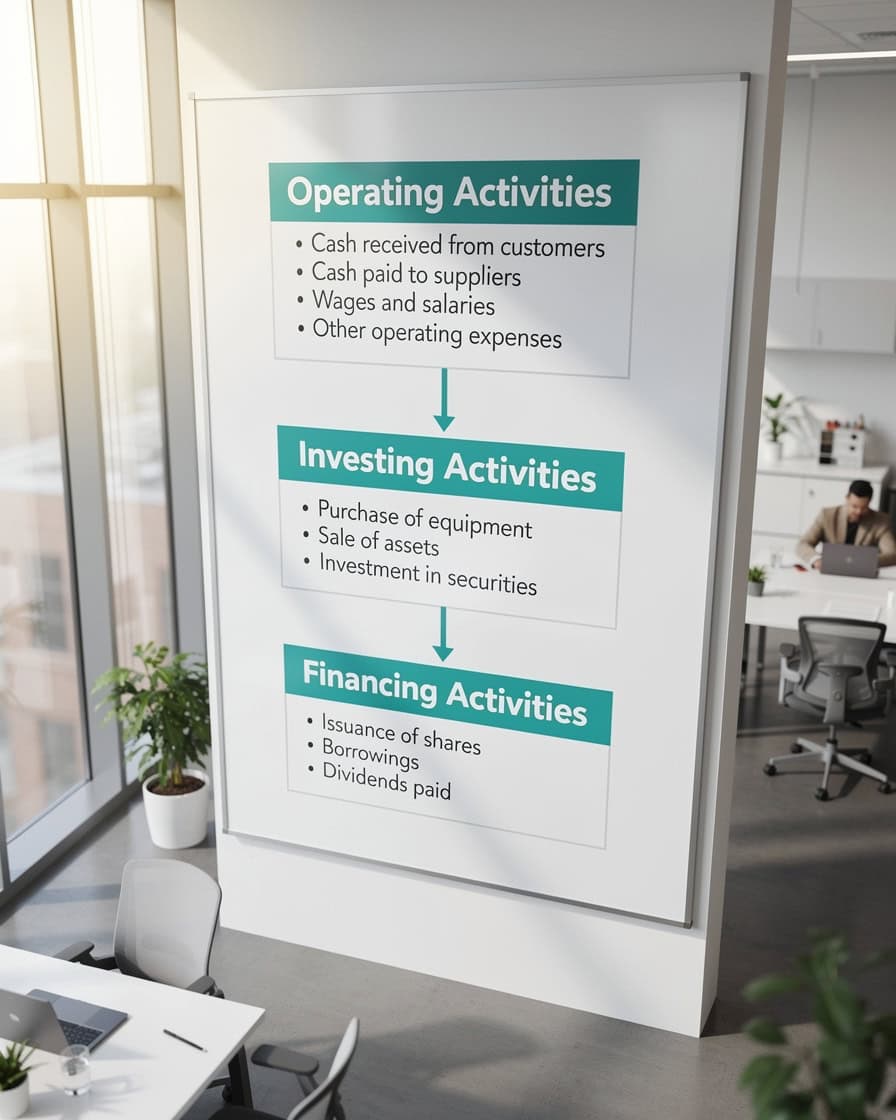
All three activity categories must appear in a complete forecast — omitting investing or financing activities creates dangerous blind spots.
How to Build Your 12-Month Cash Flow Forecast: Step-by-Step
Building a 12-month cash flow forecast takes four inputs and five calculation steps. You do not need accounting software to start — a structured spreadsheet works for most businesses under $2M in revenue.
Step 1: Set your opening balance. Pull the actual cash balance from your bank account on day one of the forecast period. This is your starting point. Do not use your accounting balance — use the real bank balance.
Step 2: Project cash inflows month by month. For each month, estimate cash actually received (not invoiced). If you invoice in month 1 on net-30 terms, that cash lands in month 2. For B2B businesses with long payment cycles, this step is where most forecasts go wrong. Build a collections schedule: list each customer, their payment terms, and their expected invoice dates.
Step 3: Project cash outflows month by month. List every payment you expect to make. Fixed costs (rent, salaries, subscriptions) are easy — they repeat. Variable costs (materials, commissions, shipping) scale with revenue. One-time costs (equipment, tax payments, annual insurance) need to be placed in the exact month they occur.
Step 4: Calculate net cash flow. For each month: Net Cash Flow = Total Cash Inflows minus Total Cash Outflows.
Step 5: Calculate closing balance. Closing Balance = Opening Balance + Net Cash Flow. The closing balance for month 1 becomes the opening balance for month 2. Repeat for all 12 months.
Any month where the closing balance goes negative is a crisis you now have advance warning to prevent.

The five-step forecast structure repeats for each of the 12 months — the closing balance of month 1 becomes the opening balance of month 2.
Worked Example: Monthly Cash Flow Forecast for a Small Business
Here is a three-month cash flow forecast for a small B2B services firm with $30,000 in monthly revenue on net-30 payment terms, $22,000 in monthly operating costs, and a $15,000 equipment purchase planned in month 2.
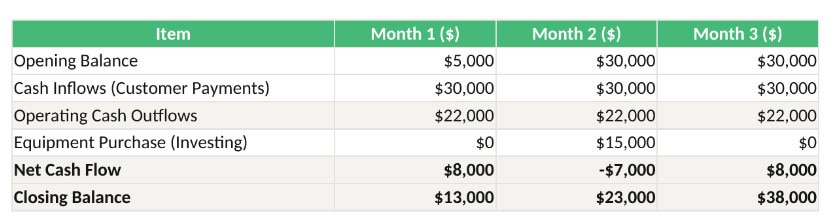
Closing Balance = Opening Balance + Cash Inflows – Cash Outflows. Month 2’s equipment purchase reduces the closing balance by $15,000 — visible 60 days in advance.
Reading the forecast: Month 1 closes with $13,000 in the bank — healthy. Month 2 takes a $2,000 hit from the equipment purchase, dropping the closing balance to $11,000 — still positive, but the owner now knows to delay any discretionary spending that month. Month 3 recovers to $19,000. Without this forecast, the month 2 equipment purchase might have felt fine on paper (the business is profitable) but could have triggered an overdraft if an unexpected cost appeared simultaneously.
This is the core value of forecasting: it converts surprises into decisions.
The equipment purchase in Month 2 reduces the closing balance from $13,000 to $11,000 — visible weeks in advance, giving the owner time to plan.
Profit vs. Cash Flow: Why Profitable Companies Still Go Bankrupt
Profit and cash flow measure different things, and confusing them is one of the most common — and fatal — mistakes small business owners make. Profit (also called net income) is revenue minus expenses on an accrual basis, meaning it counts transactions when they are earned or incurred, regardless of when cash moves. Cash flow counts only actual cash in and out of your bank account.
Here is a concrete example. A consulting firm invoices $100,000 in January. Its expenses are $60,000. Profit: $40,000. But the client pays on net-90 terms, so the $100,000 arrives in April. Meanwhile, the firm must pay its $60,000 in expenses in January, February, and March. The firm is profitable. It is also insolvent in February and March if it does not have reserves.
This timing gap is called the cash conversion cycle (CCC) — the number of days between paying for inputs and collecting cash from customers. The formula is:
CCC = Days Sales Outstanding + Days Inventory Outstanding – Days Payable Outstanding
- Days Sales Outstanding (DSO): Average number of days to collect payment after invoicing. Formula: (Accounts Receivable / Annual Revenue) x 365.
- Days Inventory Outstanding (DIO): Average days inventory sits before being sold. Formula: (Inventory / Cost of Goods Sold) x 365. (Service businesses: DIO = 0.)
- Days Payable Outstanding (DPO): Average days you take to pay suppliers. Formula: (Accounts Payable / Cost of Goods Sold) x 365.
A lower CCC means faster cash conversion. A CCC above 60 days is a warning sign for most small businesses. Reducing DSO by 10 days — by tightening payment terms or offering early-payment discounts — can free up months of operating cash.

Reducing DSO by just 10 days can free up weeks of operating cash — the CCC formula shows exactly where to apply pressure.
Scenario Planning: Best-Case, Worst-Case, and Most-Likely Forecasts
A single forecast is a single bet. Scenario planning builds three parallel forecasts with different assumptions, so you know your cash position under multiple futures. This is not pessimism — it is preparation.
Most-Likely Scenario: Use your best estimate of revenue (typically trailing 3-month average growth rate), standard payment terms, and known cost increases. This is your base case.
Worst-Case Scenario: Reduce revenue by 20-30% (or use your worst historical month as a reference), extend customer payment times by 15 days, and add one unexpected cost (equipment failure, a lost client). If your closing balance stays positive in this scenario, your business is resilient. If it goes negative in month 2, you need a credit line before that scenario materializes.
Best-Case Scenario: Increase revenue by 20-30%, assume faster collections, and hold costs flat. This scenario tells you how much cash you might need to fund growth — rapid growth consumes cash through higher inventory, more staff, and larger receivables before the revenue arrives.
For seasonal businesses (retail, hospitality, landscaping), build a fourth scenario: the off-season trough. Many seasonal businesses are profitable annually but cash-flow negative for 3-4 months. Knowing the exact trough month and depth lets you arrange a seasonal credit facility in advance rather than scrambling in January.
| Scenario | Revenue Assumption | Collections Timing | Cost Assumption | Month 3 Closing Balance |
|---|---|---|---|---|
| Most-Likely | $30,000/month | Net-30 | $22,000/month | $19,000 |
| Worst-Case | $21,000/month (-30%) | Net-45 | $24,000/month (+$2K unexpected) | -$1,500 |
| Best-Case | $39,000/month (+30%) | Net-20 | $22,000/month | $38,500 |
The worst-case scenario above turns negative in month 3. That is the trigger to arrange a $10,000 credit facility now, while the business is healthy, not when the bank account is already stressed.

Three scenarios replace one uncertain bet with a range of prepared responses — the worst-case scenario is where credit facilities should be arranged.
Key Cash Flow Metrics to Monitor Weekly
Four metrics give you a real-time dashboard of cash health. Calculate each weekly and track them on a simple scorecard.
1. Burn Rate — how much cash your business consumes per month when revenue is zero (or below breakeven). Formula: Total Monthly Cash Outflows. For a business spending $22,000/month, burn rate is $22,000. This is your baseline survival cost.
2. Runway — how many months you can operate at current burn rate before cash runs out. Formula: Current Cash Balance / Monthly Burn Rate. If you have $66,000 in the bank and burn $22,000/month, runway is 3 months. Below 3 months is a red-alert threshold. Below 6 months is a yellow flag.
3. Days Cash on Hand — similar to runway but expressed in days. Formula: (Cash Balance / Annual Operating Expenses) x 365. A healthy small business targets 30-90 days cash on hand. Below 30 days means one bad week can trigger a crisis.
4. Cash Conversion Cycle (CCC) — covered above. Track it monthly. If DSO is creeping up (customers paying slower), act immediately: send payment reminders at day 25, not day 45.
35% of small businesses cite working capital shortfall as the trigger for short-term borrowing The #1 Reason Small Businesses Fail – And How to Avoid It. Monitoring these four metrics weekly means you see the shortfall coming 4-8 weeks before it forces you to borrow at unfavorable rates.
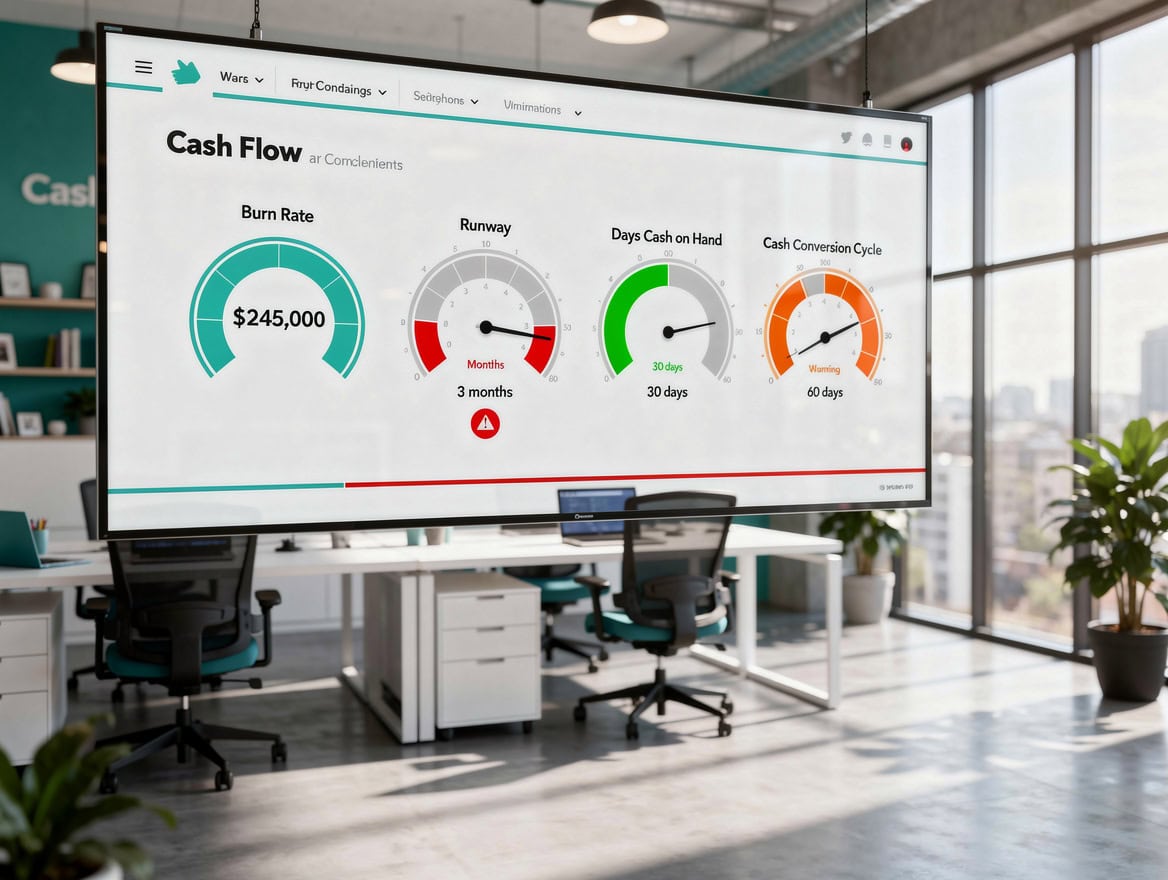
Tracking all four metrics weekly takes under 15 minutes and gives you a complete picture of cash health before problems become crises.
Tools and Technology: Spreadsheets vs. Accounting Software
64% of small businesses still rely on spreadsheets rather than accounting software to manage their finances The #1 Reason Small Businesses Fail – And How to Avoid It. Spreadsheets are not inherently wrong — they are wrong only when they are unstructured, unprotected, or not updated regularly.
| Tool Type | Best For | Strengths | Limitations |
|---|---|---|---|
| Excel / Google Sheets | Businesses under $1M revenue, early-stage startups | Free/low cost, fully customizable, scenario tabs easy to build | Manual data entry, error-prone, no bank feed integration |
| QuickBooks / Xero | $1M-$10M revenue, businesses with inventory or payroll | Automated bank feeds, real-time actuals, accountant-ready | Monthly subscription ($30-$150/month), learning curve |
| Float / Pulse | Businesses needing dedicated cash flow tools | Integrates with QuickBooks/Xero, rolling forecast views | Adds cost on top of accounting software |
| ERP (NetSuite, Sage) | $10M+ revenue, multi-entity businesses | Full financial consolidation, advanced reporting | High cost ($1,000+/month), implementation time |
For most small businesses starting out, a well-structured 12-month Excel forecast with three scenario tabs, locked formula cells, and a weekly update discipline outperforms expensive software used inconsistently. The tool matters less than the habit.
You can explore financial forecasting models built specifically for small businesses, or review why financial forecasting models are vital for your business before choosing your approach.

The business that sees a shortfall 60 days out survives it. The one that sees it on payday does not.
Warning Signs Your Cash Flow Forecast Is Failing
A forecast that is consistently wrong is worse than no forecast — it creates false confidence. Watch for these five warning signs.
1. Actuals consistently miss forecast by more than 15%. If your forecast says $30,000 in collections and you repeatedly collect $22,000, your revenue assumptions or payment timing assumptions are wrong. Rebuild from trailing actuals, not aspirational targets.
2. You update the forecast only when there is a crisis. A forecast updated quarterly is a historical document, not a planning tool. Set a weekly 30-minute calendar block to update actuals and roll the forecast forward.
3. Your forecast excludes irregular costs. Annual insurance premiums, quarterly tax payments, and one-time equipment purchases are predictable. If they keep “surprising” you, they are not in your forecast. List every annual cost, divide by 12, and either accrue monthly or place the lump sum in the exact payment month.
4. You have one scenario, not three. A single forecast assumes the future is certain. It is not. If you have not stress-tested a 25% revenue drop, you do not know whether your business survives one.
5. Your forecast and your bank account tell different stories. If your forecast shows $50,000 in cash but your bank shows $12,000, something is wrong with your opening balance, your collections timing, or your cost capture. Reconcile monthly, not annually.
Facing a negative forecast projection is psychologically difficult. Many owners avoid updating their forecast precisely because they fear what it will show. That avoidance is the mechanism by which cash flow problems become fatal. A negative projection is not a failure — it is a decision point. You have time to cut costs, accelerate collections, draw on a credit line, or bring in a partner. The business that sees the shortfall 60 days out survives. The one that sees it on payday does not.
Frequently Asked Questions
How often should I update my cash flow forecast?
For most small businesses, a weekly update is the right cadence. Each week, enter actual cash received and paid, compare to your forecast, and roll the forecast one week forward so you always have 13 weeks of visibility ahead. Monthly updates are acceptable for stable, low-volatility businesses with predictable revenue and costs. Quarterly updates are too infrequent for any business with variable revenue, seasonal patterns, or tight margins. The key discipline is consistency: a 30-minute weekly update done every Monday morning is worth more than a perfect annual forecast reviewed once. If your actuals deviate from forecast by more than 10-15% in any given week, investigate the cause before moving on.
What is the difference between a cash flow forecast and a cash flow statement?
A cash flow statement (also called a statement of cash flows) is a historical document — it records actual cash movements that already happened, typically prepared monthly or quarterly for accounting purposes. A cash flow forecast is forward-looking — it projects future cash movements based on assumptions about revenue, collections, and expenses. Both use the same three categories (operating, investing, financing activities), but the forecast is your planning tool and the statement is your scorecard. Comparing the two monthly is one of the most powerful ways to improve forecast accuracy: where they diverge tells you exactly which assumptions need adjusting.
How much cash reserve should a small business keep?
Most financial advisors recommend 3-6 months of operating expenses as a cash reserve. For a business spending $22,000/month, that means $66,000 to $132,000 in reserve. The right number depends on revenue volatility: a B2C retail business with daily cash sales needs less reserve than a B2B services firm with 60-day payment terms and lumpy project revenue. One in four UK businesses holds less than three months of reserves How Many Businesses Fail Due to Cash Flow Problems?, which means a single bad quarter can be terminal. Build reserves during strong months, not after a crisis begins.
Can a profitable business really run out of cash?
Yes, and it happens more often than most people expect. Profit is an accounting concept that records revenue when earned and expenses when incurred, regardless of when cash moves. A business can show $40,000 in monthly profit on its income statement while its bank account is empty if customers have not paid yet and suppliers are demanding payment now. This is called a liquidity crisis, and it is distinct from insolvency (where liabilities exceed assets). The solution is not to become more profitable — it is to shorten your cash conversion cycle by collecting faster, paying slower (within terms), and forecasting the timing gap explicitly.
What is a rolling forecast and why is it better than a static annual forecast?
A rolling forecast always covers a fixed future window — typically 12 or 13 weeks — and advances by one period each week or month. When January ends, you add a new January (13 months out) to the forecast, so you always have the same forward visibility. A static annual forecast, built in December for the following year, becomes increasingly stale as the year progresses. By October, it is based on 10-month-old assumptions. A rolling forecast forces you to update assumptions continuously, which improves accuracy and keeps management attention on the near-term cash position. For small businesses, a 13-week rolling forecast is the most practical format.
What should I do if my forecast shows a negative cash balance in month 4?
A negative projected balance in month 4 is valuable information — you have roughly 90 days to act. Your options, roughly in order of preference: (1) accelerate collections by offering a 2% early-payment discount to customers who pay within 10 days; (2) delay discretionary spending (equipment, marketing, hiring) until after the trough; (3) negotiate extended payment terms with key suppliers; (4) draw on an existing credit line or arrange one now while your financials are still healthy; (5) bring forward a planned revenue initiative (a new product launch, a price increase, a new client pitch). The worst response is to ignore the forecast and hope the shortfall does not materialize. 35% of small businesses end up borrowing short-term because of working capital shortfalls — most of those borrowing decisions would have been cheaper and less stressful if made proactively.
How do I forecast cash flow for a seasonal business?
Seasonal businesses need a 12-month forecast that explicitly models the revenue trough. Start by mapping your trailing 2-3 years of monthly revenue to identify the seasonal pattern. Apply that pattern to your revenue forecast, then build your cost structure around it — some costs (rent, insurance, core staff) are fixed year-round, while others (seasonal staff, inventory) can flex. Build a worst-case scenario where the peak season underperforms by 20%. If that scenario shows a negative balance during the off-season, arrange a seasonal revolving credit facility before the peak season ends, when your financials look strongest to a lender. Many seasonal businesses use their strong-season cash to pre-fund the off-season rather than borrowing — your forecast tells you exactly how much to set aside.
Conclusion
Cash-flow forecasting is not a finance department luxury. It is the mechanism by which small businesses convert uncertainty into decisions. The 82% failure rate tied to cash flow problems is not inevitable — it is the predictable outcome of running a business without forward visibility into your bank account.
You now have the methodology: three components, five calculation steps, four weekly metrics, and three scenario tracks. The next step is to put numbers in a spreadsheet and run your first 12-month forecast this week, not next quarter.
I recommend downloading the EFM 12-month cash flow forecast template — it includes built-in scenario planning tabs, automated closing balance calculations, and a weekly actuals tracker so you can compare forecast to reality from day one. If you want to go deeper on the financial modeling behind cash flow, the pro forma income statement guide and forecasting sales using product life cycles are the logical next reads.























































