
0 ITEMS

Bowling Business Plan Financial Model Excel Template
The Bowling Alley Financial Model helps entrepreneurs, owners, consultants, analysts, and business plan writers turn a bowling alley concept into a structured financial forecast. Instead of starting with a blank spreadsheet, users can work from a ready-to-use model designed around the economics of an entertainment venue, including lane revenue, food and beverage sales, event packages, ancillary income, startup costs, operating expenses, payroll, cash flow, and profitability. The template is built to support practical financial planning, whether the goal is opening a new location, evaluating an acquisition, expanding an existing venue, or preparing a funding proposal for banks, investors, or internal stakeholders. This financial model template gives users a clear way to organize the assumptions that drive a bowling alley business. It helps estimate customer volume, average pricing, revenue growth, cost of goods sold, staffing requirements, rent, utilities, marketing, maintenance, insurance, and other operating expenses that affect financial performance. By connecting these assumptions to automated projections, the model helps users understand how changes in visits, pricing, event bookings, food and beverage margins, and fixed overhead can influence revenue, EBITDA, net income, and cash flow over time. The Bowling Alley Financial Model is useful for decision-making because it brings together key reports, dashboards, scenarios, charts, and profitability metrics in one editable workbook. Users can review a base case, test more conservative or optimistic assumptions, evaluate the timing of break-even, monitor working capital needs, and identify the level of funding required before the business becomes self-sustaining. The model also supports conversations with lenders and investors by presenting financial statements, cash flow projections, return metrics, and performance indicators in a structured, professional format. Because bowling alleys are capital-intensive businesses, accurate financial planning is especially important. Equipment, facility buildout, kitchen setup, interior design, staffing, inventory, marketing, and lease obligations can create significant upfront and ongoing cash requirements. This template helps users plan for those realities before committing capital. It is fully customizable, compatible with Excel and Google Sheets, and designed for users who need a practical, investor-ready tool to forecast performance, compare assumptions, and make better financial decisions with confidence.
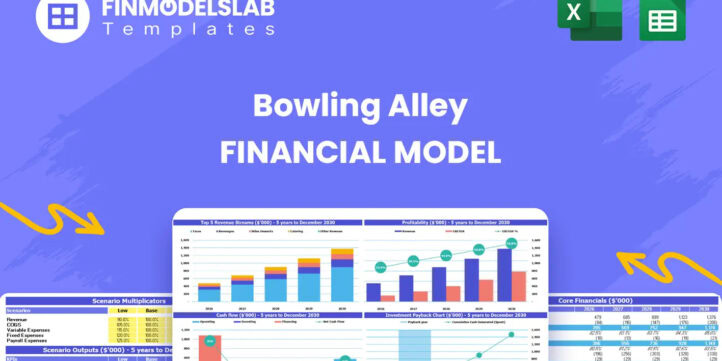


Financial Model Overview
The Bowling Alley Financial Model is a ready-to-use financial model template created for planning, evaluating, and presenting the financial outlook of a bowling alley business. It gives entrepreneurs, business owners, consultants, analysts, and funding applicants a structured way to estimate revenue, startup investment, operating expenses, payroll, cash flow, profitability, and long-term financial performance. A bowling alley typically combines multiple revenue streams, substantial upfront capital requirements, fixed facility costs, and variable customer demand, so a simple sales estimate is not enough. This model brings the key assumptions together in one editable workbook, helping users understand how lane activity, food and beverage sales, event bookings, arcade income, rental revenue, staffing, cost of goods sold, rent, and capital expenditures affect the business over time. The template is designed to support business planning, investor discussions, bank financing, internal budgeting, and strategic decision-making by turning assumptions into clear financial projections and professional reports.
All-in-One Dashboard
The all-in-one dashboard is the central control and summary area of the Bowling Alley Financial Model, bringing core inputs and core outputs into one organized view. It helps users quickly see the most important planning assumptions, such as customer activity, pricing, growth rates, major cost categories, capital requirements, and financing assumptions, while also displaying the resulting outputs such as revenue, profit, cash position, margins, and return indicators. For a bowling alley, this is especially useful because performance depends on several connected drivers, including games played, average price per game, food orders, beverage orders, event packages, ancillary income, rent, payroll, maintenance, and utilities. The dashboard reduces the need to search through separate tabs by giving users a high-level view of how the model is performing and where attention is needed. It is useful for owners who want to monitor the financial plan, advisors who need to review assumptions quickly, and investors or lenders who want a concise overview before reviewing the detailed statements. Because the model is editable, users can adjust assumptions and use the dashboard to immediately see how those changes affect the overall financial outlook.
Low, Base, and High Scenario Analysis
The Low, Base, and High scenario analysis component helps users compare how the bowling alley could perform under different business conditions. The base case can represent the expected operating plan, while the low case can model a slower ramp-up, lower visitor traffic, weaker event bookings, higher costs, or delayed profitability. The high case can reflect stronger demand, improved pricing, better food and beverage sales, higher lane utilization, or more successful marketing. This component is valuable because bowling alleys face uncertainty around local demand, seasonality, competition, lease costs, staffing levels, and discretionary entertainment spending. By adjusting the key assumptions across multiple scenarios, users can estimate the range of possible revenue, EBITDA, net income, cash flow, and funding needs. Scenario planning is particularly helpful when preparing for investor meetings or bank loan discussions because it shows that the business plan has been stress-tested rather than built around a single optimistic forecast. It also supports better decision-making by showing which assumptions matter most, where downside risk is concentrated, and what level of cash reserve may be required if the business takes longer than expected to reach stable profitability.
Professional Charts
The professional charts component converts the financial model’s outputs into visual reports that are easier to understand, present, and discuss. Instead of relying only on rows of numbers, users can use charts to show projected revenue growth, profitability trends, cash flow movement, cost behavior, margin development, and other key financial results over the forecast period. This is helpful for a bowling alley business plan because stakeholders often need to understand both the scale of the opportunity and the timing of financial improvement. A chart showing rising visits, expanding food and beverage sales, improving EBITDA, or a cash trough during the early years can communicate the story more clearly than a detailed spreadsheet alone. The charts can be used in investor presentations, lender discussions, internal planning meetings, and strategy reviews. They help users spot trends, identify turning points, and explain why certain decisions are needed, such as increasing marketing, controlling inventory costs, negotiating rent, adding event packages, or securing working capital. Because the charts are connected to the model, updates to assumptions can flow through to the visual outputs, saving time and helping users keep presentations aligned with the latest version of the forecast.
ROE Components and DuPont Analysis
The ROE components and DuPont analysis section helps users understand what is driving return on equity rather than looking at a single return figure in isolation. DuPont analysis breaks return on equity into underlying drivers such as profitability, asset efficiency, and financial leverage, giving users a more detailed view of how operational performance and capital structure affect investor returns. For a bowling alley, this can be especially useful because the business usually requires significant investment in lanes, scoring systems, facility buildout, kitchen equipment, furniture, fixtures, and working capital. A venue may generate revenue growth but still produce weak equity returns if margins are too low, assets are underutilized, or debt obligations are too heavy. This component helps users evaluate whether returns are being limited by operating profit, asset turnover, financing choices, or a combination of factors. Inputs may include net income, revenue, assets, equity, and leverage assumptions, while outputs help show how those items combine to produce ROE. This makes the model more useful for investors and owners who want to understand whether the bowling alley can create attractive returns and what operational or financial changes could improve performance.
Revenue Inputs
The revenue inputs component is where users define the assumptions that drive the bowling alley’s top-line forecast. It may include lane activity, number of games played, average price per game, annual growth in visits, food orders, beverage orders, event packages, league activity, arcade income, shoe rentals, merchandise, and other ancillary revenue sources. For a bowling alley, revenue modeling needs to reflect the fact that income is not generated from one product only. Bowling games may be the main driver, but food and beverage sales can significantly improve margins, while parties, corporate events, leagues, and rentals can increase average customer spend and improve utilization during off-peak periods. This section helps users build a more realistic forecast by separating the main revenue streams and allowing each one to have its own pricing, volume, and growth assumptions. The outputs feed into the income statement, cash flow forecast, dashboard, charts, and profitability analysis. This component is valuable for business planning because it allows users to test commercial strategies, such as raising game prices, increasing event bookings, expanding food service, promoting weekday leagues, or adding arcade attractions, and then see how those choices affect the overall financial forecast.
Bank-Ready Reports
The bank-ready reports component produces lender-friendly financial outputs that help users present the bowling alley plan in a structured and credible way. Banks and financing partners typically want to see clear revenue projections, operating expenses, profit and loss statements, cash flow forecasts, balance sheet expectations, capital requirements, debt assumptions, and the timing of repayment capacity. This component organizes the model’s results into professional reports that can support loan applications, funding requests, business plan appendices, and stakeholder reviews. For a bowling alley, this is important because the upfront investment can be substantial, often involving facility buildout, specialized bowling equipment, kitchen and bar equipment, furniture, lease deposits, permits, pre-opening payroll, initial marketing, and working capital. Lenders need to understand not only the total cost but also whether the business can generate enough cash flow to cover operating costs and debt service. The reports help users communicate the numbers clearly and consistently, reducing the risk of presenting incomplete or disconnected financial information. They also make it easier to answer questions about assumptions, cash needs, profitability timing, and financial sustainability.
Revenue Breakdown
The revenue breakdown component provides a detailed view of how total revenue is built from the different income streams of the bowling alley. Rather than showing only one combined sales number, it separates revenue categories such as bowling games, food sales, beverage sales, event packages, arcade games, shoe rentals, merchandise, leagues, and other add-on services if applicable. This level of detail is important because each revenue stream can have different pricing, volume, growth potential, cost structure, and margin profile. For example, a high-volume bowling lane strategy may produce steady customer traffic, while event packages may generate higher average spend per booking. Food and beverage sales can improve profitability but require inventory management, staffing, and cost control. Ancillary revenue may be smaller individually but meaningful when added together across many customer visits. This component helps users identify which parts of the business contribute most to sales, where growth opportunities exist, and which revenue streams deserve operational focus. It can also support pricing decisions, marketing strategy, and capacity planning by showing whether the forecast depends too heavily on one source of revenue or whether the business has a balanced and diversified income base.
KPI Dashboard
The KPI dashboard component tracks key performance indicators that help users evaluate the health and efficiency of the bowling alley financial plan. It may include metrics such as revenue growth, gross margin, EBITDA margin, net profit margin, cash balance, average revenue per customer, lane utilization, food and beverage contribution, payroll as a percentage of revenue, marketing spend, cost of goods sold, payback period, and return metrics. A KPI dashboard is useful because business owners and stakeholders need more than full financial statements to manage performance. They need concise indicators that show whether the business is moving in the right direction and whether performance is in line with expectations. For a bowling alley, KPIs can reveal whether customer volume is increasing, whether food and beverage margins are under control, whether payroll levels are sustainable, whether event packages are contributing enough revenue, and whether cash flow is improving as the venue matures. This component is valuable for ongoing decision-making because it turns the financial model into a monitoring tool. It can be used during monthly reviews, investor updates, lender discussions, and internal planning sessions to identify issues early and adjust strategy before small problems become larger financial challenges.
Break-Even Analysis
The break-even analysis component helps users determine when the bowling alley is expected to cover its costs and begin generating sustainable profit. It connects revenue assumptions, fixed costs, variable costs, startup expenses, and operating margins to estimate the point at which cumulative revenue or operating contribution offsets the cost structure. Inputs may include lane revenue, food and beverage sales, event income, cost of goods sold, rent, payroll, utilities, insurance, marketing, maintenance, administrative expenses, and other fixed or semi-variable costs. The outputs can help identify the timing of break-even, the revenue level required to cover expenses, and the effect of changing prices, volume, or margins. This is particularly important for a bowling alley because the early months may include a ramp-up period before customer awareness, league participation, event bookings, and repeat visits reach stable levels. Break-even analysis supports funding planning by showing how long the business may need external capital or reserves before it becomes self-sustaining. It also helps users evaluate whether the operating model is realistic and what actions could accelerate profitability, such as improving food and beverage margins, increasing weekday traffic, launching leagues, adding membership programs, or securing more corporate events.
Startup Costs and Funding Requirements
The startup costs and funding requirements component helps users estimate the initial capital needed to launch the bowling alley and operate through the early stages of the business. It may include bowling lanes and equipment, scoring systems, facility buildout, leasehold improvements, interior design, furniture, kitchen and bar equipment, arcade machines, point-of-sale systems, licenses, permits, professional fees, deposits, pre-opening payroll, initial inventory, launch marketing, contingency reserves, and working capital. This section is critical because a bowling alley is typically more capital-intensive than many small businesses, and underestimating startup costs can create cash pressure before the venue has time to reach stable revenue. The component helps separate one-time capital expenditures from recurring operating expenses, making it easier to understand what must be funded before opening and what will continue after launch. It can also support financing strategy by helping users compare owner investment, bank loans, investor funding, equipment financing, or other sources of capital. The outputs help clarify total funding needs, the timing of cash requirements, and the minimum cash cushion required to handle delays, construction overruns, slow demand ramp-up, or seasonal fluctuations. For business plans and funding documents, this component strengthens credibility by showing that the launch budget has been considered in detail.
File types:
Excel – Single-User: .xlsx
Excel – Multi-User: .xlsx
Similar ProductsOther customers were also interested in...



 HenrySheykin
Golf Course Financial Model Excel Template
The Golf Course Financial Model Financial Model Template helps entrepreneurs, owners, consultants, a... Read more

Recreation Center Business Plan Financial Model Ex...
The Recreation Center Financial Model helps entrepreneurs, business owners, consultants, analysts, a... Read more
 Giorgos
Recreation & Community Center – Dynamic 10 Y...
Financial Model presenting a development and operating scenario of a Recreation & Community Cent... Read more

Tennis Club Financial Model – 5 Year Forecast
This Financial Model presents an advanced 5-year financial plan for a startup Tennis Club and is a f... Read more

 City Finance
Indoor Golf Centre Finance Model
A comprehensive editable, MS Excel spreadsheet for tracking Indoor Golf Centre finances, integrates ... Read more

Indoor Rock Climbing Gym Finance Model
A comprehensive editable, MS Excel spreadsheet for tracking Indoor Rock Climbing Gym finances, Incom... Read more

 Jair
Indoor Golf Business Model
This template is a detailed and user-friendly financial model that takes into account the specifics ... Read more
Nightclub Financial Model Excel Template
The Nightclub Financial Model helps users turn a nightlife business concept into a structured financ... Read more
Waterpark Business Plan Financial Model Excel Temp...
The Water Park Financial Model helps entrepreneurs, founders, consultants, analysts, and business ow... Read more
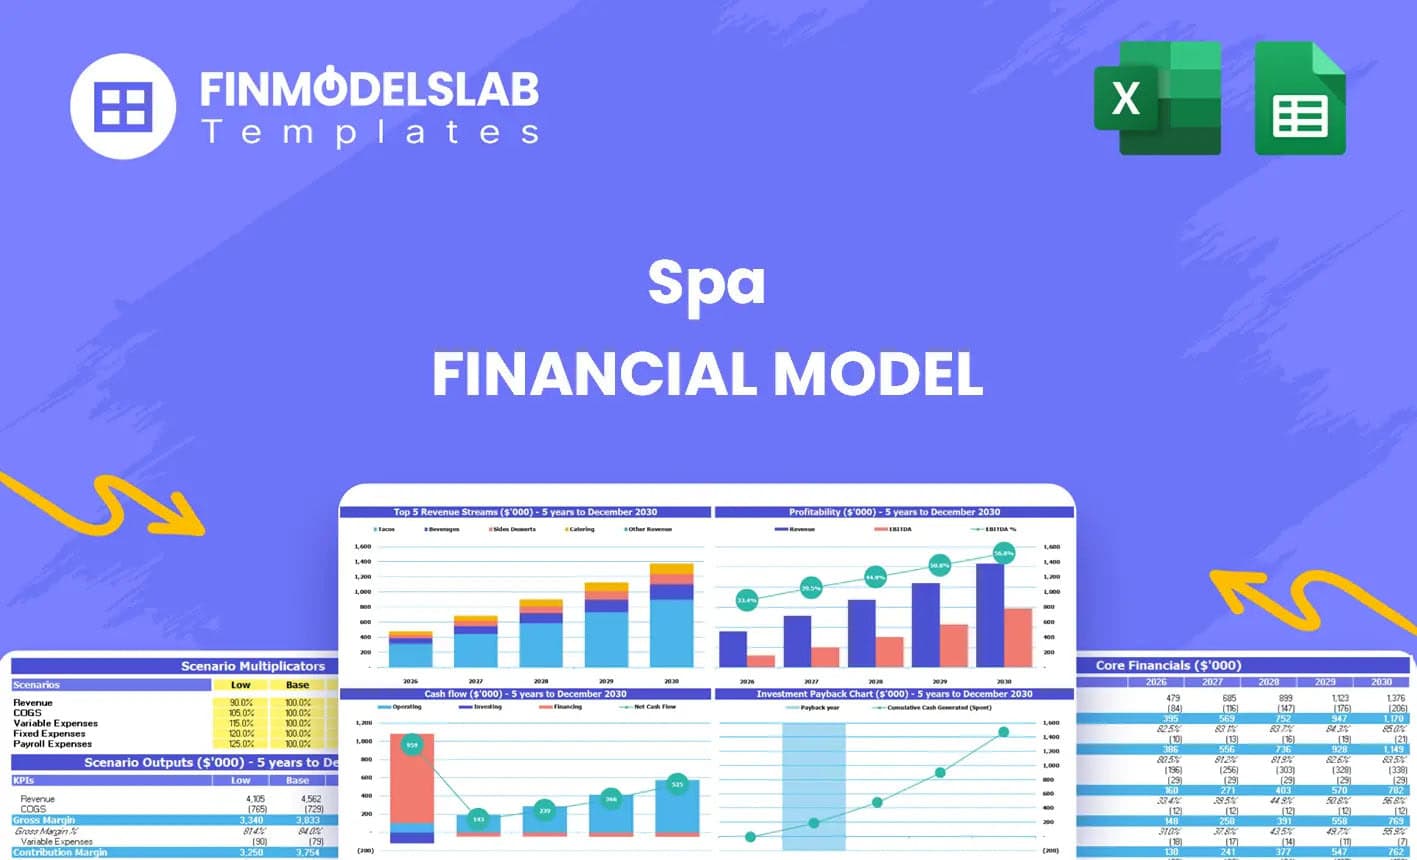
Spa Financial Model Excel Template
The Spa Financial Model helps entrepreneurs, spa owners, consultants, analysts, and business planner... Read more
You must log in to submit a review.