
0 ITEMS

Laundry Financial Model Excel Template
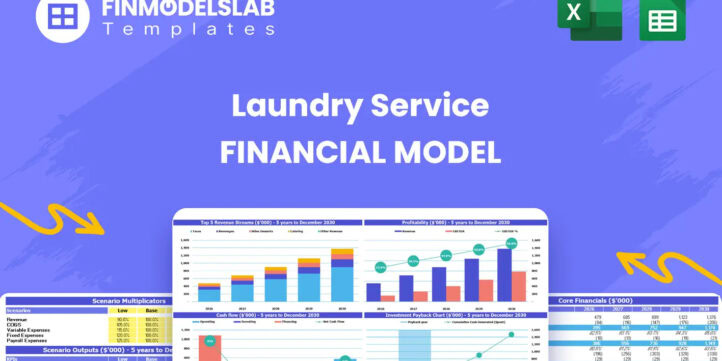
The Laundry Service Financial Model helps entrepreneurs, business owners, consultants, analysts, and founders build a structured financial plan for a wash and fold, laundry pickup and delivery, or full-service laundry business. Instead of starting with a blank spreadsheet, users can work from a ready-to-use financial model template designed around the commercial realities of laundry operations, including service pricing, customer volume, pounds processed, specialty item sales, staffing, utilities, supplies, delivery costs, and facility-related expenses. It gives users a practical way to turn business assumptions into projected revenue, operating expenses, cash flow, profitability, and funding needs. This template is useful for people preparing business plans, lender packages, investor presentations, internal budgets, or expansion plans. It helps users estimate how much capital may be required to launch, how quickly revenue could grow, what payroll and operating costs may look like, and when the business may move from early losses into sustainable profitability. The model supports up to five years of projections and allows users to adjust assumptions such as pricing, order volume, growth rates, cost of goods sold, marketing spend, rent, labor, equipment, and working capital requirements. By connecting these assumptions to financial statements and visual outputs, it helps users make more informed decisions before committing capital. The Laundry Service Financial Model is built to help users evaluate both the upside and the risks of the business. It can be used to test revenue assumptions, review cash flow gaps, assess profitability, calculate break-even timing, and understand how changes in sales volume or costs affect the overall forecast. This is especially important for laundry services because the business can be capital-intensive, with major startup costs for equipment, vehicles, facility build-out, and initial staffing before revenue reaches scale. The template makes it easier to see how operational choices translate into financial outcomes. Whether you are launching a new laundry service, expanding an existing wash and fold operation, adding pickup and delivery, or preparing a financial forecast for investors or lenders, this model provides an editable and organized planning framework. It is designed for use in Microsoft Excel and Google Sheets, with customizable inputs, automated calculations, financial summaries, charts, and decision-making outputs that help present the business in a clear, professional, and funding-ready format.


Financial Model Overview
The Laundry Service Financial Model is a ready-to-use financial model template created to help users plan, evaluate, and present the economics of a laundry service business. It is built for entrepreneurs, founders, laundry business owners, consultants, analysts, and anyone preparing a business plan, funding request, lender package, investor presentation, or internal operating forecast. A laundry service can involve multiple revenue drivers, including standard wash and fold by the pound, specialty items, premium eco-friendly laundry, pickup and delivery, and recurring customer demand. It can also require meaningful upfront investment in commercial washers and dryers, facility build-out, delivery vehicles, staffing, utilities, detergents, packaging, rent, and marketing. This model brings those moving parts into one structured planning tool so users can replace guesswork with a more organized forecast. By entering assumptions for pricing, volume, growth, operating expenses, payroll, startup costs, cost of goods sold, and funding needs, users can generate revenue projections, profit and loss outputs, cash flow forecasts, investor metrics, and decision-making insights over a multi-year period. The template is editable, practical, and designed to support both early-stage planning and established laundry businesses that want to test expansion scenarios, compare performance expectations, and communicate financial results clearly to stakeholders.
All-in-One Dashboard
The all-in-one dashboard provides a centralized view of the Laundry Service Financial Model by bringing the most important inputs and outputs into a single planning area. For a laundry service, this can include assumptions such as pounds of standard laundry processed, specialty item units, eco-friendly laundry volume, service pricing, customer growth, operating costs, payroll, startup investment, and financing assumptions. The dashboard is useful because it allows users to see how the business model behaves without searching through separate worksheets or disconnected calculations. When key assumptions are updated, the model can reflect the impact on projected revenue, gross profit, EBITDA, net income, cash flow, and other core results. This makes the dashboard especially valuable for decision-making because a user can quickly test whether the planned pricing, order volume, and cost structure are strong enough to support a profitable operation. It also helps business owners and advisors focus discussions around the assumptions that matter most, such as whether enough customer volume is being generated to absorb fixed costs, whether delivery costs are sustainable, and whether the business has sufficient cash reserves during the early ramp-up period. For funding preparation, the dashboard creates a concise financial summary that can help lenders, investors, or partners understand the business at a glance before reviewing the detailed statements.
Low Base High Scenario Analysis
The low, base, and high scenario analysis component helps users evaluate how the laundry service may perform under different operating conditions. A base case may reflect the most realistic forecast, while a low case can represent slower customer acquisition, lower order volume, weaker pricing, higher utility costs, or delayed market adoption. A high case can represent stronger demand, improved order density, higher customer retention, premium service adoption, or better cost efficiency. This component is important because laundry services often depend on volume growth and operational scale. A business may lose money during its early months or years if equipment, rent, payroll, and vehicle expenses are in place before revenue reaches an efficient level. By comparing multiple scenarios, users can understand the financial impact of changes in key drivers such as pounds processed per month, price per pound, specialty item sales, delivery volume, staffing levels, and variable cost percentages. The outputs can help users compare revenue, profitability, margins, cash flow, funding needs, and payback timing across different cases. This makes the model more useful for planning because it does not assume that the future will unfold exactly as expected. Instead, it helps users prepare contingency plans, set minimum viable sales targets, identify downside risks, and communicate to investors or lenders that the business has been tested against realistic uncertainty.
Professional Charts
The professional charts component converts the financial forecast into visual reports that are easier to understand and present. A laundry service financial plan can include many detailed assumptions, including revenue streams, cost of goods sold, payroll, operating expenses, capital expenditures, financing, and cash flow. While those details are necessary, decision-makers often need a clear visual summary of trends and outcomes. The charts can help users show revenue growth over time, profitability progression, cash balance movement, expense categories, margin development, and other key financial metrics. This is useful for investor presentations, bank meetings, internal reviews, and business plan documents because stakeholders can quickly see whether the business is scaling, when losses are expected to narrow, and how profitability improves as volume increases. For example, a chart showing revenue by year can demonstrate the growth expected from higher customer volume and service adoption, while a cash flow chart can highlight periods where working capital may be tight. Visual reporting also helps users identify potential issues that may not be obvious in rows of numbers, such as expenses growing faster than revenue or cash balances declining before the business reaches profitability. The professional charting structure supports a polished, presentation-ready output, helping users communicate the laundry service opportunity with clarity and credibility.
ROE Components and DuPont Analysis
The ROE components and DuPont analysis section helps users examine return on equity in a more detailed way by breaking performance into underlying drivers. For a laundry service, overall returns are influenced by profitability, asset efficiency, and financial structure. Profitability may depend on pricing, service mix, labor efficiency, utilities, detergents, rent, delivery costs, and overhead control. Asset efficiency may depend on how well the business uses its commercial washers, dryers, delivery vehicles, facility capacity, and working capital to generate revenue. Financial leverage may depend on whether the business is funded through equity, loans, equipment financing, or a combination of sources. By separating return on equity into these components, the model gives users a more analytical view of what is driving returns rather than only showing a final percentage. This is useful for owners and investors because a modest return may be caused by low margins, underused equipment, excessive capital investment, or an inefficient funding structure. The DuPont-style view can help users identify where improvements are possible, such as increasing pounds processed per machine, improving delivery route density, adding higher-margin specialty services, reducing variable costs, or adjusting the financing mix. For funding discussions, this component can also show that management understands not only whether the business is profitable, but why profitability and equity returns change over time.
Revenue Inputs
The revenue inputs section is where users define the commercial assumptions that drive sales in the Laundry Service Financial Model. This may include standard laundry pounds charged by the pound, specialty items charged per unit, eco-friendly laundry priced at a premium, annual price increases, customer growth, order frequency, volume ramp-up, and the mix between different service categories. Because revenue is the foundation of the forecast, this section helps users translate the operating plan into measurable financial projections. For a laundry service, small changes in price per pound, weekly order count, customer retention, or service mix can have a major impact on revenue and profitability. The revenue inputs component allows users to edit the assumptions to match their specific location, target market, pricing strategy, service offering, and capacity. A startup may use this section to estimate how many customers are needed to cover fixed costs, while an existing operator may use it to forecast the impact of adding pickup and delivery, premium detergents, commercial accounts, or recurring subscriptions. The outputs from this section flow into the revenue forecast and related profitability calculations, helping users understand whether the business can generate enough sales volume to support payroll, rent, equipment, utilities, and marketing. It also creates a transparent assumptions base for lenders or investors who want to see how projected sales were built.
Bank-Ready Reports
The bank-ready reports component organizes the financial model into lender-friendly outputs that support loan applications, funding requests, and professional business planning. Banks and other financing partners typically want to see clear revenue assumptions, projected profit and loss statements, cash flow forecasts, balance sheet outputs, startup cost needs, repayment capacity, and break-even timing. This section helps users present those details in a structured format rather than relying on informal estimates or disconnected spreadsheets. For a laundry service, this is particularly important because the business may require financing for commercial laundry equipment, facility improvements, delivery vehicles, leasehold build-out, deposits, initial inventory, and working capital. The bank-ready reports can help show how borrowed funds or owner investment will be used, how revenue is expected to grow, and whether projected cash flow can support ongoing operating expenses and debt obligations. The reports also make it easier to explain early losses or cash burn in the context of a longer-term profitability path. Instead of only showing a single annual sales number, the model can present a more complete financial picture, including expenses, margins, liquidity, and funding requirements. This gives lenders, investors, and stakeholders a clearer basis for evaluating the laundry service and can improve the professionalism of the overall business plan.
Revenue Breakdown
The revenue breakdown component provides a detailed view of revenue streams so users can understand where sales are expected to come from and how each service contributes to the total forecast. A laundry service may generate income from standard laundry by the pound, specialty items such as comforters or delicate garments, eco-friendly laundry services, pickup and delivery fees, recurring customer plans, commercial accounts, or other add-on services. This section helps separate those streams instead of treating all revenue as one generic line. The benefit is that users can evaluate which services carry the most volume, which have premium pricing, and which may provide stronger margins or recurring demand. For example, standard wash and fold may create the largest portion of total sales because it is high-volume, while specialty items or eco-friendly options may increase average order value. By seeing revenue in a detailed view, users can make better pricing, marketing, and operational decisions. If the model shows that one service is underperforming, the owner can adjust assumptions, rethink promotion strategy, or test whether the service should be expanded or reduced. The revenue breakdown also helps with capacity planning because different services may require different labor time, equipment usage, supplies, and delivery handling. For investors and lenders, this detail supports a more credible forecast because it shows how total revenue is built from specific, editable business drivers.
KPI Dashboard
The KPI dashboard component gives users a focused view of performance metrics and benchmarks that are important for managing a laundry service business. Key performance indicators may include revenue growth, gross margin, EBITDA margin, net profit margin, cash balance, order volume, average revenue per order, revenue per pound, payroll as a percentage of sales, cost of goods sold, utility costs, customer growth, payback period, and return metrics. A KPI dashboard is useful because financial statements alone do not always show whether operations are improving in the right areas. For a laundry business, management needs to know whether volume is increasing, whether labor is being used efficiently, whether delivery costs are manageable, and whether margins are moving toward sustainable levels. The dashboard can help users compare projected performance against internal targets or industry benchmarks, making it easier to identify gaps and opportunities. If gross margin is lower than expected, users can review detergent, packaging, labor, and utility assumptions. If cash flow is weak despite growing revenue, users can examine capital expenditures, working capital, or debt service. This component is also helpful for ongoing reviews because it turns the model into a management tool, not just a launch document. By presenting metrics in a clear format, the KPI dashboard supports faster decision-making, more informed investor conversations, and better monitoring of the business as assumptions change.
Break-Even Analysis
The break-even analysis component helps users estimate when the laundry service can cover its fixed and variable costs and begin generating sustainable profit. This is a critical planning area because laundry services often require significant upfront spending and recurring fixed expenses before reaching efficient customer volume. Inputs may include service pricing, pounds processed, specialty item sales, variable costs such as supplies and utilities, labor costs, rent, insurance, marketing, administrative expenses, and other overhead. The model can use these assumptions to determine the level of revenue, customer volume, or operating months needed to reach break-even. This output is useful for entrepreneurs because it helps answer practical questions such as how many pounds of laundry must be processed each month, how much recurring demand is needed, and how long the business may need funding support before it becomes self-sustaining. For lenders and investors, break-even timing is one of the clearest indicators of financial viability because it shows whether the business model can move beyond startup losses. It can also guide operational decisions. If break-even is too far away, users may test changes such as increasing prices, improving route density, lowering payroll burden, reducing rent, adding higher-margin services, or delaying certain capital expenditures.
File types:
Excel – Single-User: .xlsx
Excel – Multi-User: .xlsx
Similar ProductsOther customers were also interested in...


 HenrySheykin
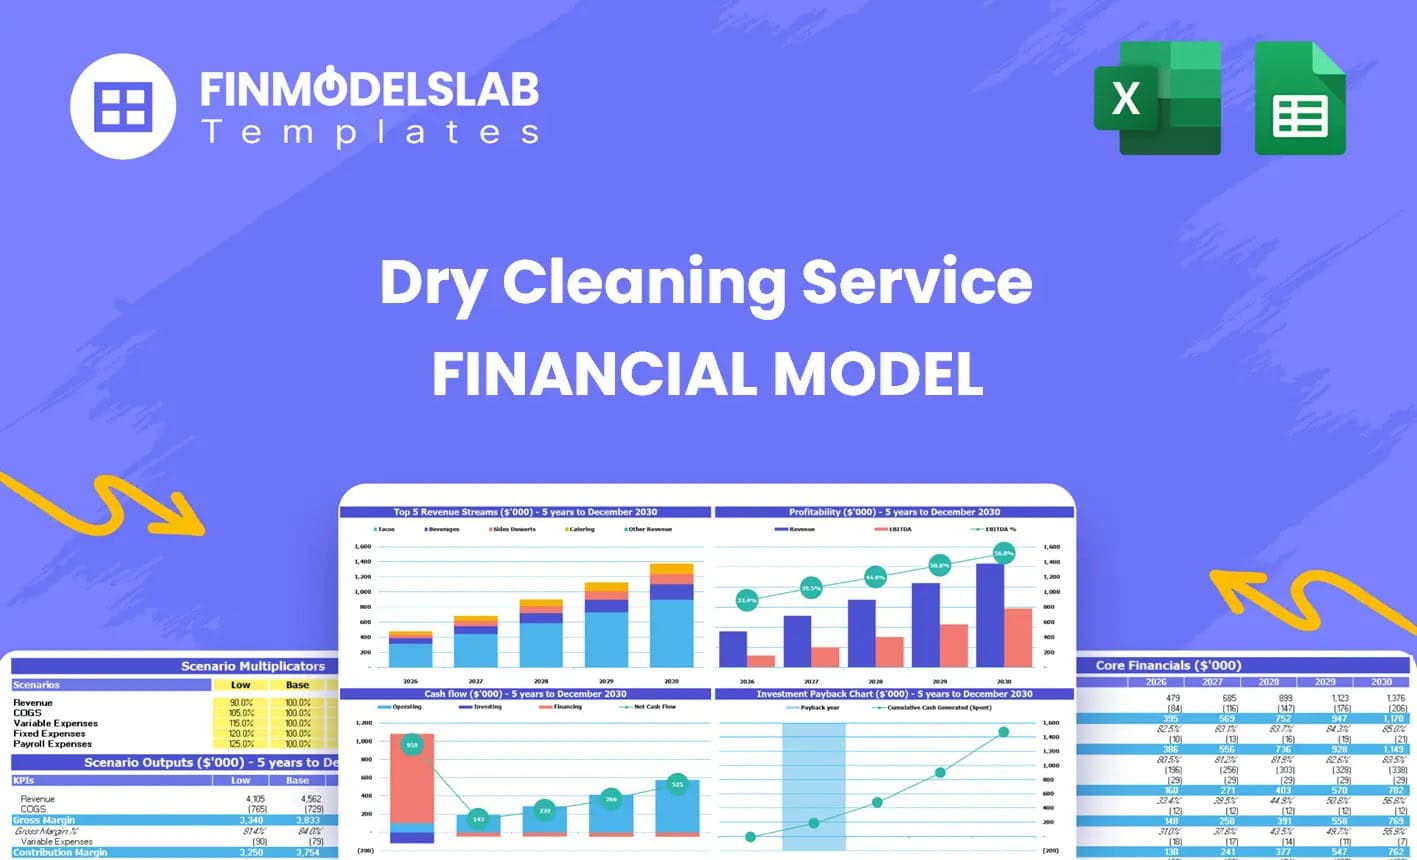
Dry Cleaner Financial Model Excel Template
The Dry Cleaning Service Financial Model helps entrepreneurs, business owners, consultants, analysts... Read more
 Jair
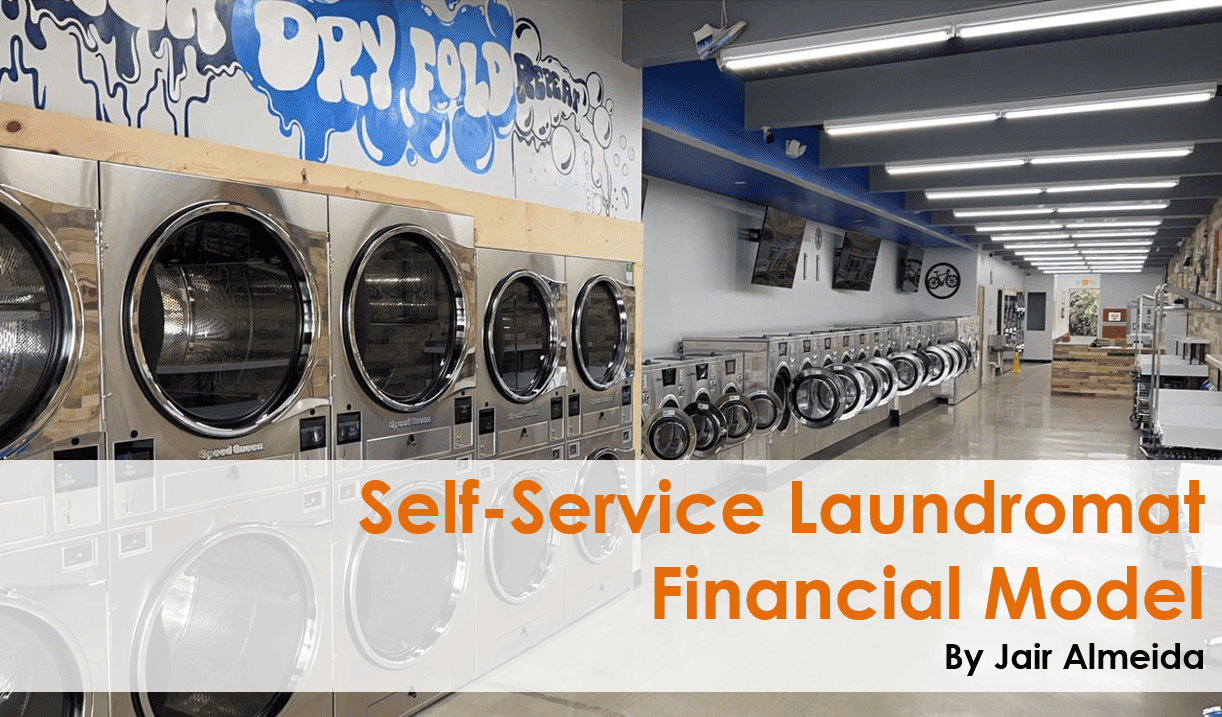
Self-Service Laundromat Financial Model and Budget...
The financial model for a self-service laundromat is a comprehensive tool that allows owners and inv... Read more

Dry Cleaning Financial Model and Budget Control Te...
The financial model for a dry cleaner is designed to help owners and investors in the industry make ... Read more

Cleaning Service Financial Model Excel Template
The Cleaning Service Financial Model helps entrepreneurs, founders, consultants, analysts, and busin... Read more

Pressure Washing Service Financial Model Excel Tem...
The Pressure Washing Financial Model helps users turn a pressure washing business idea into a struct... Read more

Carpet Cleaning Service Financial Model Excel Temp...
The Carpet Cleaning Service Financial Model helps entrepreneurs, business owners, consultants, analy... Read more

Plumber Financial Model Excel Template
The Plumbing Service Financial Model helps users turn a plumbing business idea, startup plan, or exp... Read more

Window Cleaning Service Financial Model Excel Temp...
The Window Cleaning Financial Model helps entrepreneurs, business owners, consultants, analysts, and... Read more

Lawn Care Financial Model Excel Template
The Lawn Care Service Financial Model helps entrepreneurs, business owners, consultants, analysts, a... Read more
You must log in to submit a review.