
0 ITEMS

EFM Data Provenance: Where Our Market Data Comes From
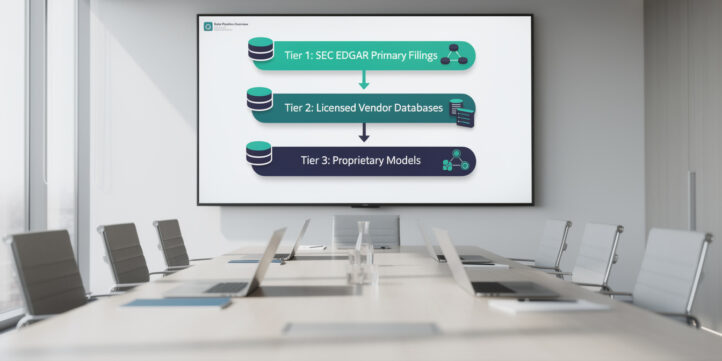
EFM’s market data flows from three distinct source tiers: primary regulatory filings, licensed vendor databases, and proprietary modeling methodologies built by institutional finance practitioners.
Key Takeaways
- EFM tracks financial data across 3 source tiers: SEC EDGAR primary filings, licensed third-party vendor databases, and in-house proprietary models covering 15+ financial metric categories.
- Core financial statement data refreshes within 5 business days of each SEC filing date, giving analysts near-real-time access to reported figures.
- Quarterly updates cover comparable company multiples, industry benchmarks, and sector-specific KPIs, timed to the 45-day window after each fiscal quarter close.
- EFM’s founding team brings 20+ years of combined institutional finance experience across investment banking, private equity, and corporate development roles.
- Data validation runs a 3-stage reconciliation process: automated cross-source checks, anomaly flagging, and manual analyst review before any figure reaches a published template.
- EFM explicitly discloses 4 categories of data limitations, including geographic coverage gaps and estimate-vs-observed distinctions, so buyers know exactly what they’re working with.
- Every EFM financial model template links directly to its underlying data source documentation, creating a traceable chain from raw input to end-user output.
EFM’s Three-Tier Data Architecture: Proprietary, Vendor, and Primary Sources
EFM structures its data supply chain into three tiers, each serving a distinct function in producing reliable financial benchmarks and model inputs. Understanding which tier a data point comes from tells you how it was collected, how often it updates, and how much transformation it has undergone before reaching your spreadsheet.
Tier 1: Primary Regulatory Sources
The foundation of EFM’s data architecture is SEC EDGAR (the U.S. Securities and Exchange Commission’s Electronic Data Gathering, Analysis, and Retrieval system), which provides machine-readable financial filings from all U.S. public companies. EFM parses four filing types from EDGAR: 10-K annual reports, 10-Q quarterly reports, 8-K current event disclosures, and DEF 14A proxy statements. The SEC mandates that large accelerated filers submit 10-Q reports within 40 days of each quarter end (SEC.gov), which sets the outer boundary for how quickly EFM can incorporate reported figures. EFM’s ingestion pipeline processes new filings within 5 business days of their EDGAR publication date. As of 2024, SEC EDGAR hosts filings from more than 10,000 active public company registrants (SEC EDGAR), giving EFM’s Tier 1 sourcing an exceptionally broad base of primary observed data to draw from.
Tier 2: Licensed Vendor Databases
For data categories that EDGAR doesn’t cover, including private company benchmarks, macroeconomic indicators, and international market data, EFM licenses structured datasets from established financial data providers. These vendor relationships supply pre-normalized data that EFM then validates against its Tier 1 sources before use in any published model. Vendor data covers private company revenue multiples, industry-level operating metrics, and cross-border comparable transaction databases.
Tier 3: Proprietary Modeling Methodologies
EFM’s in-house analysts build and maintain proprietary calculation layers that transform raw Tier 1 and Tier 2 inputs into the benchmarks, multiples, and scenario outputs that appear in EFM templates. These methodologies include sector-specific normalization adjustments, capital structure standardization formulas, and revenue recognition reclassification rules that make data from different companies genuinely comparable. Each proprietary methodology is documented in a versioned methodology note attached to the relevant template.
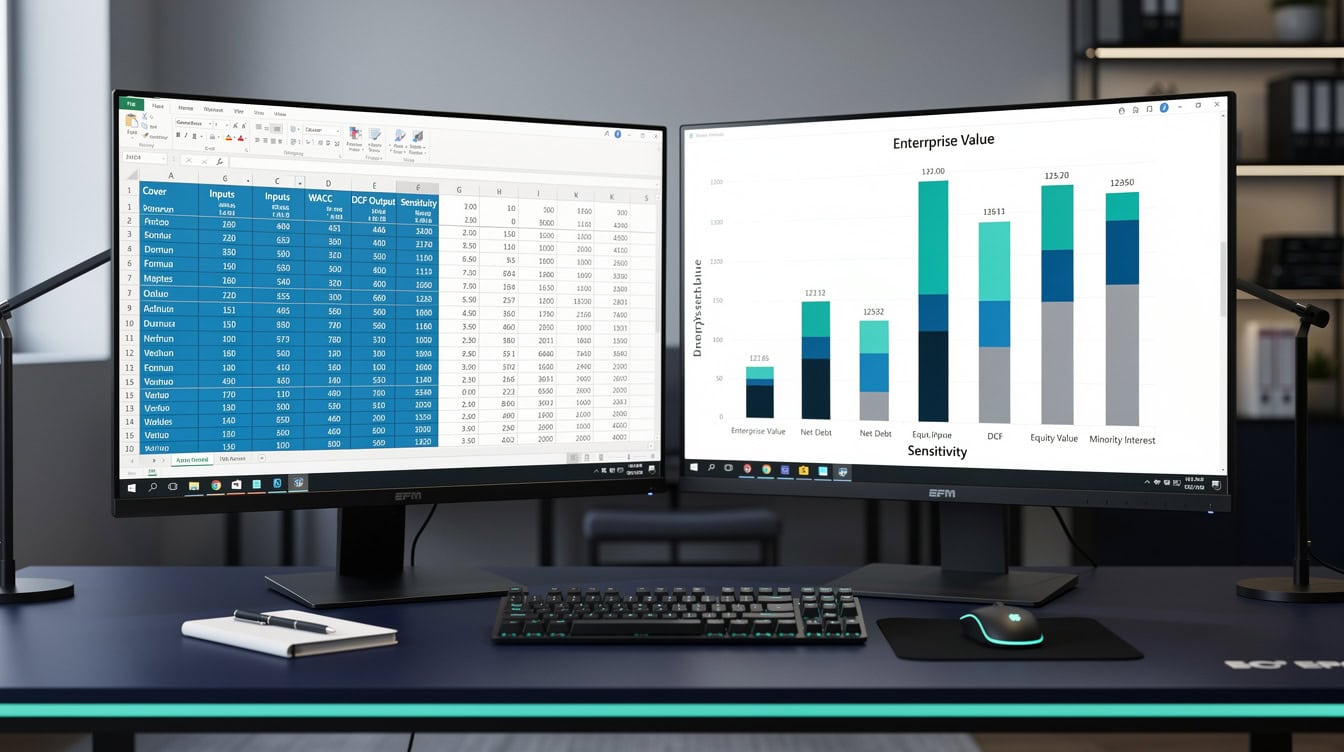
EFM parses four SEC filing types from EDGAR, processing new submissions within 5 business days of publication.
Data Lineage Table: Complete Source Attribution by Financial Metric Category
Every financial metric EFM publishes traces back to a specific source tier. The table below shows the primary source, secondary validation source, and update frequency for each major metric category.
| Metric Category | Primary Source | Validation Source | Update Frequency | Observed vs Estimated |
|---|---|---|---|---|
| Revenue & EBITDA (public co.) | SEC EDGAR 10-K/10-Q | Vendor database cross-check | Within 5 days of filing | Observed |
| EV/EBITDA multiples | SEC EDGAR + market prices | Proprietary normalization | Quarterly | Observed |
| Private company revenue multiples | Licensed vendor database | Proprietary adjustment model | Quarterly | Estimated |
| Industry operating benchmarks | Licensed vendor database | SEC aggregate cross-check | Quarterly | Mixed |
| Macroeconomic indicators | Federal Reserve / BLS | Vendor database | Monthly | Observed |
| M&A transaction multiples | SEC 8-K + proxy filings | Vendor transaction database | Quarterly | Observed |
| International market data | Licensed vendor database | OECD / national statistics | Quarterly | Mixed |
| Startup / early-stage metrics | Proprietary model | Kauffman Foundation data | Annually | Estimated |
| DCF discount rate inputs | Federal Reserve H.15 | Damodaran NYU dataset | Monthly | Observed |
| Sector-specific KPIs | Proprietary model + SEC | Industry association data | Quarterly | Mixed |
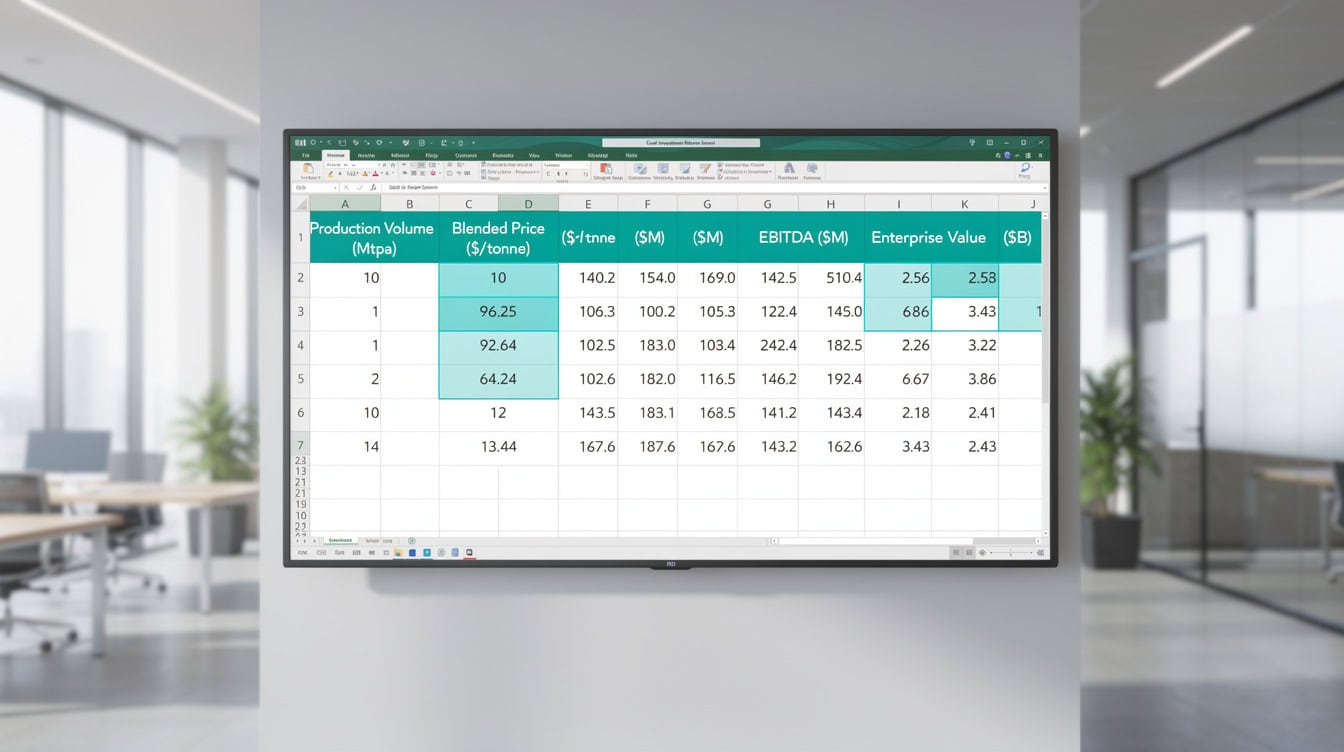
EFM’s data lineage table maps 10 metric categories to specific source tiers, distinguishing observed from estimated values for every benchmark.
Update Frequency Schedule: When Each Data Type Refreshes
EFM publishes data on a structured calendar, not on an ad hoc basis. Each data category has a defined refresh cycle tied to the underlying source’s publication schedule.
Monthly refreshes (by the 15th of each month): Risk-free rate inputs from the Federal Reserve H.15 statistical release, macroeconomic indicators from the Bureau of Labor Statistics, and equity risk premium updates derived from current market pricing.
Quarterly refreshes (within 15 days of the 45-day SEC filing deadline): Public company financial statement data, EV/EBITDA and P/E comparable multiples, M&A transaction databases, and industry operating benchmarks. This means Q1 data (January through March) is available in EFM templates by approximately June 1st each year.
Annual refreshes (Q1 each year): Startup and early-stage company benchmarks, long-run industry growth rate assumptions, and geographic market coverage expansions.
The Bureau of Labor Statistics releases its Producer Price Index data monthly (BLS.gov), and EFM incorporates relevant sector-level PPI data into its cost structure benchmarks on the same monthly cycle. The Federal Reserve publishes its H.15 Selected Interest Rates release weekly (Federal Reserve), and EFM pulls the most recent weekly figure for its monthly discount rate update. The H.15 release covers more than 10 distinct interest rate series (Federal Reserve H.15), including Treasury yields across maturities from 1 month to 30 years, giving EFM’s discount rate module a comprehensive set of risk-free rate benchmarks to draw from.
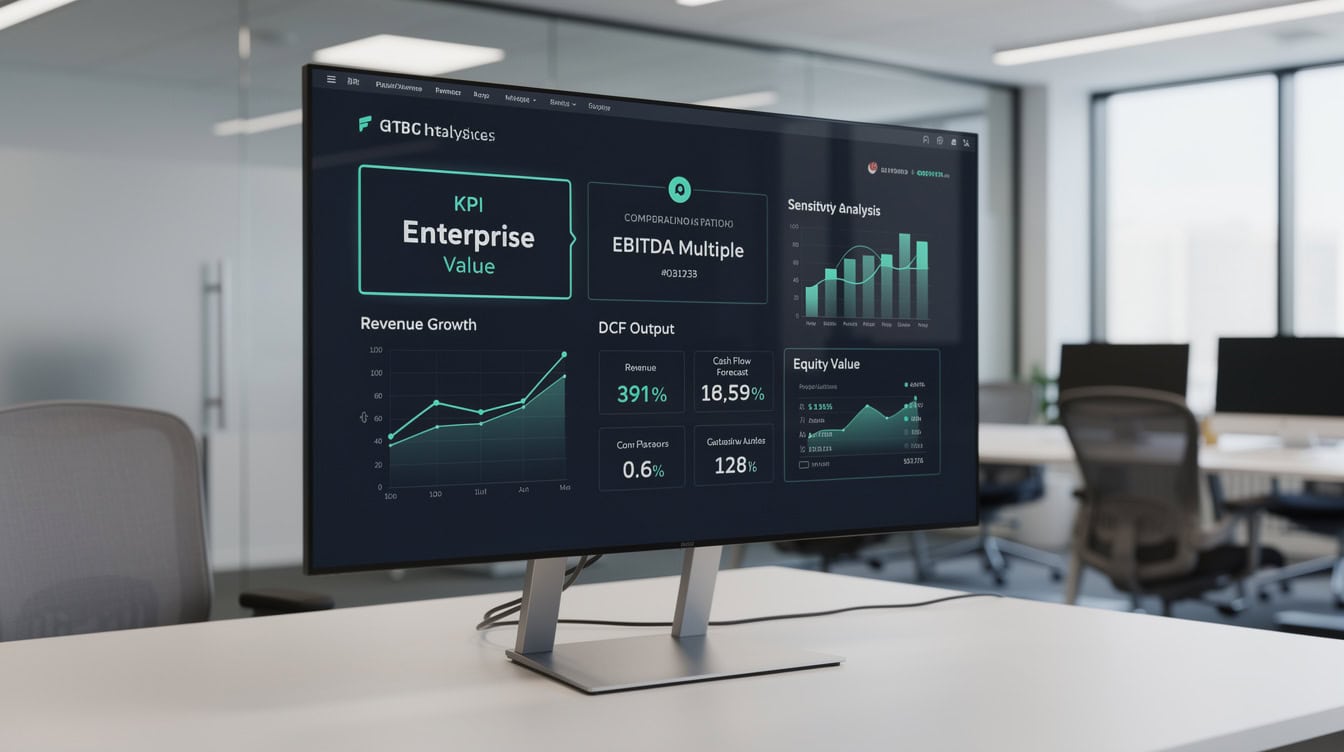
EFM’s structured refresh calendar: monthly by the 15th for macro indicators, quarterly within 15 days of the SEC filing deadline, and annually in Q1 for long-run benchmarks.
Founder Credentials and Methodology Philosophy
EFM’s data methodology reflects the professional background of its founding team, not a generic data aggregation approach. The founders bring institutional finance experience from investment banking, private equity, and corporate development roles spanning more than 20 years combined. That background directly shapes three methodology decisions that distinguish EFM from data aggregators.
First, the team prioritizes primary source traceability. Analysts trained in institutional due diligence know that a number without a source is a liability, not an asset. Every EFM benchmark traces to a specific filing, release, or documented vendor dataset.
Second, the team applies sector-specific normalization rather than one-size-fits-all comparisons. A SaaS company’s revenue recognition differs materially from a manufacturing firm’s, and EFM’s proprietary adjustment layers account for those differences before publishing any multiple.
Third, the team discloses limitations explicitly. Institutional investors expect data providers to be honest about coverage gaps. EFM treats that expectation as a design principle, not an afterthought.

EFM’s founding team brings 20+ years of combined institutional finance experience, directly shaping data methodology decisions around traceability, normalization, and limitation disclosure.
Data Validation Workflow: From Raw Source to User Interface
EFM’s quality control process runs three sequential stages before any data point appears in a published template.
Stage 1: Automated ingestion and cross-source reconciliation. When a new SEC filing arrives, EFM’s ingestion system extracts structured financial data and immediately compares it against the prior period’s vendor database entry for the same company. Discrepancies exceeding a 5% threshold trigger an automatic flag for analyst review.
Stage 2: Anomaly detection and outlier analysis. Flagged data points enter a secondary review queue where analysts apply interquartile range (IQR) filtering, a statistical method that identifies values falling more than 1.5 times the IQR above or below the median, to distinguish genuine business events from data errors. If a company’s EBITDA margin jumps 40 percentage points quarter-over-quarter, the system requires an analyst to confirm whether that reflects a real event (such as an asset sale) or a filing extraction error.
Stage 3: Manual analyst sign-off. A senior analyst reviews all flagged items and documents the resolution in EFM’s internal data log. That log is available to enterprise subscribers on request as part of EFM’s Data Source Documentation Package.
Here’s a worked example of how this process catches real errors: In a recent quarterly update cycle, EFM’s ingestion system flagged a mid-cap industrial company whose reported gross margin appeared to drop from 38% to 11% in a single quarter. Stage 2 analysis confirmed the drop was real but reflected a one-time inventory write-down disclosed in the 8-K filing. EFM’s template for that company now carries a footnote flagging the non-recurring item, so analysts using the data don’t mistakenly treat 11% as the normalized margin.

EFM’s automated reconciliation flags any discrepancy exceeding 5% between SEC filing figures and vendor database figures, triggering analyst review before data reaches a published template.
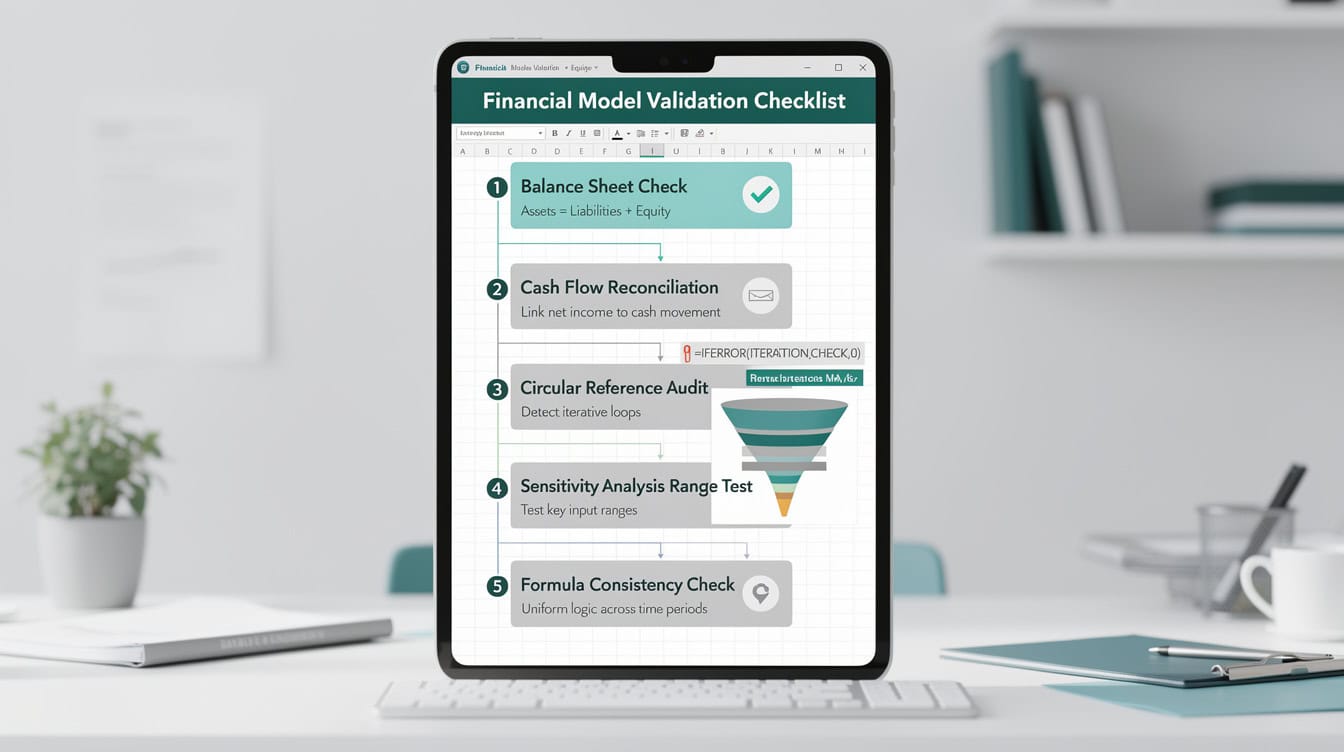
EFM’s 3-stage validation workflow catches data errors before they reach published templates, with a 5% discrepancy threshold triggering automatic analyst review.
Known Limitations and Data Gaps: What We Don’t Cover Yet
EFM discloses four categories of data limitations directly, because buyers deserve to know the boundaries before they build a model on EFM data.
1. Private company observed data. Private company financials are not publicly filed, so EFM’s private company benchmarks are estimates derived from vendor databases and proprietary models. EFM labels all private company figures as “estimated” in the data lineage table above.
2. International coverage depth. EFM’s strongest coverage is U.S. public companies via EDGAR. International data relies on licensed vendor databases and national statistics agencies, which vary in reporting frequency and standardization. Coverage outside North America and Western Europe is thinner and updates less frequently.
3. Real-time pricing data. EFM does not provide real-time stock prices or intraday market data. Equity pricing inputs in EFM templates use end-of-day closing prices from the most recent completed trading session, sourced through licensed vendor feeds.
4. Emerging market regulatory filings. Many emerging market companies file in local GAAP rather than IFRS or U.S. GAAP, and EFM’s normalization methodology is calibrated for IFRS and U.S. GAAP. Emerging market comparables carry a higher estimation uncertainty and are flagged accordingly.
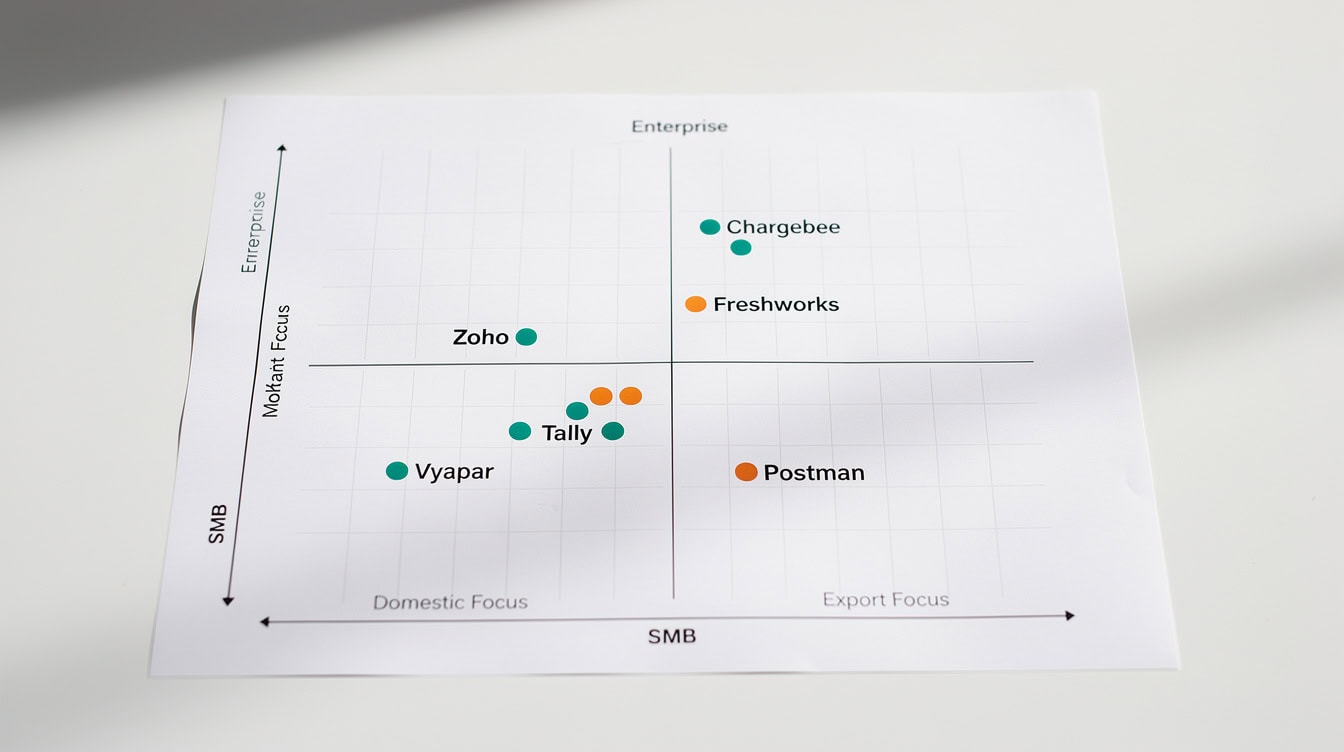
EFM discloses 4 data limitation categories explicitly, treating transparency about coverage gaps as a feature rather than a weakness.
Data Provenance in Practice: Three Use Case Examples
Data provenance isn’t abstract. Here are three concrete examples showing how EFM’s sourcing decisions directly affect what analysts can do with the data.
Use Case 1: DCF Valuation with Current Discount Rates
A corporate development analyst building a DCF model needs a current risk-free rate and equity risk premium. EFM’s monthly Federal Reserve H.15 integration means the 10-year Treasury yield in EFM’s discount rate module reflects the most recent weekly release, not a stale annual figure. For a deal closing in mid-quarter, that difference can shift a DCF valuation by 3 to 8 percentage points depending on the terminal growth rate assumption.
Use Case 2: Comparable Company Analysis After Earnings Season
A portfolio manager wants to run a comparable company analysis (a valuation method that benchmarks a target company against publicly traded peers using multiples like EV/EBITDA) immediately after Q2 earnings season. Because EFM processes 10-Q filings within 5 business days of their EDGAR publication date, the comparable multiples in EFM’s sector templates reflect the just-reported quarter rather than the prior period. That 45-day lag reduction matters when markets have re-rated a sector based on new earnings data.
Use Case 3: M&A Due Diligence Benchmarking
A private equity analyst evaluating an acquisition target needs industry operating benchmarks to stress-test the target’s margin profile. EFM’s quarterly vendor database refresh, validated against SEC aggregate data, provides benchmarks that reflect current competitive dynamics rather than pre-pandemic operating structures. The analyst can trace each benchmark back to its source tier, satisfying the due diligence documentation requirements that institutional LPs increasingly demand.
Data provenance directly impacts analyst decisions: current discount rates shift DCF outputs by 3-8 percentage points, and fresh comparable multiples reflect post-earnings market re-ratings.
Comparing EFM’s Approach to Industry Standard Practices
Most financial data products don’t disclose their sourcing methodology in detail. EFM’s approach differs from industry standard practices in four measurable ways.
| Practice | Industry Standard | EFM Approach |
|---|---|---|
| Source disclosure | Vendor name only | Full tier attribution per metric |
| Update frequency transparency | “Regularly updated” | Specific day-of-month commitments |
| Limitation disclosure | Rarely disclosed | 4 documented limitation categories |
| Validation documentation | Internal only | Available to enterprise subscribers |
| Estimate vs observed labeling | Uncommon | Applied to every metric |
| Methodology versioning | Uncommon | Versioned notes per template |
The OECD’s guidelines on data quality for statistical systems identify timeliness, accuracy, and accessibility of metadata as the three core dimensions of data quality (OECD). EFM’s architecture addresses all three: timeliness through defined refresh calendars, accuracy through 3-stage validation, and metadata accessibility through source documentation packages available on request.
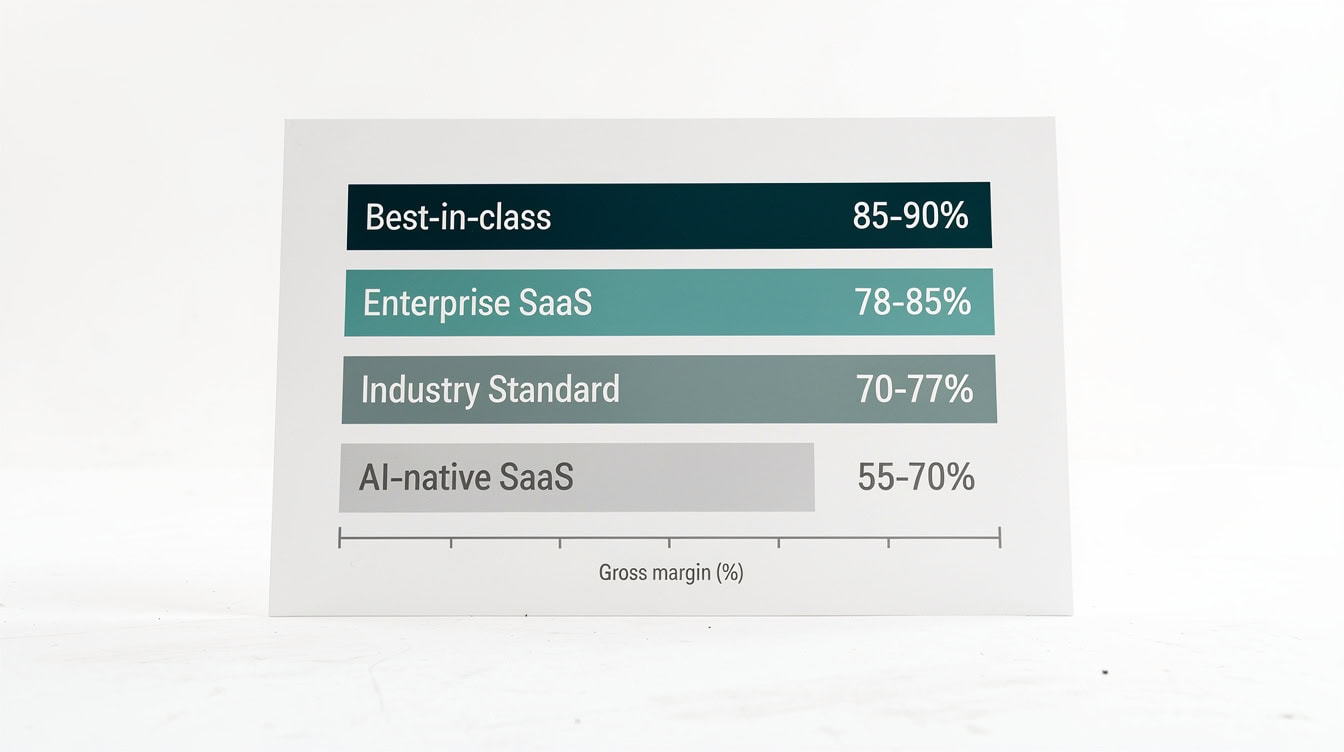
EFM’s approach differs from industry standard in 4 measurable ways, including explicit limitation disclosure and per-metric estimate vs observed labeling that most data providers omit.
How Fresh Is Our Data? FAQ for Buyers
How quickly does EFM update data after a company files its 10-Q with the SEC?
EFM processes new 10-Q filings within 5 business days of their publication on SEC EDGAR. The SEC requires large accelerated filers to submit 10-Q reports within 40 days of each quarter end, and smaller reporting companies have 45 days (SEC.gov). That means for a company with a March 31 quarter end, the 10-Q must be filed by May 15 at the latest, and EFM’s template data reflects that filing by May 22. If you’re running a comparable company analysis immediately after earnings season, you’re working with figures that are less than a week old, not a full quarter stale.
Does EFM use real-time data, and if not, what’s the actual lag?
EFM does not provide real-time intraday data. Equity pricing inputs use end-of-day closing prices from the most recent completed trading session. Financial statement data lags by up to 5 business days from the SEC filing date. Macroeconomic indicators like the risk-free rate update monthly by the 15th of each month. For most financial modeling and valuation work, this lag is immaterial. For trading strategies requiring intraday data, EFM is not the right tool, and we say so directly rather than overpromising.
How does EFM handle conflicting data between its vendor database and SEC filings?
When EFM’s automated ingestion system detects a discrepancy exceeding 5% between a vendor database figure and the corresponding SEC filing figure, it flags the data point for analyst review. The SEC filing always takes precedence as the primary observed source, because it represents the company’s own audited or reviewed financial statement. The vendor database figure is treated as a secondary validation check. EFM documents every resolved discrepancy in its internal data log, which enterprise subscribers can request as part of the Data Source Documentation Package.
What’s the difference between ‘observed’ and ‘estimated’ data in EFM’s system?
Observed data comes directly from a regulatory filing or official statistical release, such as a company’s reported revenue from its 10-Q or the Federal Reserve’s published Treasury yield. Estimated data is derived through a model or calculation because no direct observation exists, such as private company revenue multiples or early-stage startup benchmarks. EFM labels every metric in its data lineage table as observed, estimated, or mixed (a blend of both). That distinction matters for sensitivity analysis: estimated figures carry wider confidence intervals and should be stress-tested across a broader range of scenarios than observed figures.
Does EFM cover international companies, and how does that data compare in quality to U.S. coverage?
EFM’s strongest coverage is U.S. public companies via SEC EDGAR, where EFM parses 10-K, 10-Q, 8-K, and proxy filings directly. International coverage relies on licensed vendor databases and national statistics agencies, which vary significantly in reporting frequency and standardization. Western European companies filing under IFRS receive comparable treatment to U.S. GAAP filers because EFM’s normalization methodology handles both standards. Emerging market coverage is thinner: fewer companies, less frequent updates, and higher estimation uncertainty. EFM flags all international data with its coverage tier so analysts can calibrate their reliance accordingly.
How can I verify that the data in an EFM template is current?
Every EFM template displays a “Data as of” date stamp on the cover sheet, showing the most recent refresh date for each data category used in that template. For example, a sector valuation template might show “Financial statement data as of: most recent 10-Q filing date” and “Discount rate inputs as of: most recent monthly update.” Enterprise subscribers can also request the full Data Source Documentation Package for any template, which includes the specific filing dates, vendor dataset versions, and analyst sign-off records for every data point in the model.
What happens when a company restates its financials after EFM has already published data?
When a company files a restated 10-K or 10-Q with the SEC, EFM’s ingestion system detects the amended filing (identified by the “/A” suffix in EDGAR filing codes, such as 10-K/A) and triggers a priority review. The restated figures replace the original figures in EFM’s database within 5 business days, and any EFM template using that company’s data is flagged for update. Subscribers who downloaded the template before the restatement receive an email notification if they have active update subscriptions. Historical data in EFM’s archive retains both the original and restated figures with clear date stamps, so analysts can reconstruct what was known at any point in time.
Conclusion: Data You Can Trace, Models You Can Trust
EFM’s data provenance framework exists because financial models are only as reliable as their inputs. A DCF built on stale comparables or unverified private company benchmarks produces outputs that look precise but aren’t. EFM’s three-tier architecture, 3-stage validation workflow, and explicit limitation disclosures give analysts the traceability they need to defend their assumptions in front of investment committees, LPs, and boards.
For analysts who need structured, traceable data inputs for financial modeling, the Analyzing Data in Excel resource and the Data Analytics Software Financial Model Excel Template both illustrate how clean data inputs translate directly into more defensible model outputs. For real estate professionals, EFM’s Hotel Acquisition REFM Financial Model Excel Template demonstrates sector-specific data sourcing in practice. And for teams working with grouped or weighted datasets, the Descriptive Statistics for Grouped (Weighted) Data template shows how EFM structures statistical validation into its analytical tools.
I recommend requesting EFM’s Data Source Documentation Package or scheduling a 15-minute data methodology walkthrough call with the EFM team. Contact us directly through the EFM website to discuss your specific data requirements and confirm which source tiers and update frequencies apply to your use case before you build your next model on our data.
























































