
0 ITEMS

Waste To Energy Plant Financial Model Template (25-Years)
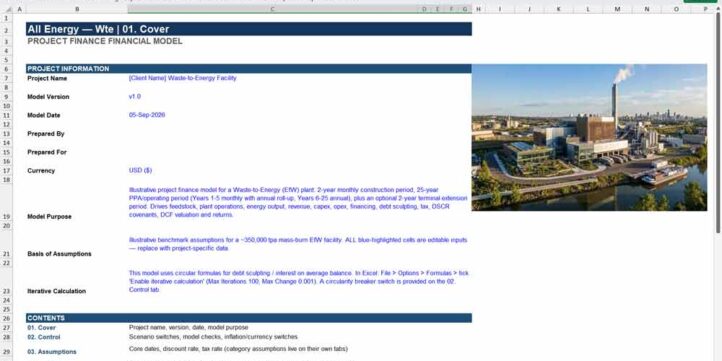
Excel financial model designed to evaluate the financial feasibility, profitability, financing structure, and investment returns of a waste-to-energy (WtE) plant.
Waste-to-Energy Plant Financial Model Template
Excel financial model designed to evaluate the financial feasibility, profitability, financing structure, and investment returns of a waste-to-energy (WtE) plant operating under a long-term power purchase agreement (PPA).
The model is intended for project developers, investors, lenders, financial analysts, consultants, and students studying infrastructure project finance.
It covers the entire project lifecycle, including construction, long-term operations, financing, taxation, cash flow forecasting, and investment valuation. The workbook contains 25 interconnected tabs.
Main features
Feedstock and plant operations
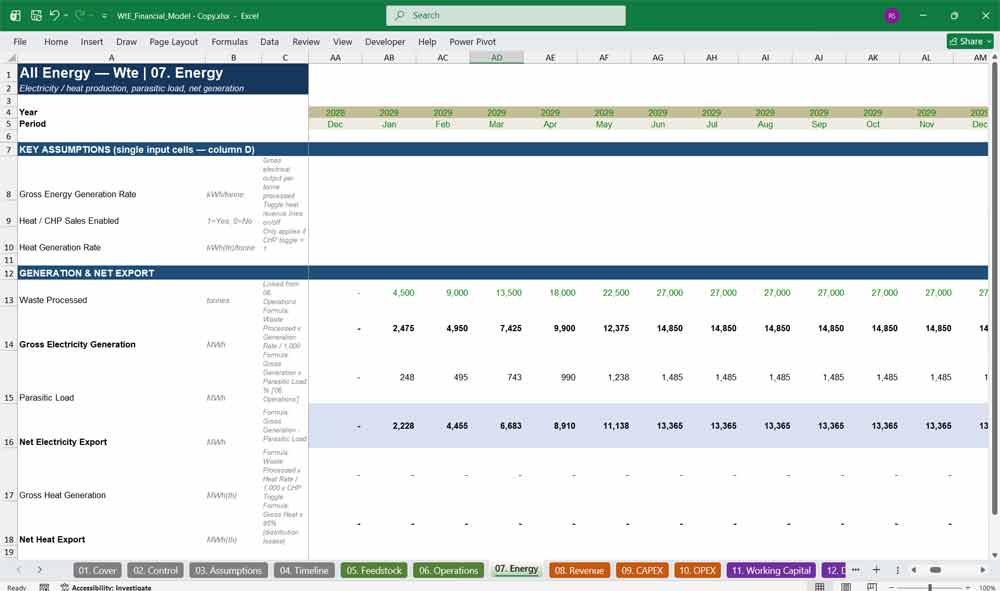
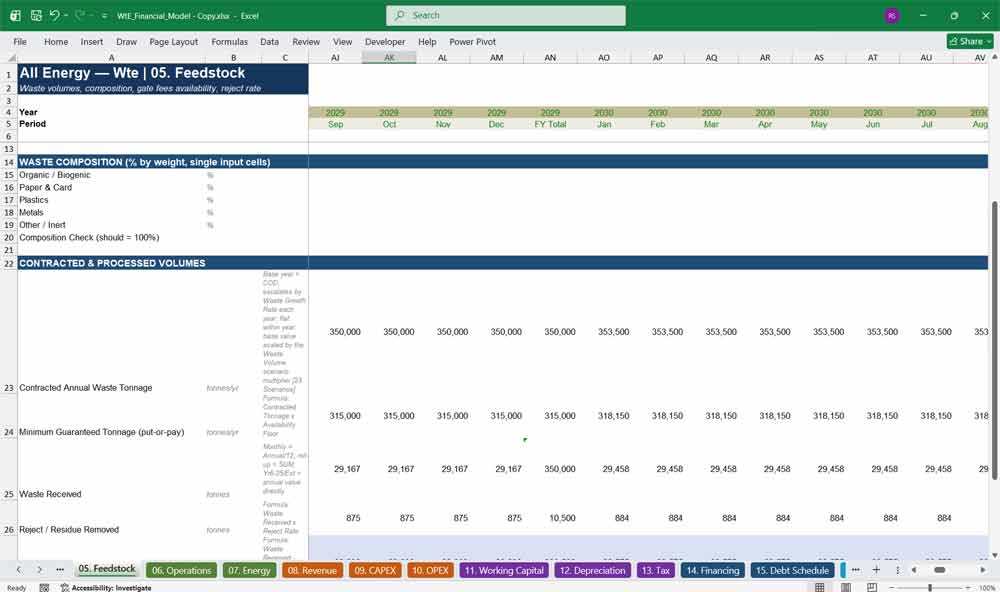
The model forecasts the availability, quantity, composition, moisture content, calorific value, and rejection rate of incoming waste. It also incorporates plant capacity, throughput, operational availability, conversion efficiency, ramp-up, planned maintenance, and equipment degradation.
Energy production and revenue
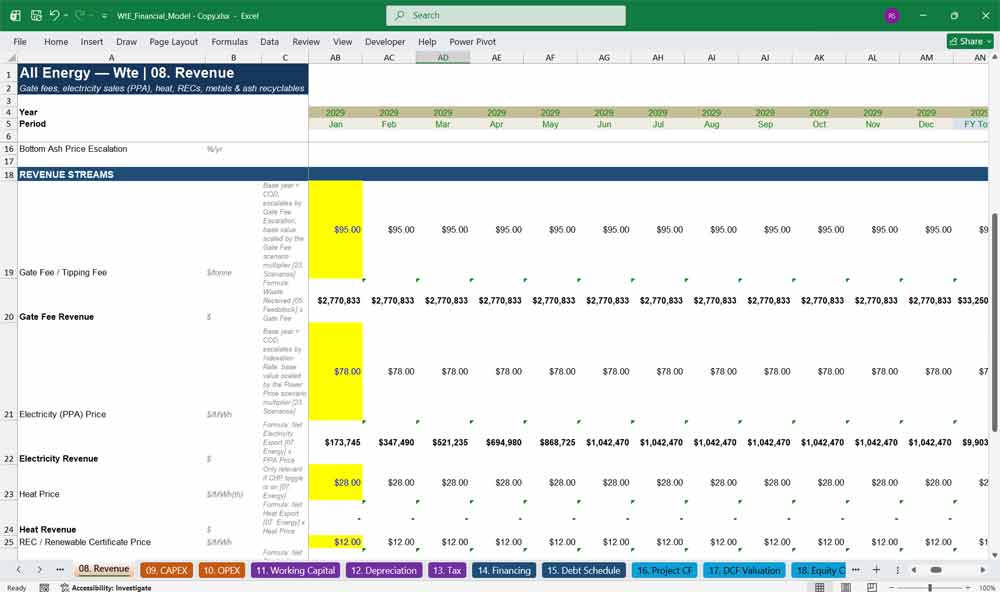
It calculates gross and net electricity generation from processed waste, accounting for the plant’s own electricity consumption. Optional heat generation can also be modeled. Revenue streams include:
- Gate or tipping fees received for accepting waste.
- Electricity sales under a PPA.
- Heat sales and combined heat and power (CHP) revenue.
- Renewable energy certificates and incentives.
- Recovered metals and ash-related by-product income.
Capital expenditure and operating costs
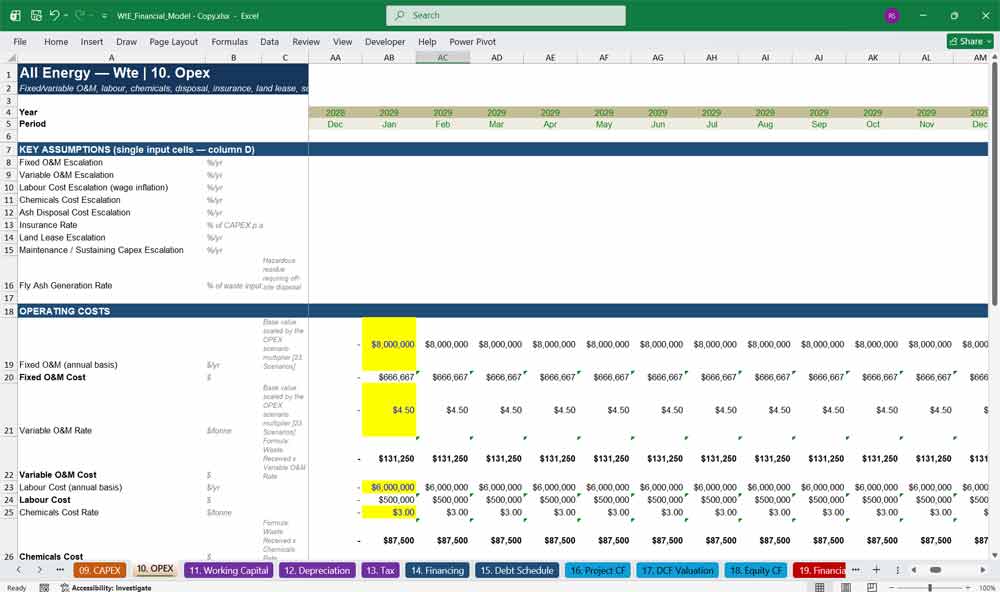
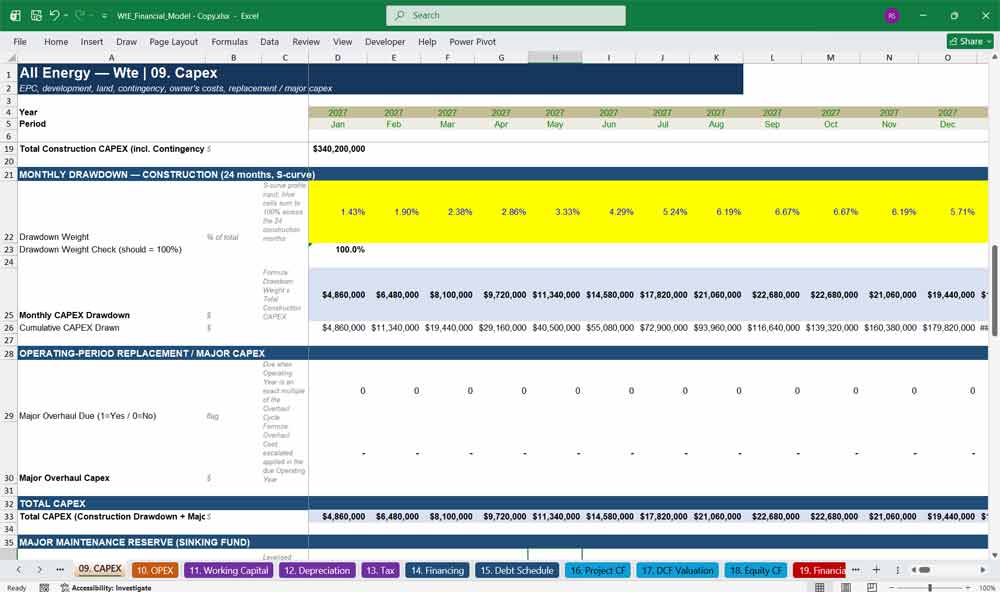
The model includes construction costs, engineering and procurement, land, development expenses, contingency, and major maintenance reserves. Operating expenses include labor, chemicals, fixed and variable maintenance, insurance, land lease, ash disposal, and sustaining capital expenditure.
Financing and taxation
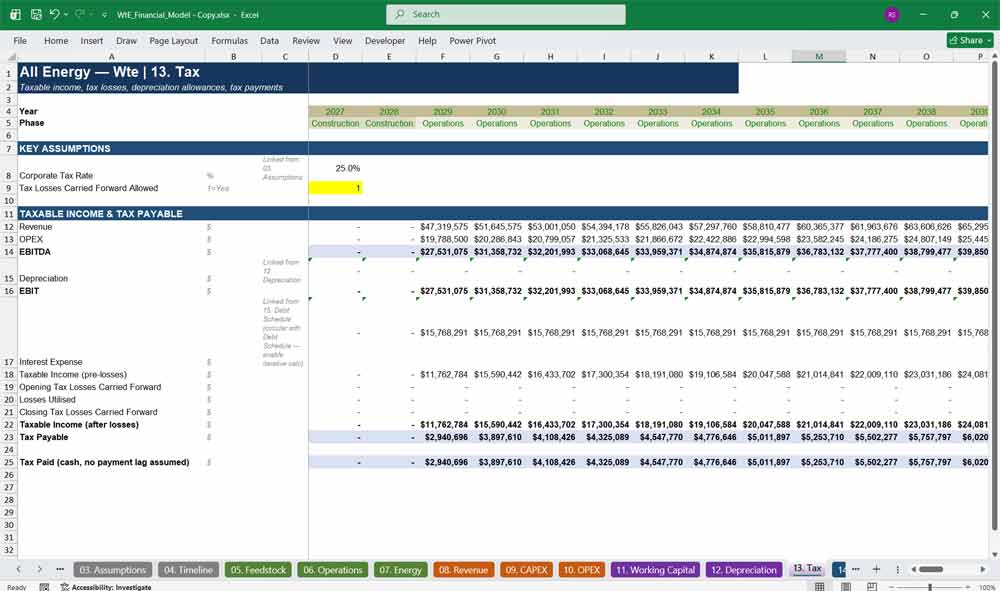
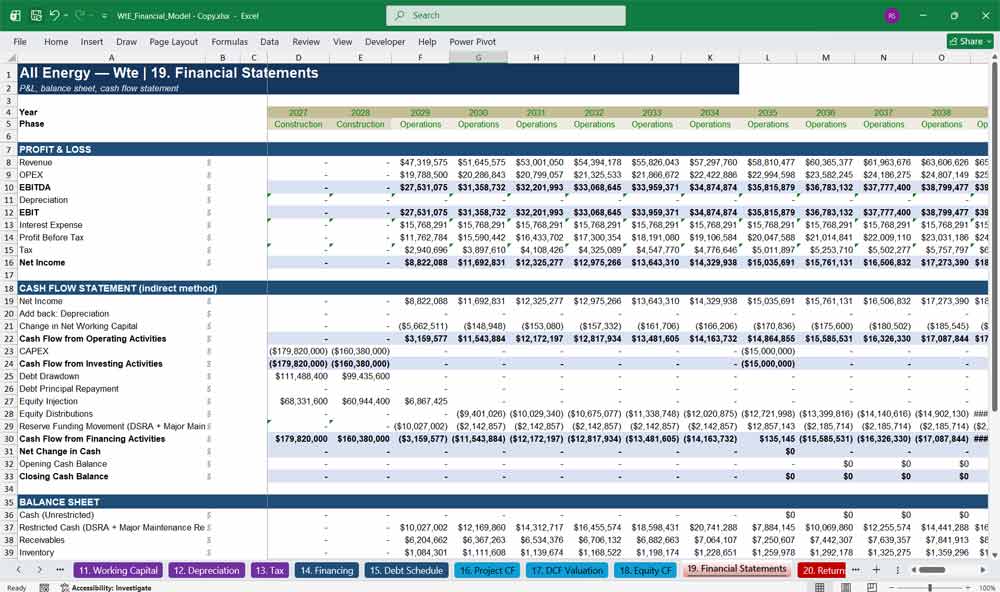
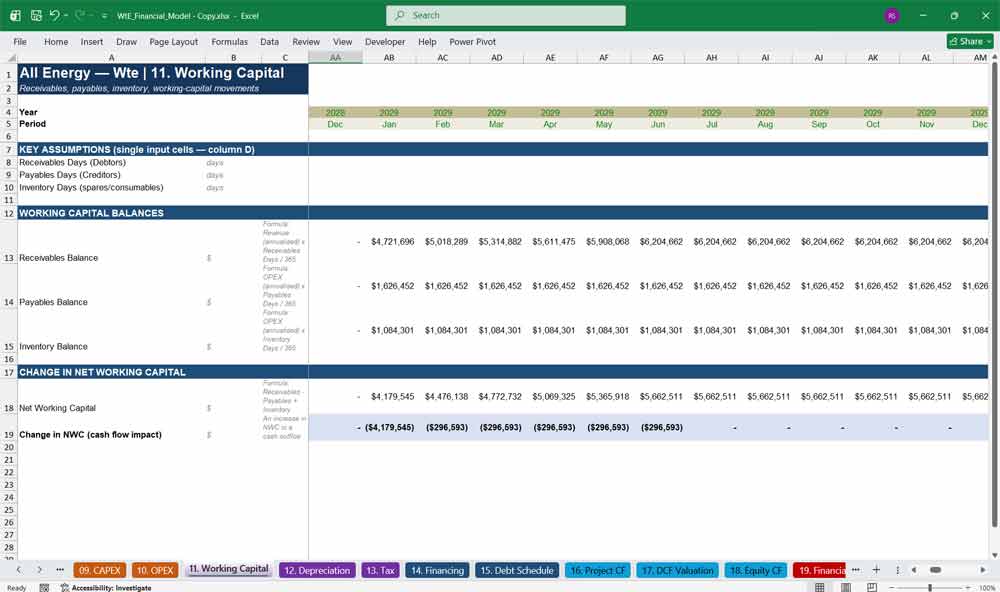
It incorporates debt and equity funding, construction loans, term loans, interest rates, repayment schedules, tax calculations, depreciation, loss carryforwards, working capital, and debt service reserve accounts.
Financial metrics and valuation
The model calculates several key performance indicators used to assess project viability.
- Project IRR: Measures the return generated by the project before financing effects.
- Equity IRR: Measures the return earned by equity investors after debt servicing and reserve funding.
- Net present value (NPV): Estimates the present value of future cash flows after discounting.
- Discounted cash flow (DCF): Estimates enterprise and equity value using the weighted average cost of capital (WACC).
- MOIC: Measures the total investment proceeds relative to invested capital.
- Payback period: Estimates how long it takes to recover the original investment.
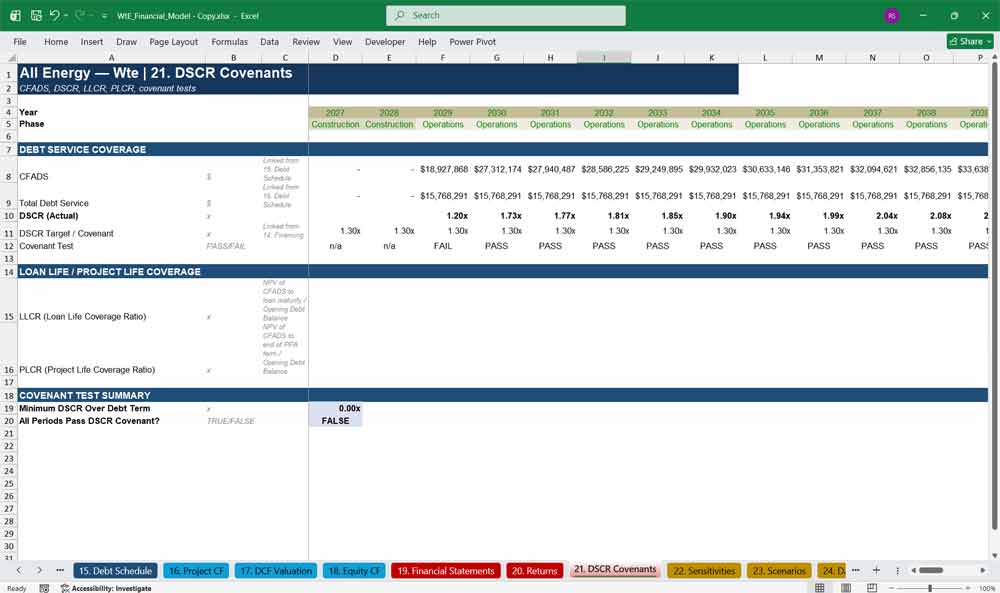
- Debt service coverage ratio (DSCR): Measures the cash available to service debt relative to scheduled debt payments.
These metrics help investors determine whether projected cash flows are sufficient to justify the investment and satisfy financing requirements.
Debt structuring and lender requirements
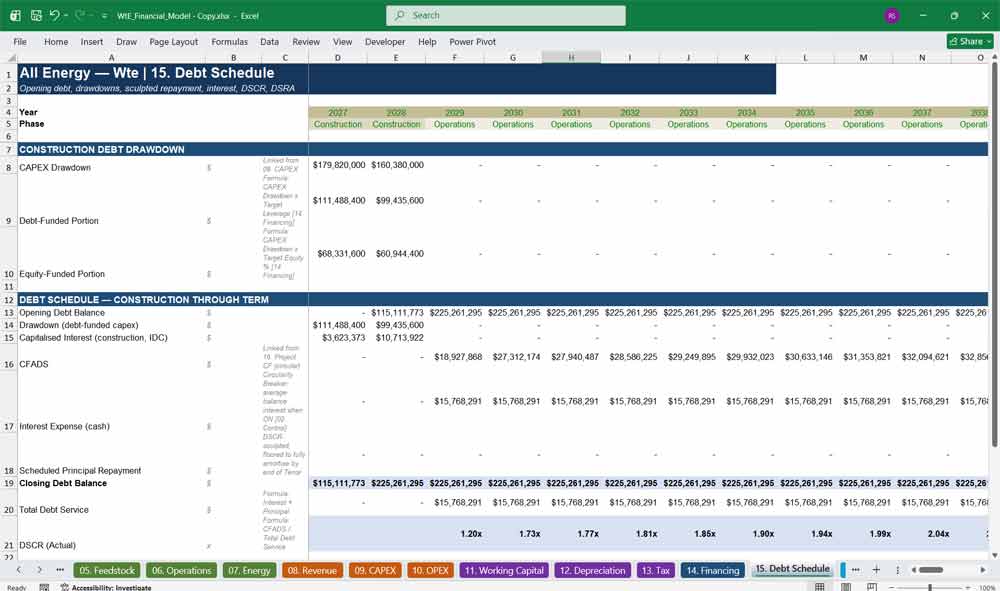
A central feature is the DSCR-sculpted debt repayment schedule. Instead of using a simple fixed repayment pattern, the model adjusts principal repayments according to available cash flow and a target DSCR.
It also incorporates:
- Debt service reserve account (DSRA) funding and release.
- Construction-period interest capitalization.
- Grace periods, loan tenor, and financing rates.
- Final-year balloon repayment.
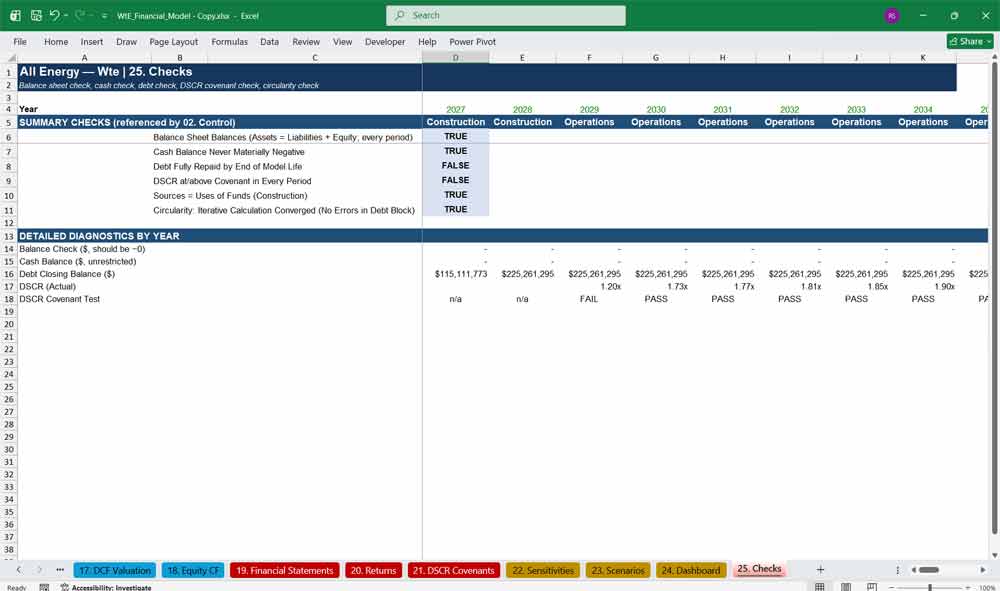
- Automated covenant compliance checks.
- Equity funding requirements when additional cash is needed.
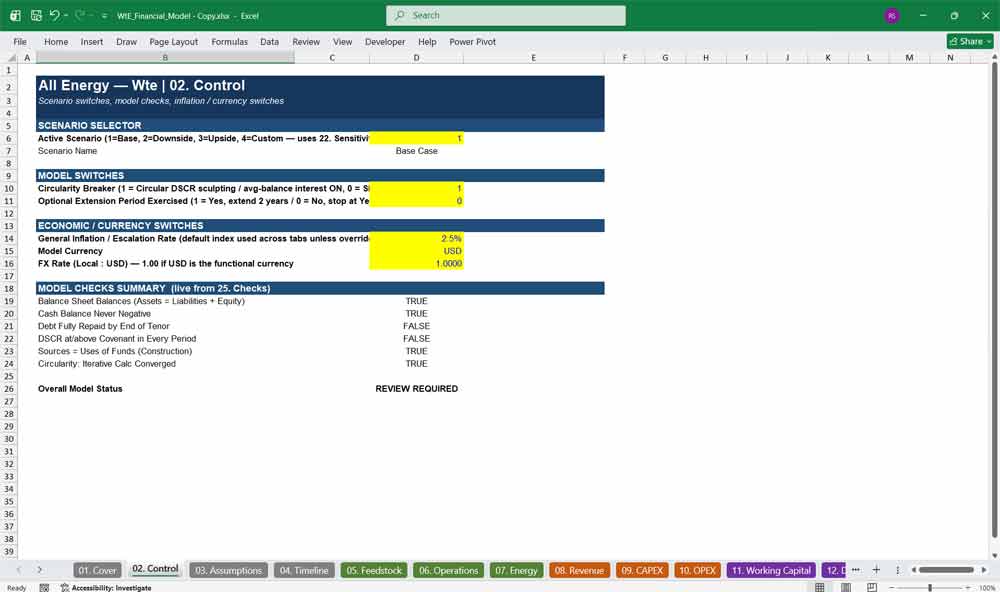
The model also checks whether the balance sheet balances, cash remains non-negative, debt is repaid, financing sources equal uses, and iterative debt calculations converge.
Scenario and sensitivity analysis
The workbook allows users to evaluate different operating and financing conditions.
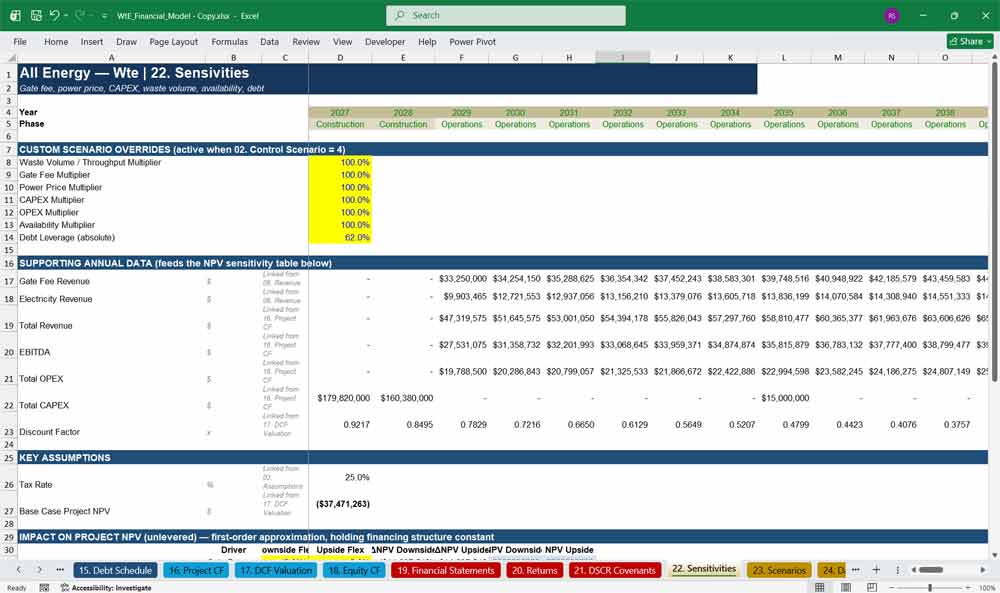
Scenario analysis provides four selectable cases:
- Base case.
- Downside case.
- Upside case.
- Custom case.
Sensitivity analysis examines how changes in key assumptions affect project NPV, including waste volumes, electricity prices, capital expenditure, operating costs, and financing terms.
This helps identify the main drivers of project value and assess how resilient the investment might be under less favorable conditions.
Practical applications
The model can support:
- Feasibility studies: Assessing whether a proposed waste-to-energy facility is financially viable.
- Investment decisions: Estimating project value, profitability, and equity returns.
- Project finance: Developing financing structures and testing debt repayment capacity.
- Lender due diligence: Evaluating DSCR compliance and the sustainability of projected cash flows.
- Investor presentations: Producing summary dashboards and financial outputs for investment committees.
- Operational planning: Evaluating plant capacity, waste availability, energy efficiency, and operating costs.
- Risk management: Stress-testing assumptions and identifying factors that could undermine returns.
Similar ProductsOther customers were also interested in...



 eFinancialModels
Electric Vehicle (EV) Charging Station Financial M...
With this comprehensive 5- or 10-year monthly tool, investors can assess the viability of setting up... Read more

Financial Model for Mobile App | Mobile App Busine...
The Mobile App Financial Plan Template in Excel allows you to develop financial projections when lau... Read more

 HenrySheykin
Food Truck Financial Model Excel Template
The Food Truck Financial Model helps entrepreneurs, founders, business owners, consultants, and anal... Read more

Green Hydrogen Production from Wind Energy Financi...
The Green Hydrogen from Wind Financial Model aims to comprehensively forecast a horizon of 40 years ... Read more

Simple Mutual Non-Disclosure Agreement Template
Protect your business secrets with ease using our Simple Mutual Non-Disclosure Agreement Template. S... Read more

Solar Energy Financial Model
The Solar Energy Financial Model Spreadsheet Template in Excel assists you in preparing a sophistica... Read more

 Peter Graf
The Customer-Centric Financial Model for Restauran...
Starting a restaurant without a financial plan is like driving a car blindfolded. You wouldn´t do i... Read more
You must log in to submit a review.