0 ITEMS

Sales Forecast Template: How to Build One in Excel
A sales forecast template estimates the revenue a business will most likely earn in coming months, built from past sales, a chosen method and explicit assumptions, and it becomes the base for the budget and the cash plan. This guide builds a 24-month forecast for a business-to-business software company in Excel, with three scenarios and a comparison against budget.
Key Takeaways
- A forecast estimates likely sales, a budget sets targets and spending limits, and a financial model links both.
- Three steps build a forecast: gather and clean history, pick a method, then stress-test conservative, base and optimistic scenarios.
- In this example, the base case books USD 994,744 of revenue over 24 months before costs, against USD 805,586 conservative and USD 1,211,292 optimistic.
- In this example, year 1 base revenue of USD 317,482 is USD 12,518 (3.79%) below the USD 330,000 budget.
- Trend lines, seasonal indices and bottom-up builds each suit a different stage, and a founder can cross-check one method against another.
A forecast predicts sales, a budget sets targets, and a model connects them
A sales forecast is an estimate of the revenue a business will most likely earn in coming periods, built from history and assumptions. A budget is the plan the owner commits to: revenue targets plus spending limits. A financial model is the spreadsheet that links the sales forecast to costs, profit and cash.
The forecast asks what is likely; the budget asks what the business will do about it. Comparing them each month shows whether to cut spending, chase sales or revise the plan. The eFinancialModels library includes a collection of budgeting templates.
The US Small Business Administration (SBA) business plan guide tells founders to provide a prospective financial outlook for the next five years and to use quarterly, or even monthly, projections for the first year (SBA business plan guide). The 24-month forecast below is the detailed first part of such an outlook.
In the Federal Reserve Banks’ small business survey, a nationwide convenience sample of small employer firms, “More than half of firms cited paying operating expenses (56%) or uneven cash flows (51%) as challenges” (Federal Reserve Banks, 2025).
In the Federal Reserve Banks’ following survey, fielded from September to November 2025 among a nationwide convenience sample of small employer firms, “Reaching customers and growing sales was the most commonly reported operational challenge” (Federal Reserve Banks, 2026).
A sales forecast follows three steps: history, method and scenarios
Step 1: gather and clean history. Collect monthly revenue from invoices or the accounting system for at least 12 months. Remove one-off deals and refunds that will not repeat, and fill gaps.
Step 2: choose the method. Steady growth suits a trend line, cyclical demand needs a seasonal index, and a new product needs a bottom-up build.
Step 3: build the model and test scenarios. Put every assumption on one inputs sheet, calculate the forecast with formulas, and run a conservative, a base and an optimistic case. Each case should change drivers such as churn and new customers.
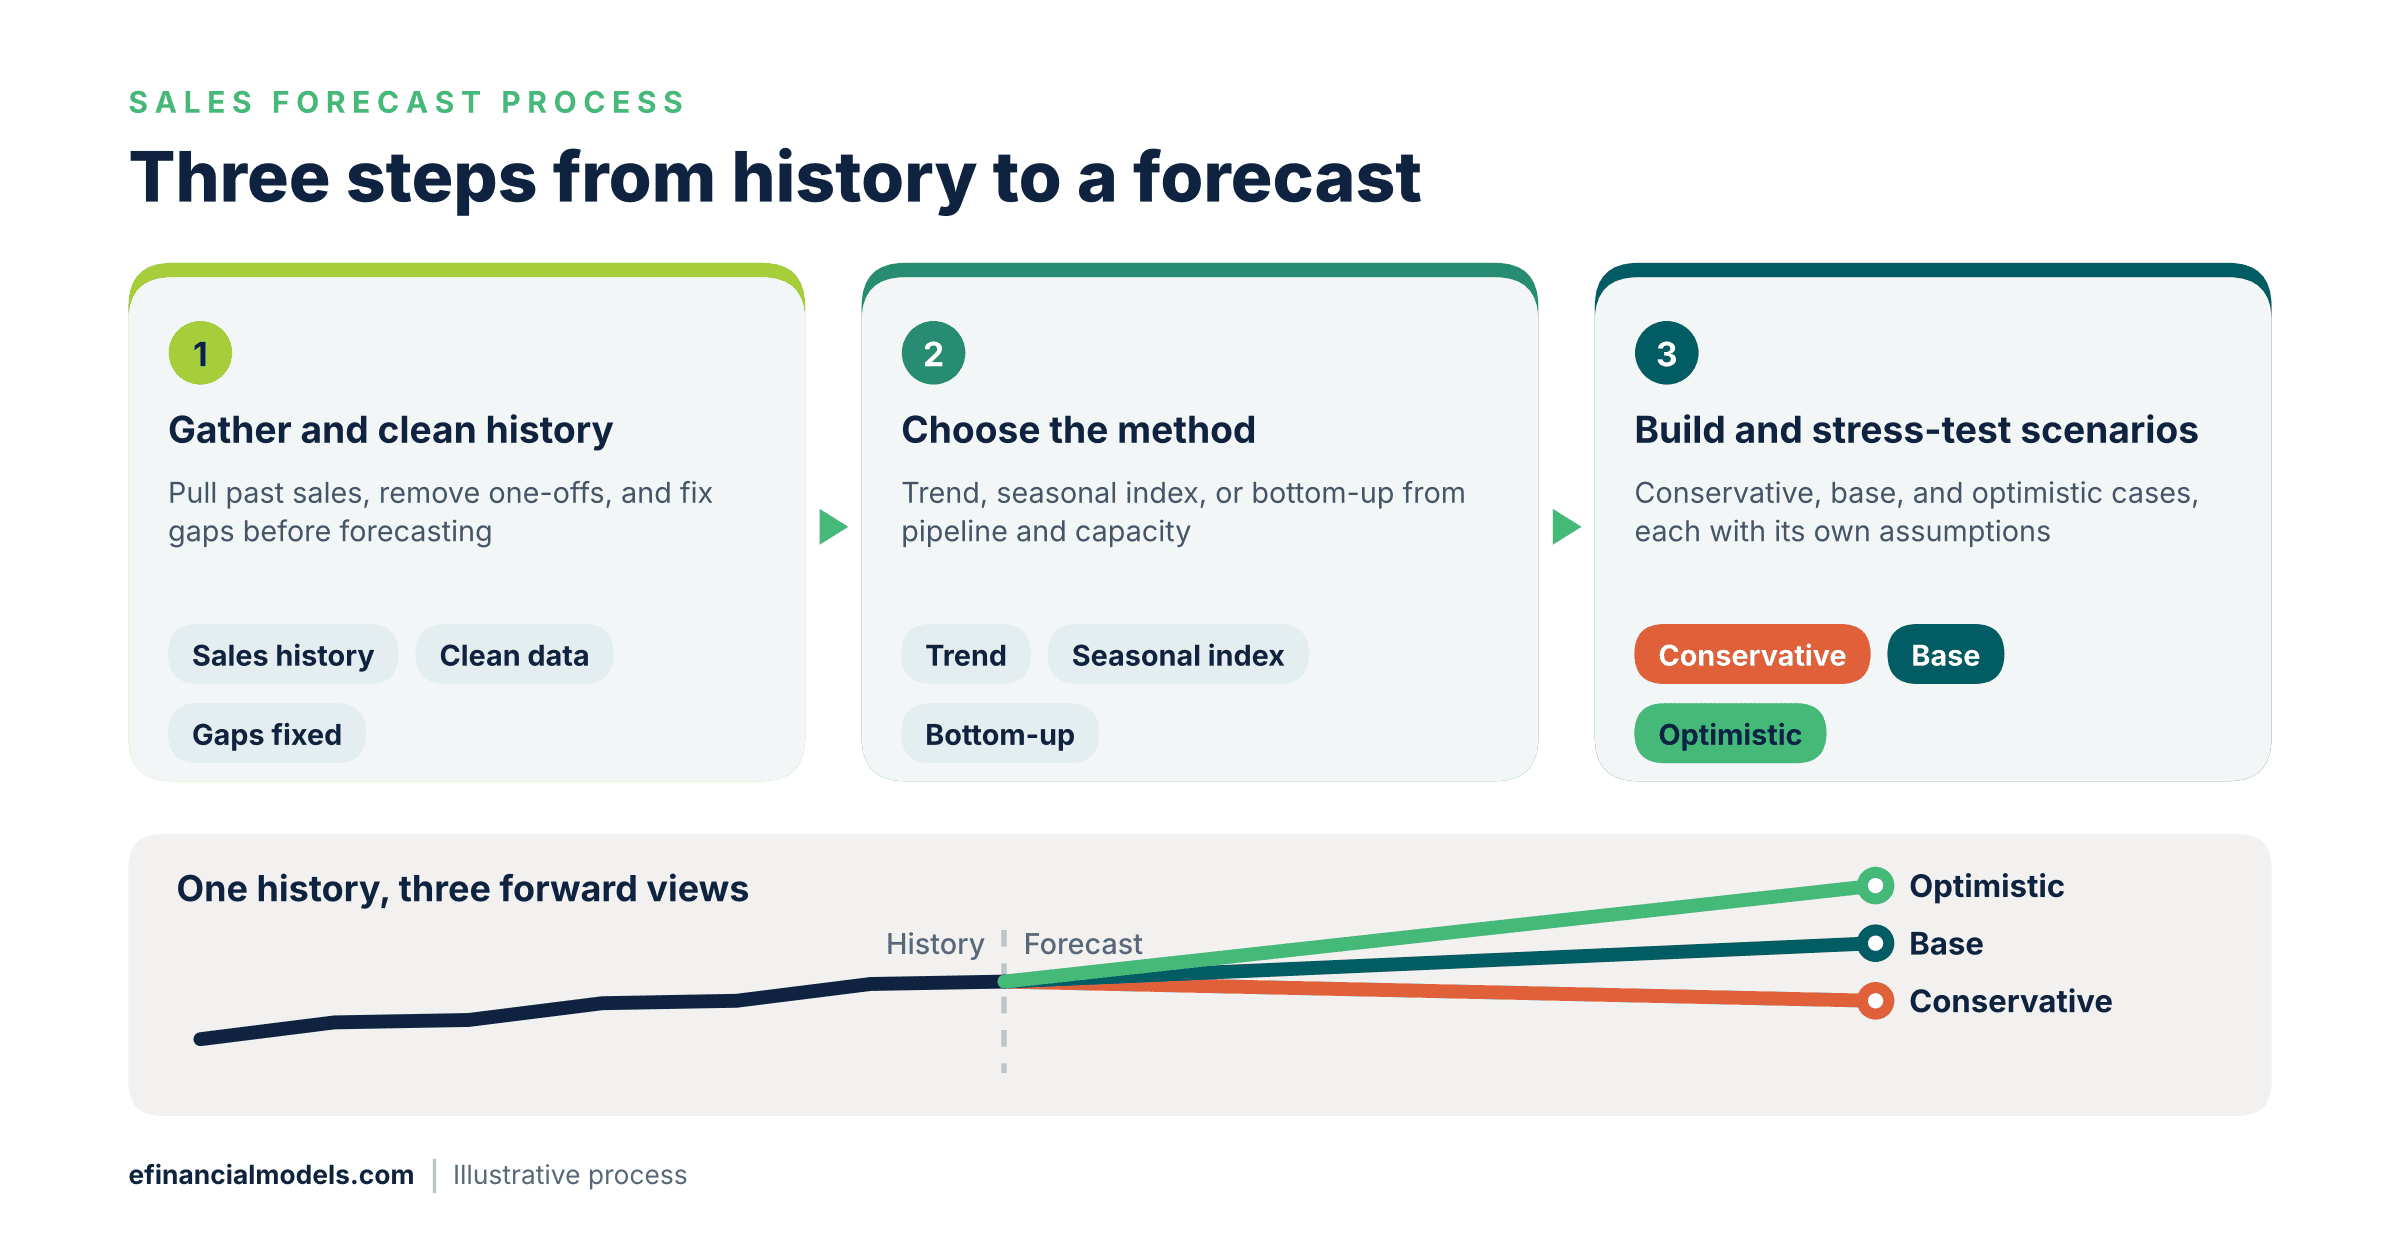
The sales forecast process from history to scenarios. Source: eFinancialModels Analysis.
Trend, seasonal index and bottom-up methods suit different businesses
A linear trend suits steady growth. Excel’s linear forecasting function fits a straight line through past points and returns the value on that line for a future period. It takes the future period number, the past revenue and the past period numbers: =forecast.linear(x, known_y's, known_x's).
A seasonal index is a month’s average revenue divided by the average month across all years. A hypothetical index of 1.20 means that month typically runs 20% above average, so its trend forecast is multiplied by 1.20.
A bottom-up forecast starts with countable drivers such as leads, conversion rates, customers and price, and multiplies them into revenue.
| Method | Data needed | Best for | Main weakness |
|---|---|---|---|
| Linear trend | 12 or more months of sales | Steady, mature sales | Ignores seasons and launches |
| Seasonal index | 24 or more months of sales | Cyclical demand | Needs two full cycles |
| Bottom-up | Price, conversion, capacity | New products and start-ups | Rests on assumptions that need testing |
A founder can average a simple trend with a bottom-up forecast as a cross-check and investigate any large gap between them.
Worked example: a SaaS inputs sheet drives the whole forecast
The example is a hypothetical business-to-business software-as-a-service (SaaS) company. It starts with 40 paying customers and charges USD 300 per customer per month, known as average revenue per user (ARPU). Monthly recurring revenue (MRR), the subscription revenue billed each month before upsells, equals closing customers times ARPU, and upsells add 1.0% of opening MRR on top.
The three scenarios differ only in the monthly churn rate, the share of opening customers lost each month (3.5%, 2.5% and 1.8%), and in the monthly growth of new customers (1%, 3% and 5% from 8 new customers in month 1). A USD 330,000 year 1 budget and last year’s 12 monthly actuals, rising from USD 5,200 to USD 12,120, complete the inputs.
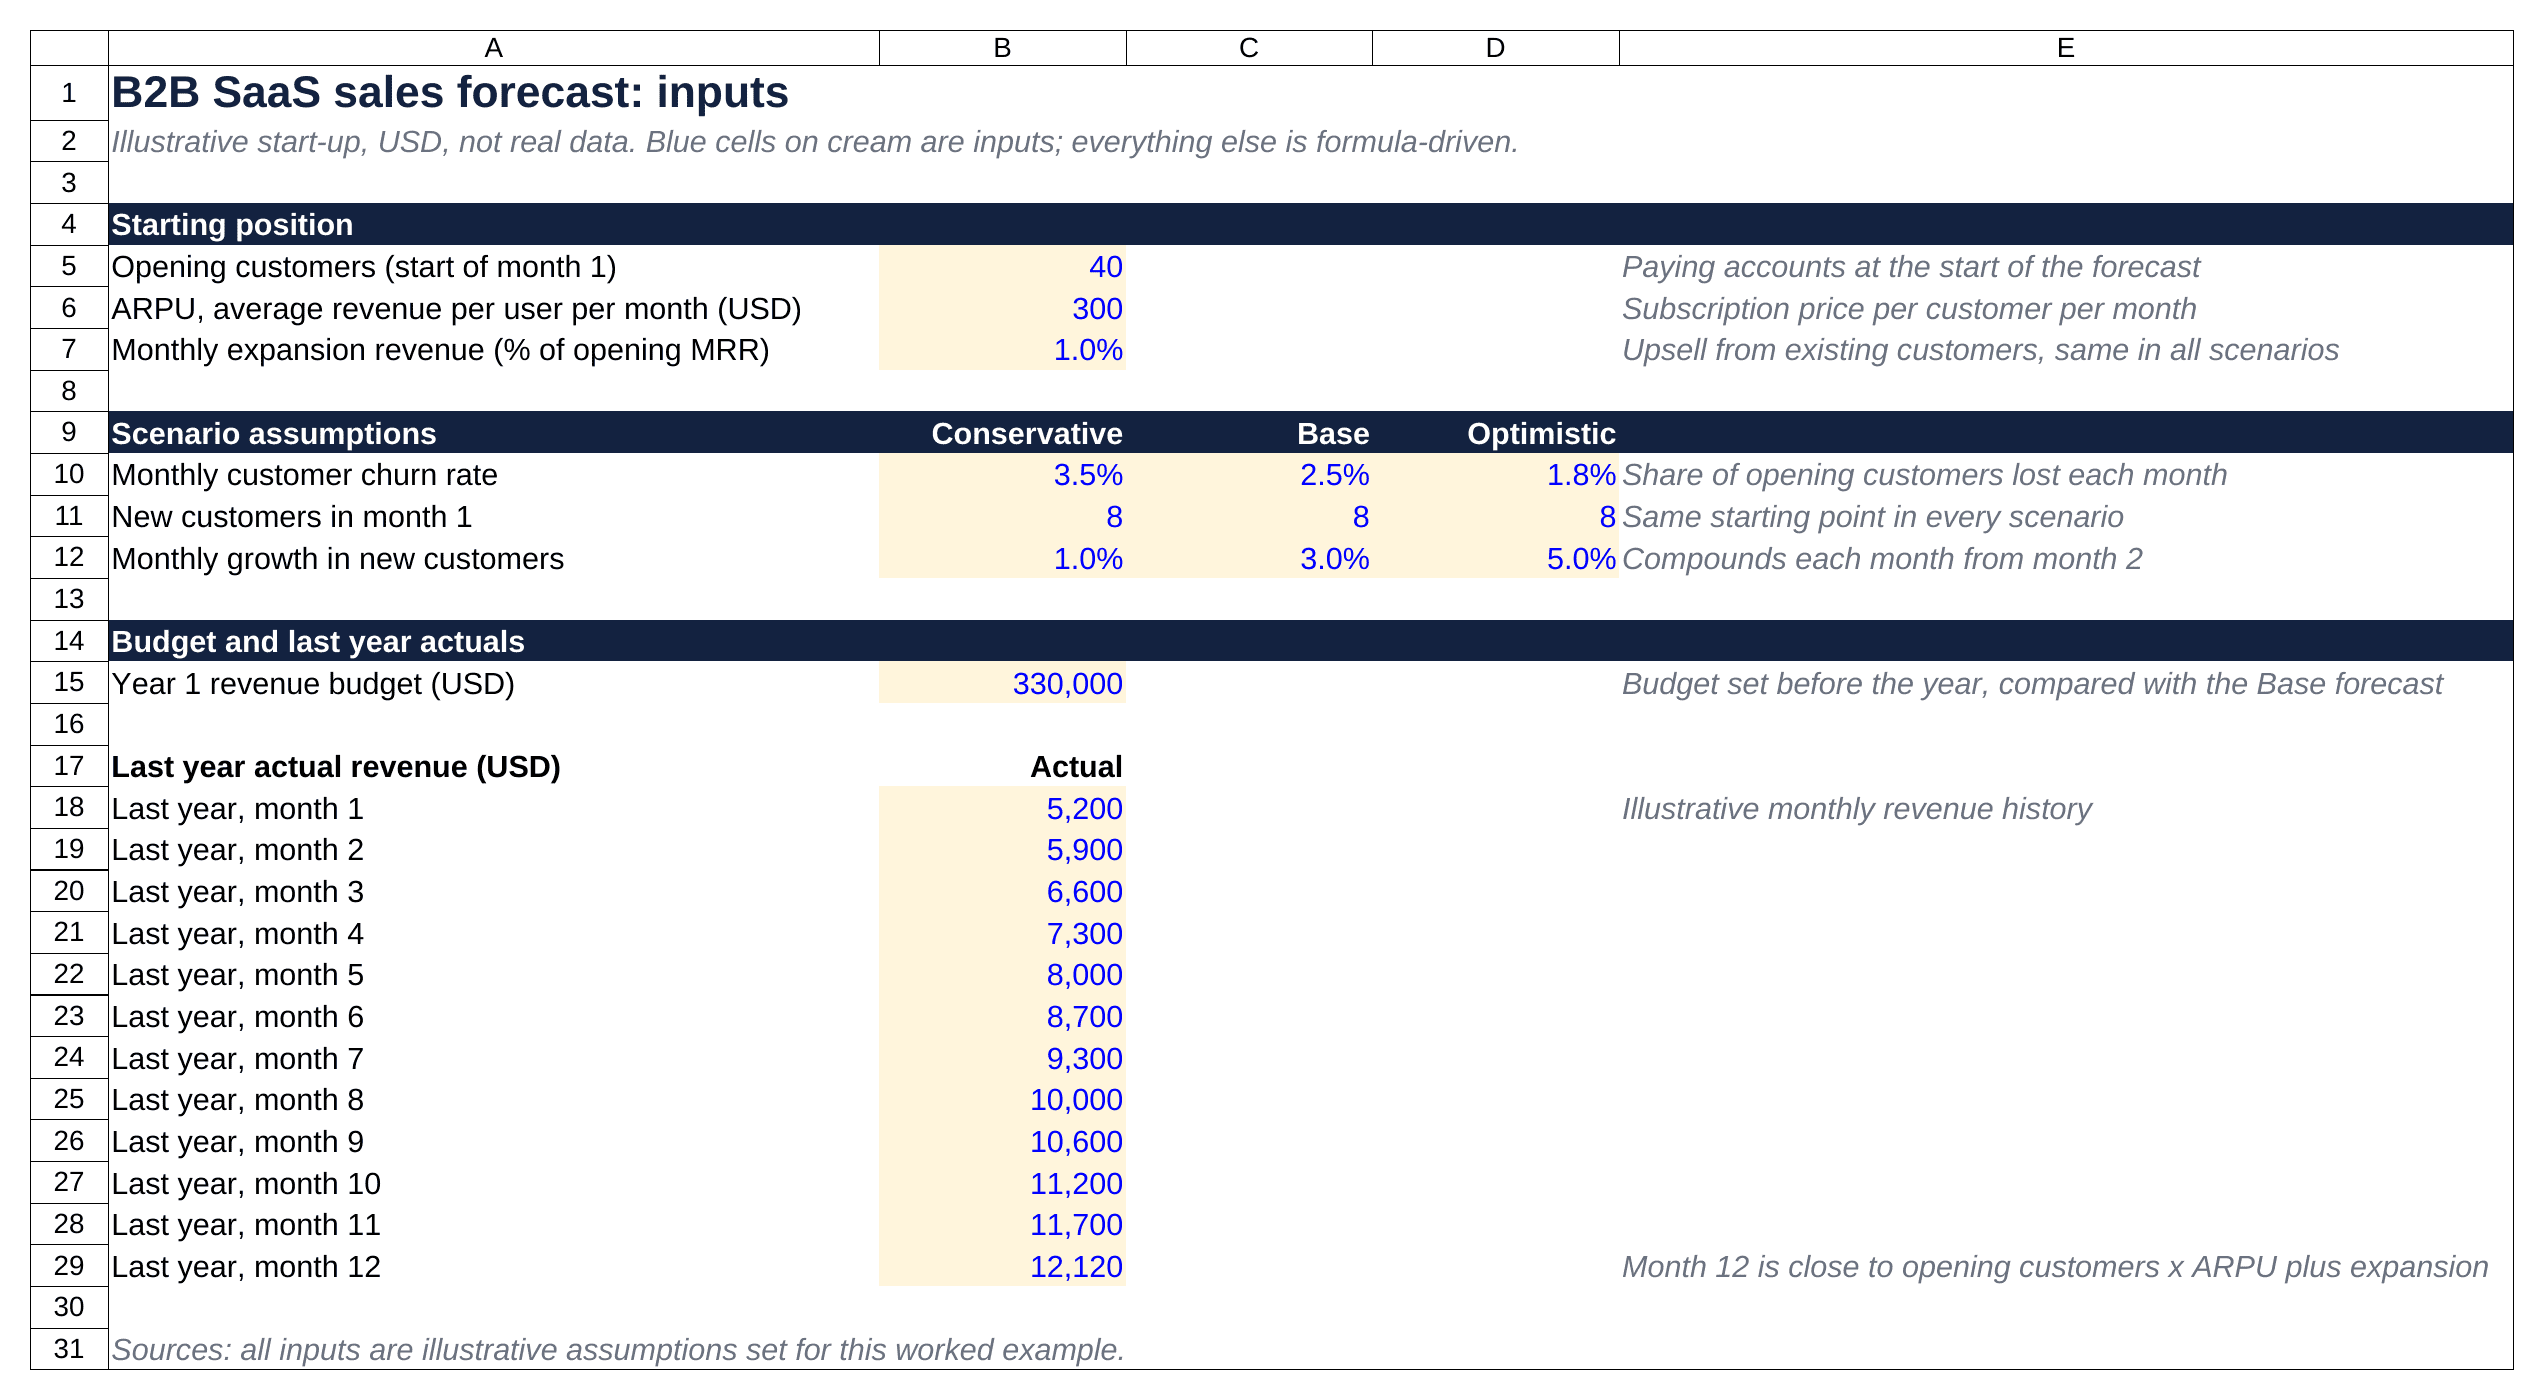
Every assumption sits on one inputs sheet, and each blue cell can be changed. Source: eFinancialModels Analysis.
Worked example: customers roll forward month by month
Each month follows one rule: opening customers plus new customers minus churned customers equals closing customers. In month 1, churned customers are 40 × 2.5% = 1, so closing customers are 40 + 8 − 1 = 47. MRR is 47 × USD 300 = USD 14,100. Expansion is 1.0% of opening MRR of USD 12,000 (40 × USD 300), which is USD 120, so month 1 revenue is USD 14,100 + USD 120 = USD 14,220.
Customers are expected values, so the model carries fractions rather than whole accounts, and the workbook’s base case ends month 24 with MRR of USD 71,473 (cell C6 on the results sheet).
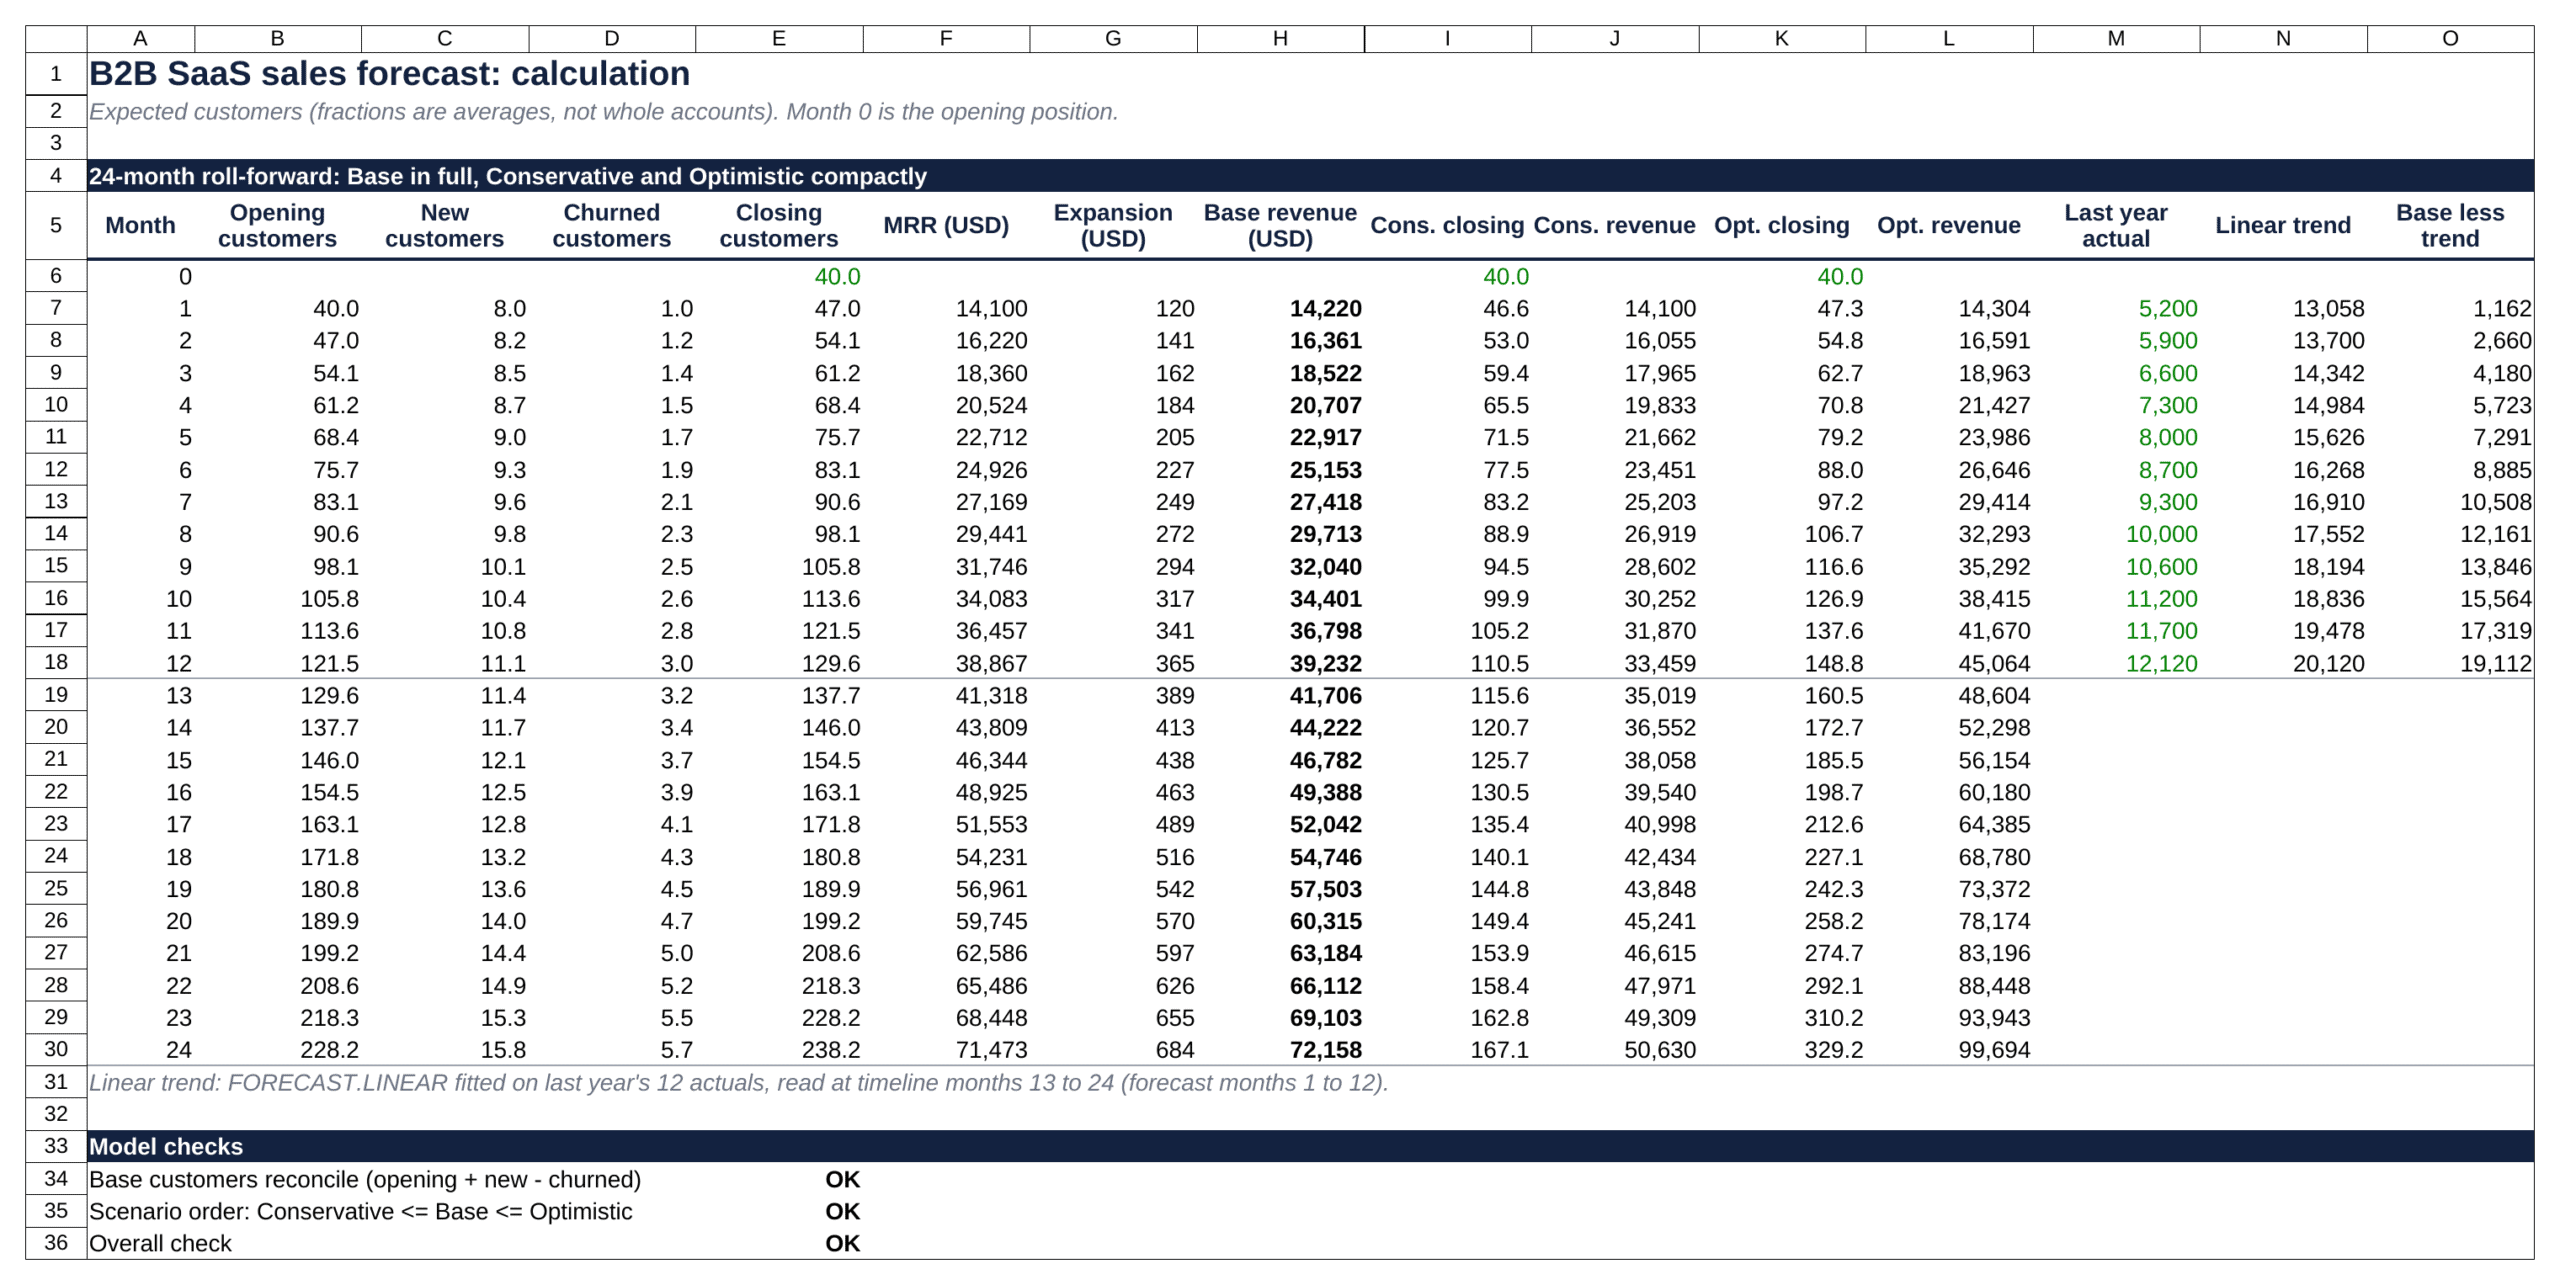
The calculation sheet rolls customers forward for 24 months and checks the base case against a straight line. Source: eFinancialModels Analysis.
A straight line fitted to the 12 actuals on the inputs sheet projects USD 199,072 for the forecast year, while the base case shows USD 317,482, a gap of USD 118,410. The trend line cannot see new-customer growth that compounds at 3.0% a month, so the gap marks the assumption that needs evidence, such as pipeline or lead volume.
Worked example: three scenarios and a variance against budget
Year 1 base revenue is USD 317,482 against the USD 330,000 budget, USD 12,518 (3.79%) below budget. Only the base case is compared with budget, as the central view. Year 2 base revenue is USD 677,262, which is 113.3% above year 1, and the 24-month base total is USD 994,744.
The conservative case books USD 805,586 of revenue over 24 months with month 24 MRR of USD 50,142. The optimistic case books USD 1,211,292 with USD 98,764. Because the scenarios change only churn and new-customer growth, the spread shows how much these two drivers move revenue.
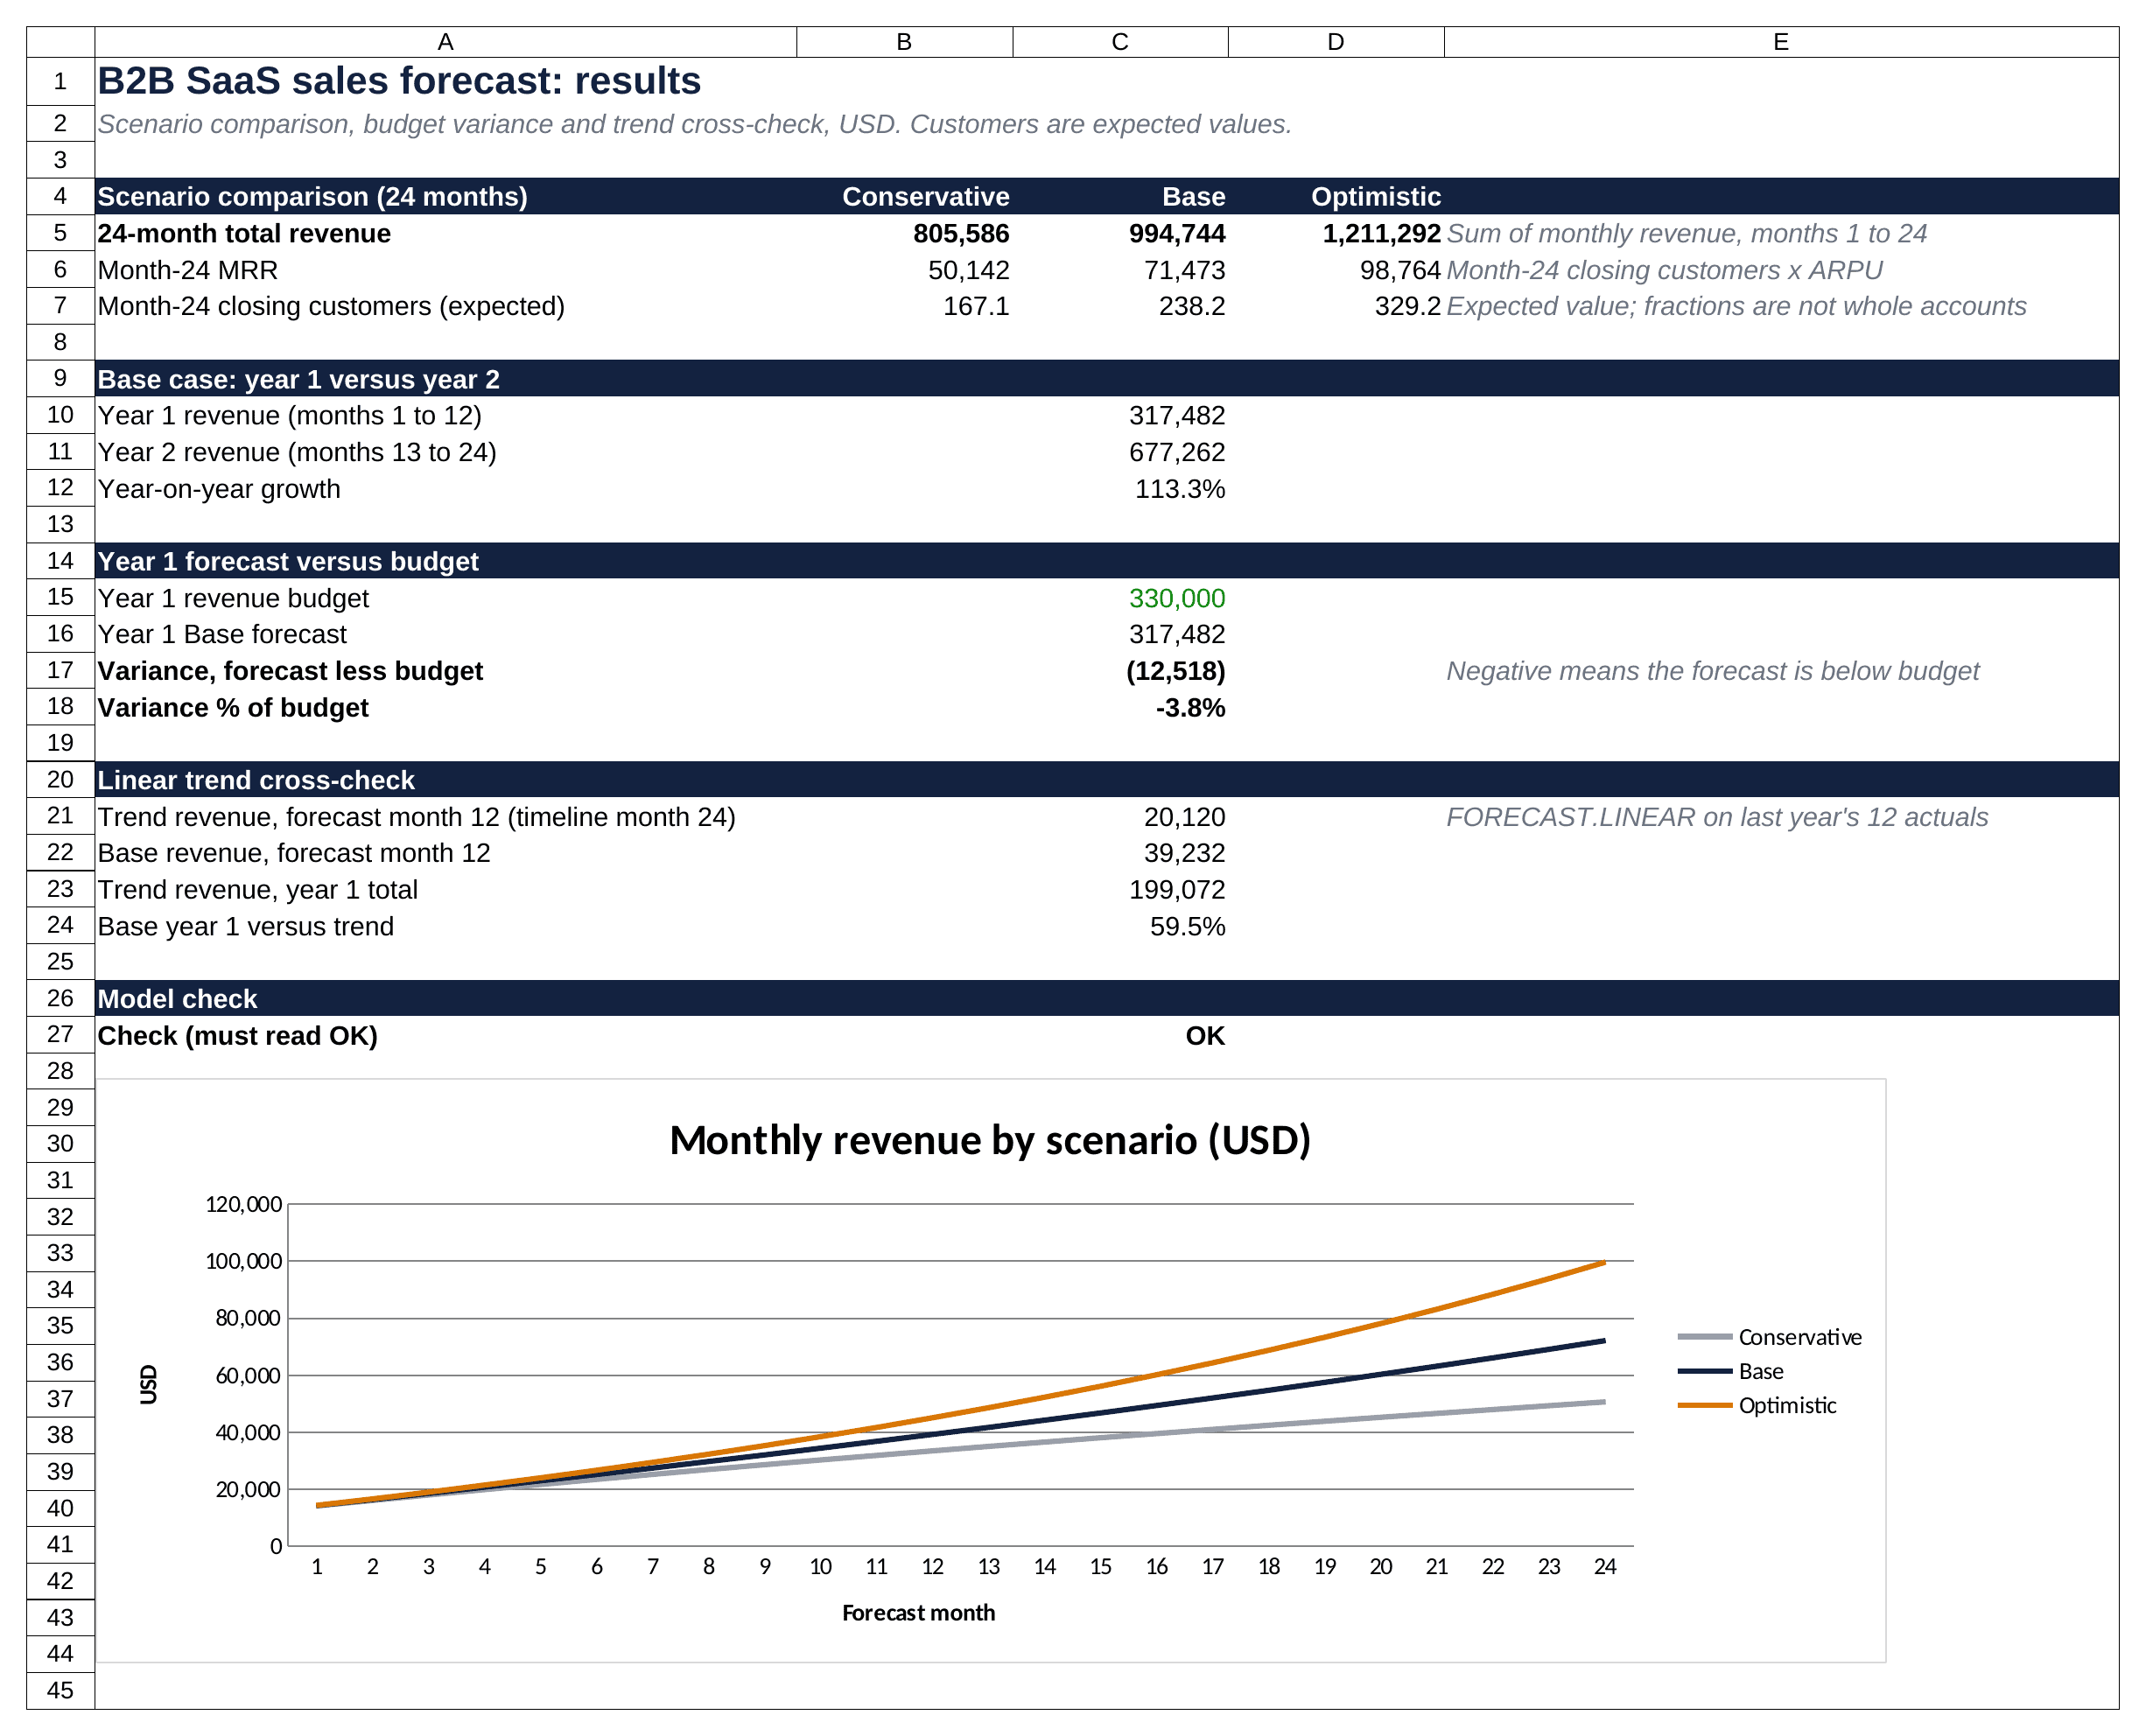
The results sheet compares scenarios, budget variance and the model check cell, which reads OK. Source: eFinancialModels Analysis.
Turn the forecast into a budget, then link it to cash flow and profit
A budget turns the forecast into commitments in four steps. First, set the revenue target from the base case, or from the conservative case when cash is tight. Second, list costs and separate fixed costs from variable costs, which rise with sales, such as payment fees. Third, set spending limits that keep the plan cash positive in the conservative case. Fourth, compare actuals with the budget monthly.
The example workbook stops at revenue, so costs, collection timing and profit need their own sheets. A three-statement model connects them: revenue less cost of goods sold, the direct cost of delivering the product, gives gross profit, and invoice and payment timing converts revenue into cash. The eFinancialModels library also includes a collection of three-statement model templates. Two pitfalls recur: treating booked revenue as cash received, and holding variable costs flat as sales grow.
Five mistakes derail a sales forecast
- Relying on history alone, without checking market conditions that have changed.
- Ignoring seasonality and other repeating patterns.
- Leaving the forecast unchanged after actual results arrive.
- Adding variables that no one can measure or defend.
- Building a forecast that no hiring, spending or pricing decision depends on.
Frequently Asked Questions
How often should a sales forecast be updated?
Update the forecast every month, right after the books close, by replacing the oldest forecast month with the actual result and adding a new month at the far end so the horizon stays at 24 months. Review the assumptions themselves each quarter, because churn or conversion rates drift slowly. A large unexpected event, such as losing a major client, justifies an immediate revision.
What is the difference between a sales forecast and a sales goal?
A sales goal is a target the team commits to chase, often set above what is likely so that it motivates effort. A forecast is the most probable outcome given current evidence, and it should not be inflated to match the goal. When goal and forecast are identical, the plan has hidden its risk, and nobody can tell which assumption carries the target.
How much historical data is needed for accurate forecasting?
Twelve months is the practical minimum for a straight-line trend, because with fewer points one unusual month tilts the slope. Seasonal indices need at least two full yearly cycles, so 24 months, to separate a genuine pattern from a one-off spike. When history is shorter, a founder can still forecast from bottom-up drivers and use the few existing months only as a check on price and conversion.
What if the business has no sales history?
Start from drivers that can be observed before the first sale: price tests, pilot customers, a list of qualified leads, conversion rates from comparable companies and the capacity of the sales team. Multiply these through to customers and revenue, then label every input as an assumption. Replace each assumption with a measured value as actuals arrive, and keep the conservative and optimistic cases far apart while evidence is thin.
How are new product launches handled in a forecast?
Give a launch its own revenue line with a separate ramp. Model the launch date, early adopter volume, pricing and the share of sales that replaces existing products, then add the line to the base forecast. Keep it out of the trend calculation until several months of actual sales exist, because a launch spike would distort the slope and the seasonal indices of the established products.
Conclusion
A usable sales forecast comes down to clean history, one or two methods that fit the business, explicit drivers, three scenarios and a monthly comparison with the budget. Founders who want the forecast linked to a balance sheet and cash flow statement can start from the eFinancialModels Free Three Statement Financial Model, a free three statement template. The figures are illustrative, and other revenue models need different drivers.