
0 ITEMS

Self Storage Financial Model Excel – 5-Year Forecast, Occupancy, Cash Flow, Break-Even & Investor Deck
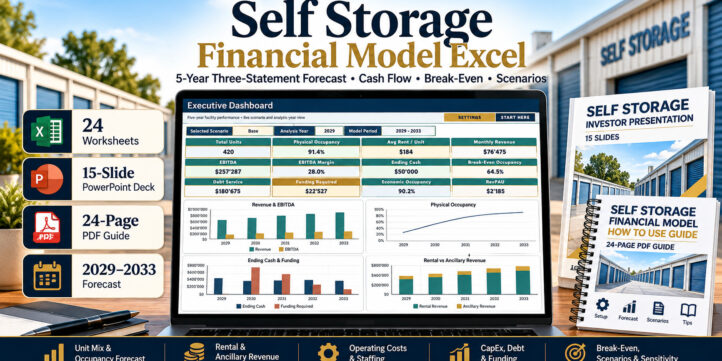
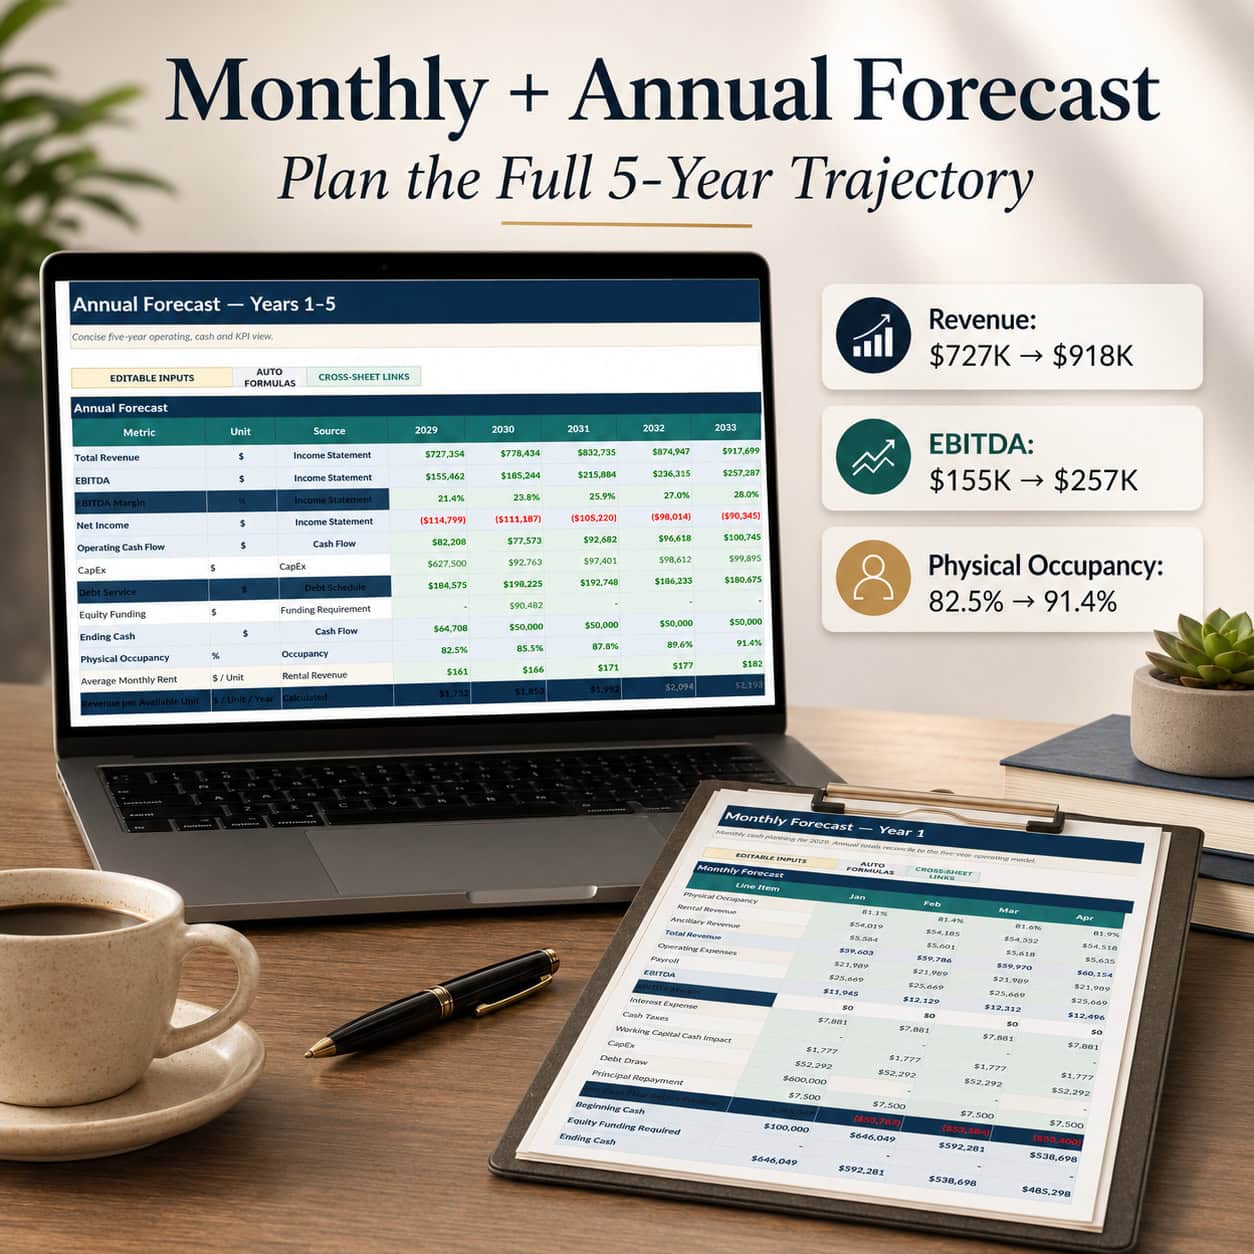
Professional 5-year Self Storage Facility Financial Model for operators, investors, developers, buyers and consultants. The 24-worksheet Excel workbook integrates unit mix, physical and economic occupancy, rental rates, ancillary revenue, operating expenses, staffing, capital expenditure, depreciation, debt financing and funding requirements into a connected Income Statement, Balance Sheet and Cash Flow forecast. Includes a first-year monthly forecast, five-year annual projections, Executive Dashboard with four charts, EBITDA and cash break-even occupancy analysis, Bear/Base/Bull scenarios and Occupancy × Rent sensitivity analysis. The complete package includes a 15-slide editable Investor / Management PowerPoint presentation and a detailed 24-page PDF user guide. Fully editable and macro-free, with illustrative 2029–2033 sample data. Microsoft Excel is the reference environment; Google Sheets import compatibility should be verified after import.
Integrated Self Storage Financial Planning, Occupancy Forecasting and Three-Statement Analysis
Plan and evaluate the financial performance of a self storage facility with this comprehensive five-year financial model developed by SheetworksStudio.
Designed for self storage operators, facility buyers, investors, developers and financial planning consultants, this Excel-based model connects unit availability, occupancy, rental rates, ancillary revenue, operating expenses, capital investment and financing with projected profitability and cash flow.
The workbook provides an integrated planning environment for analyzing facility performance, testing alternative assumptions and preparing management or financing discussions.
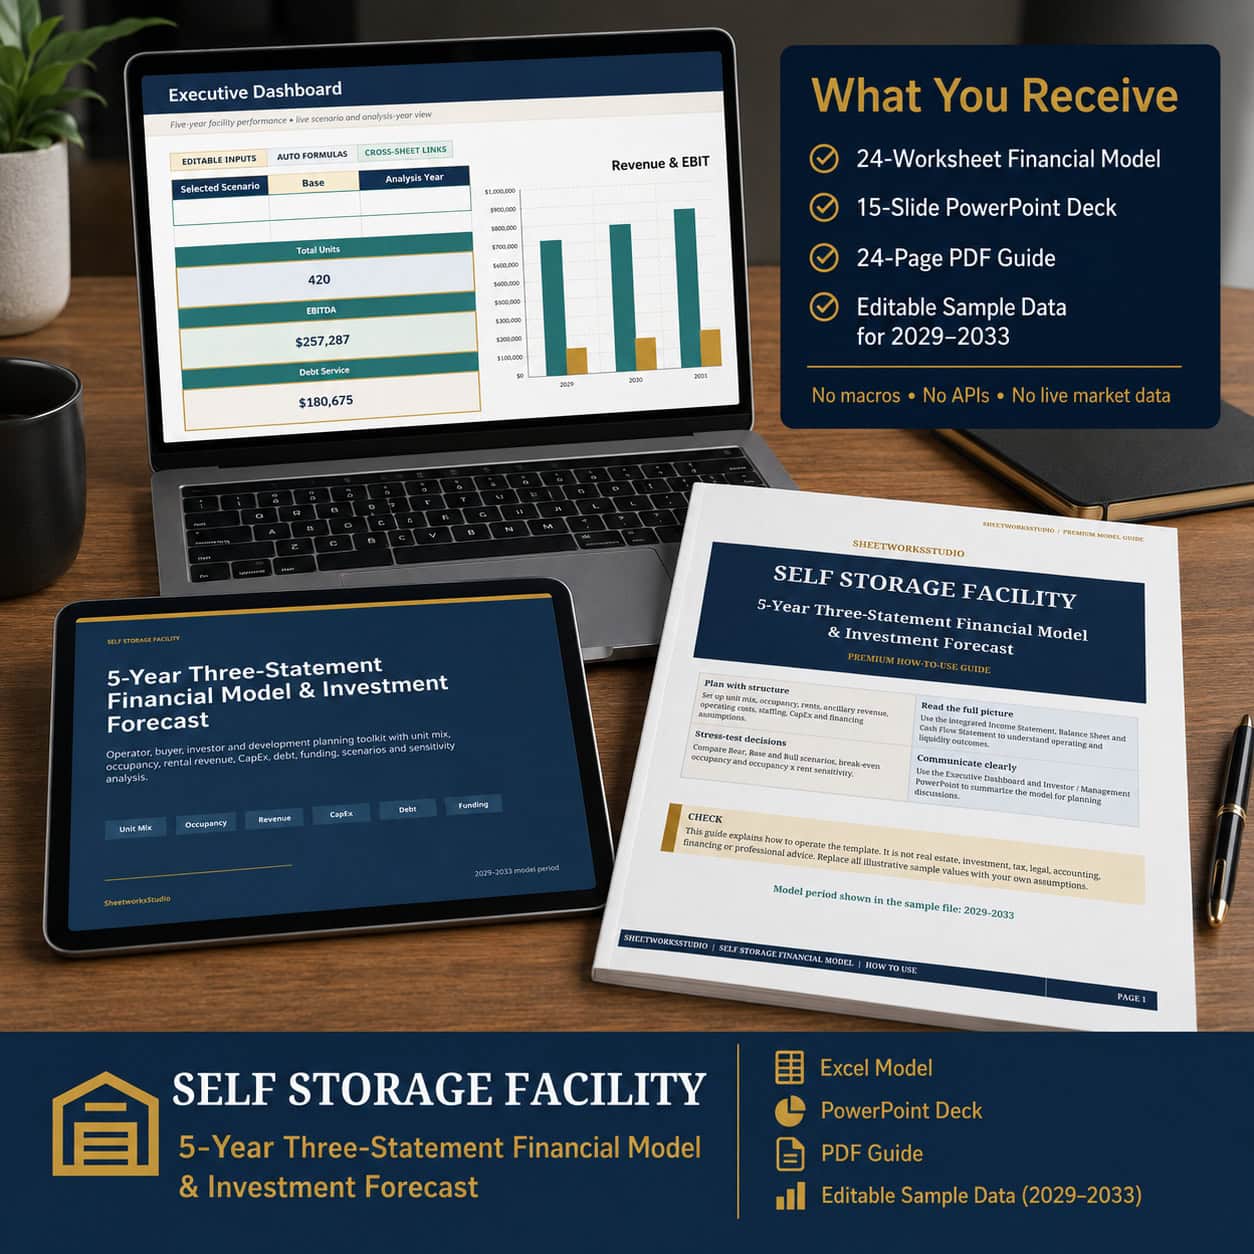
Complete Product Package
24-Worksheet Excel Financial Model
An editable financial planning workbook covering operating assumptions, unit mix, occupancy, revenue, expenses, staffing, capital expenditure, debt, financial statements and decision-support analysis.
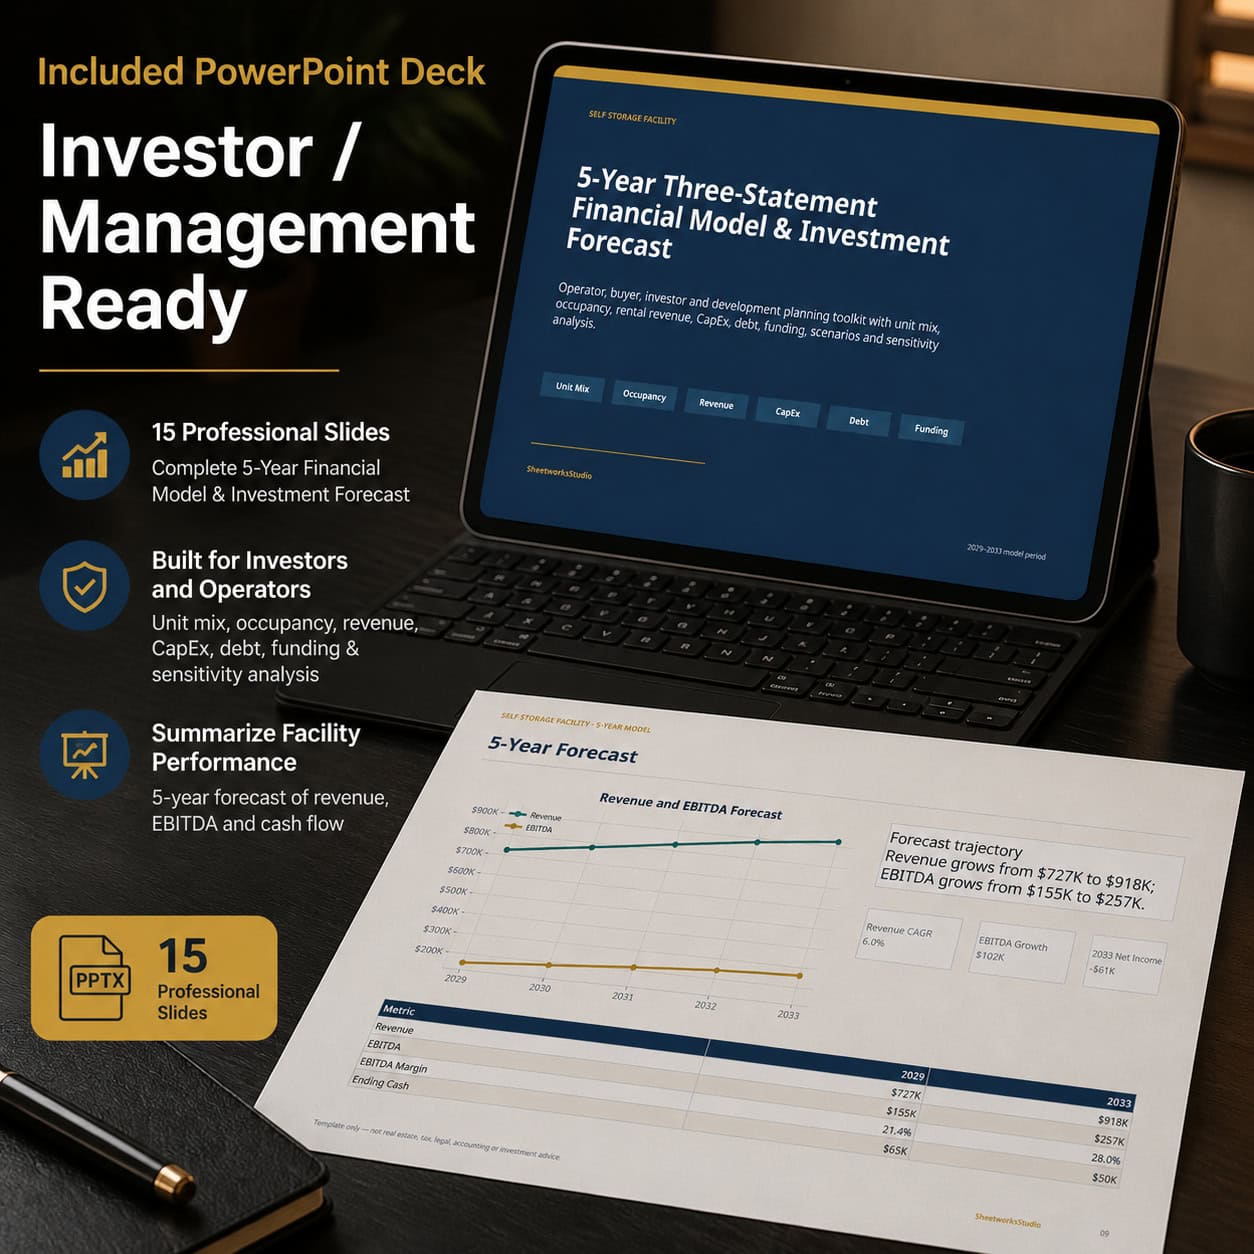
15-Slide Investor / Management PowerPoint
An editable presentation for communicating operating assumptions, projected performance and financial planning results.
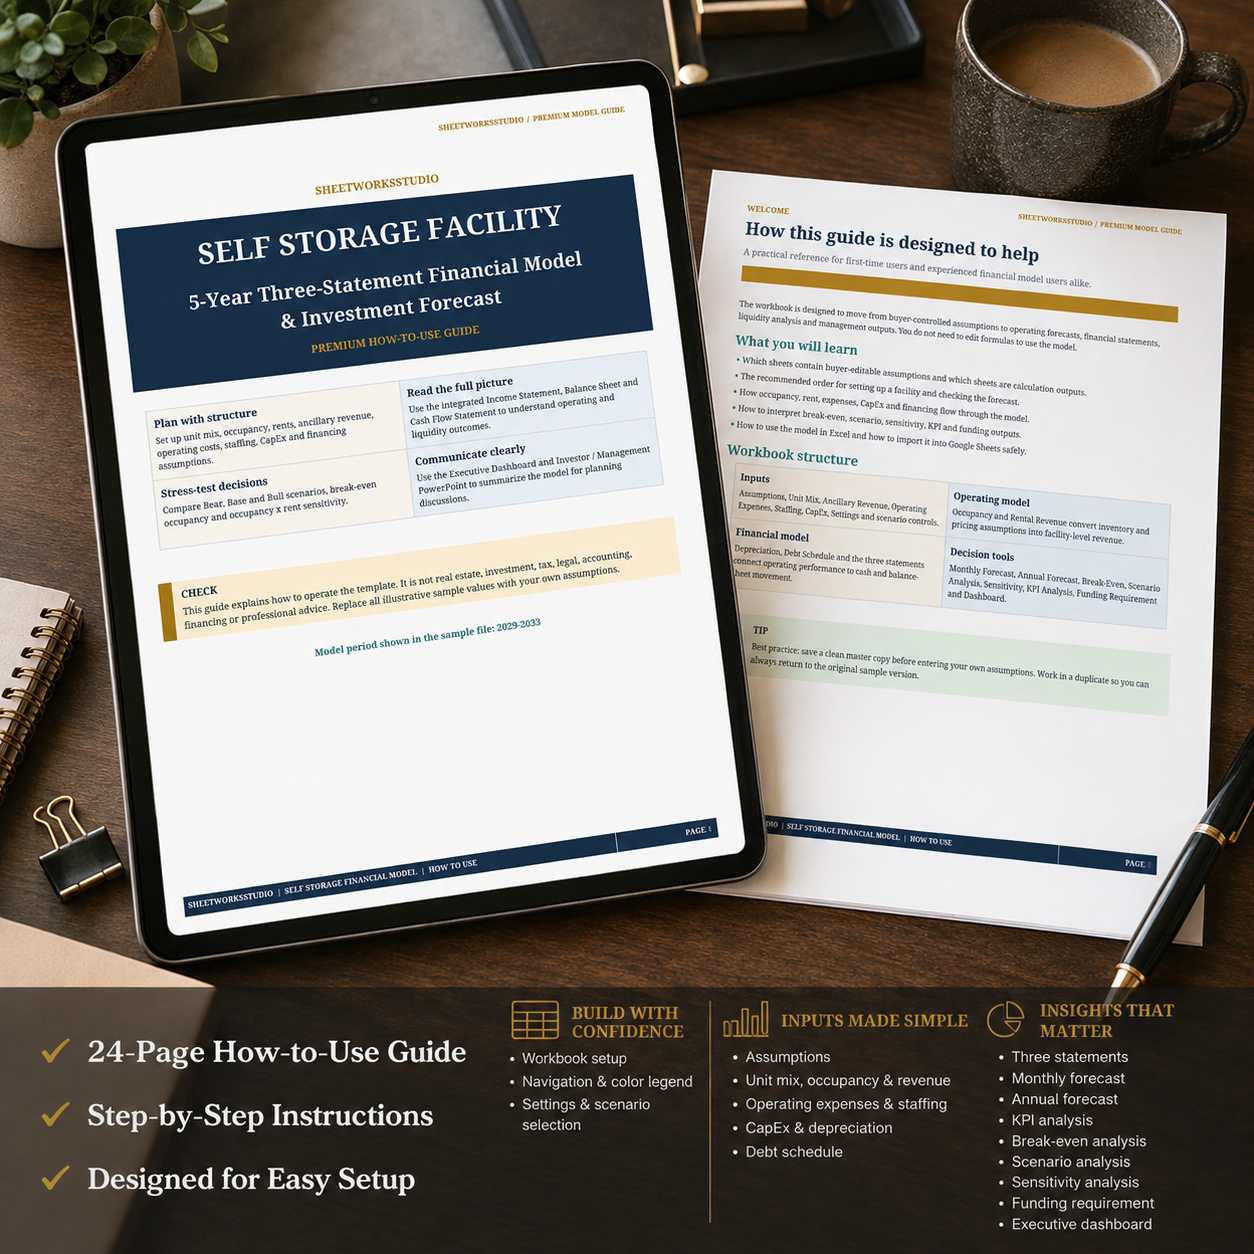
24-Page How-to-Use PDF Guide
Structured instructions covering model setup, inputs, calculations, financial statements, dashboard interpretation, scenarios and funding requirements.
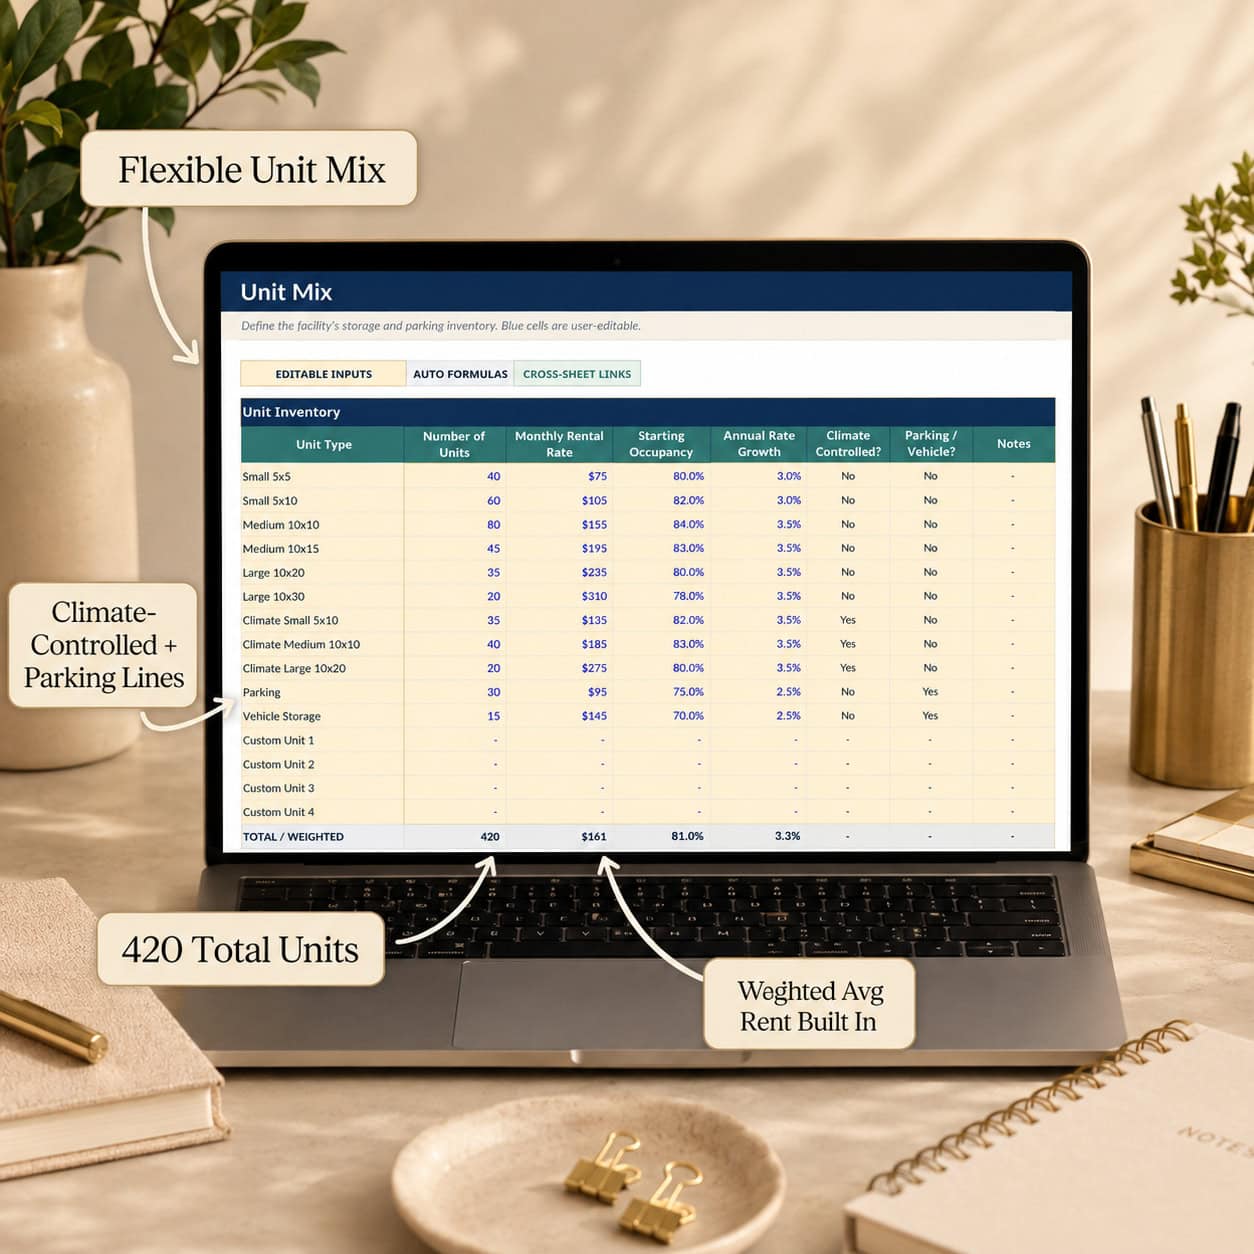
Unit Mix and Facility Capacity
Plan multiple self storage unit categories, including:
- Small, Medium and Large Storage Units
- Climate-Controlled Units
- Parking and Vehicle Storage
- Optional Additional Unit Categories
The unit mix provides a foundation for calculating available storage capacity and rental revenue potential.
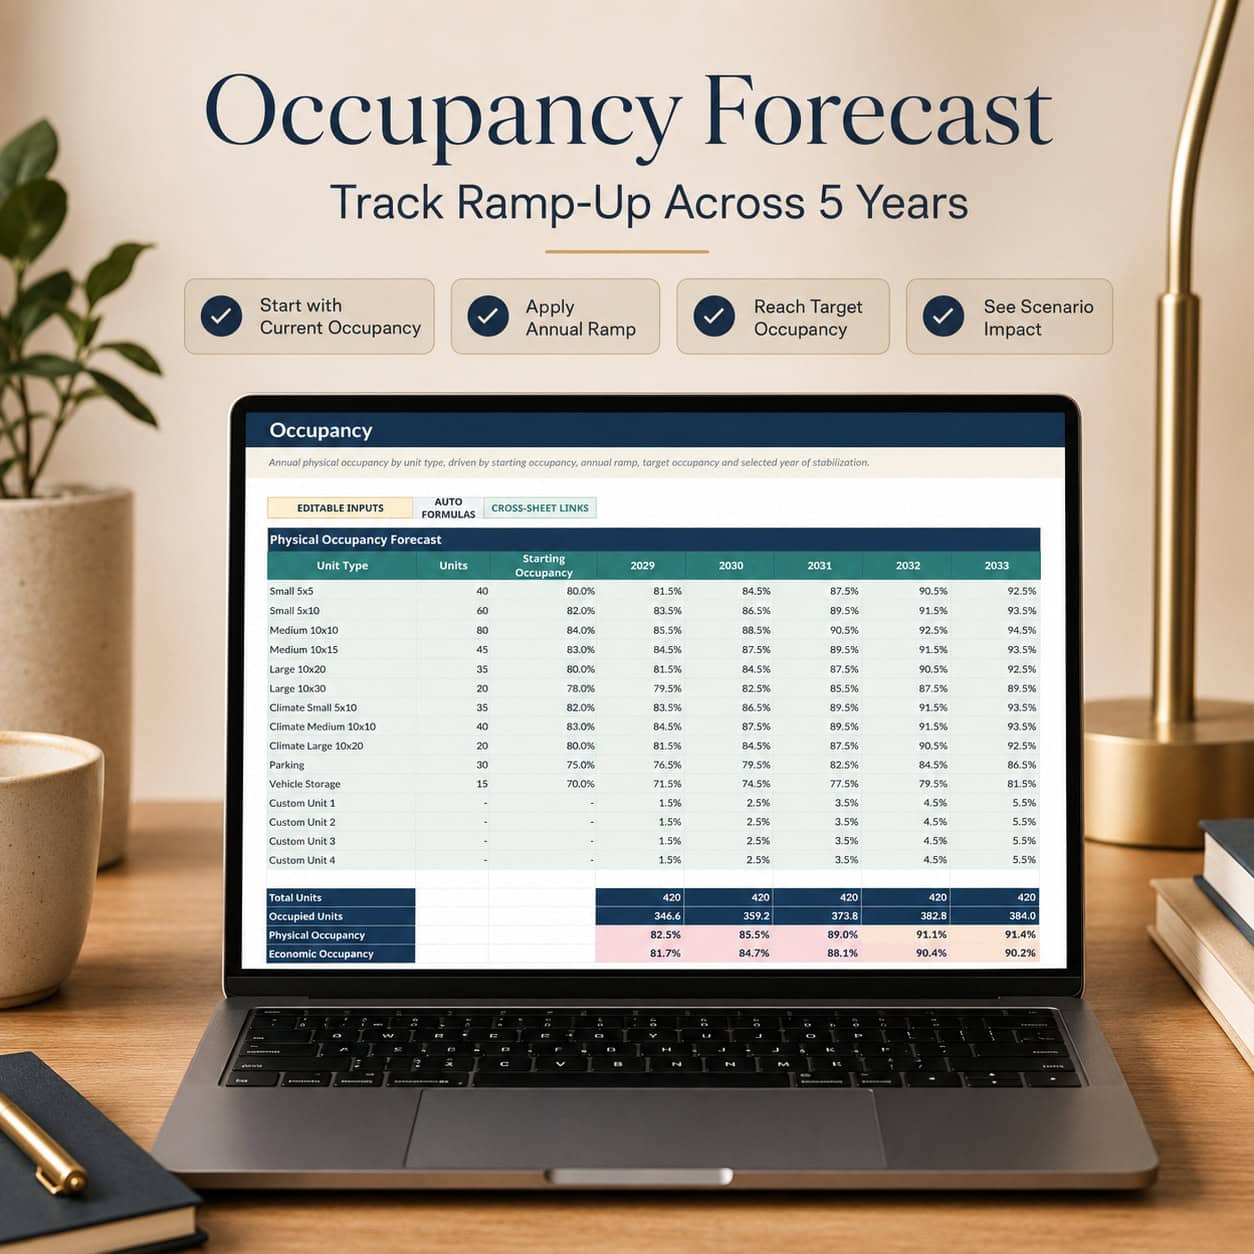
Physical and Economic Occupancy
Model starting occupancy, target occupancy and occupancy development throughout the forecast.
Physical occupancy and economic occupancy help users evaluate facility utilization and the relationship between occupied units, rental rates and realized revenue.
Rental and Ancillary Revenue
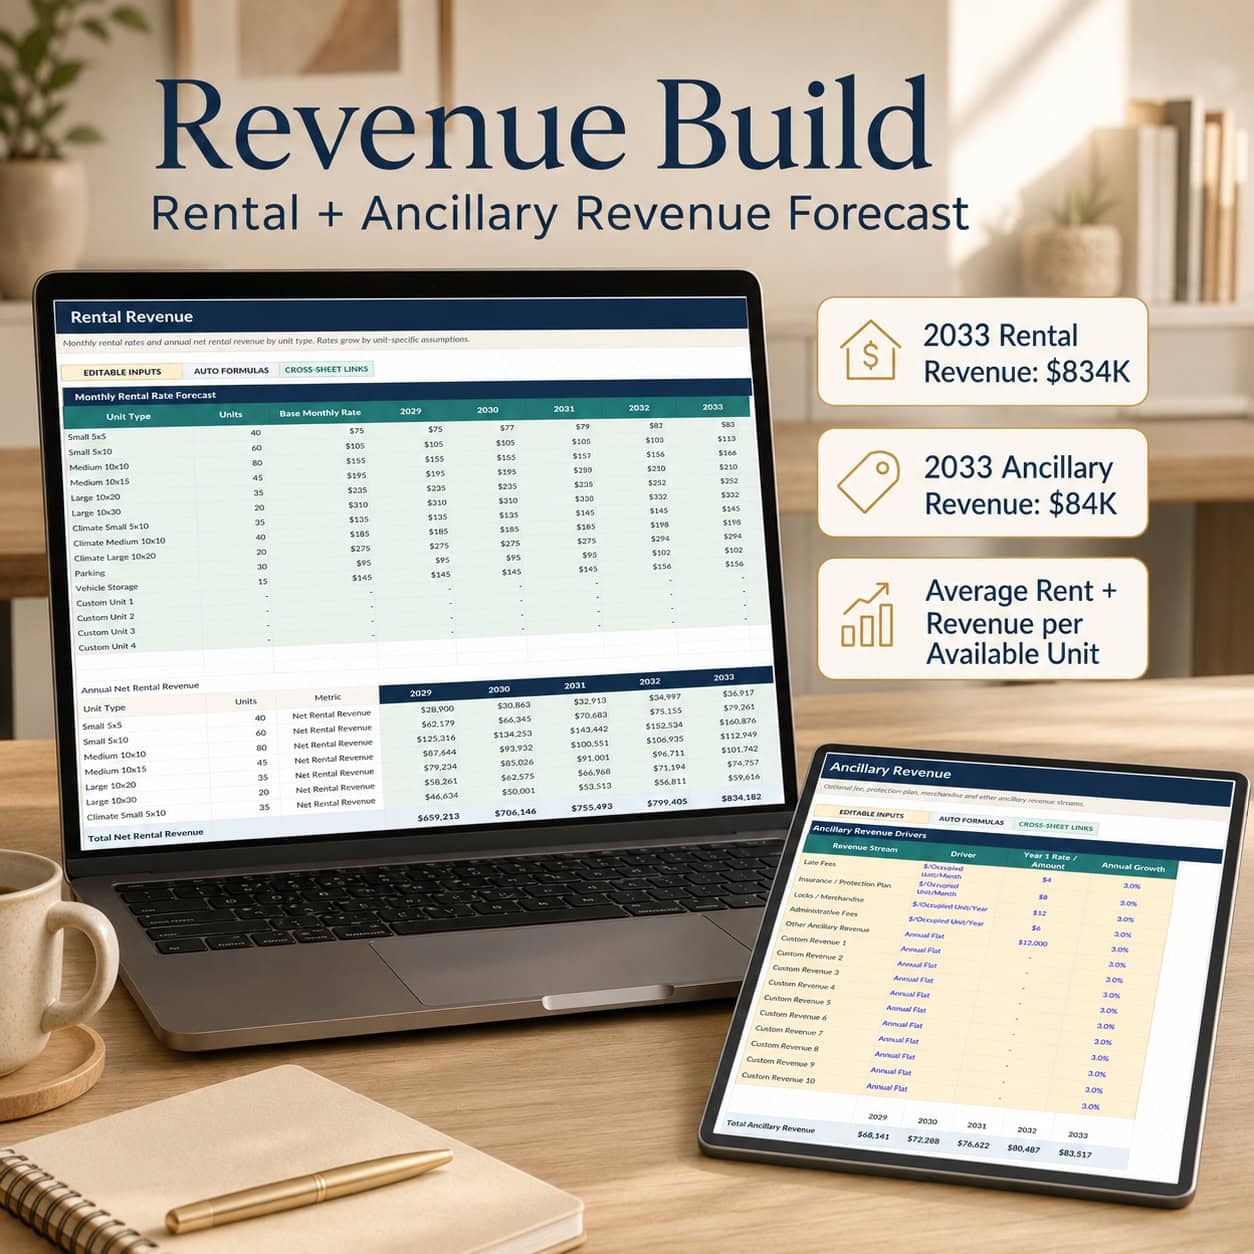
Forecast rental income based on unit mix, occupancy and average rental assumptions.
Additional revenue streams can include late fees, protection plans, locks, merchandise and other ancillary services.
This structure supports analysis of total revenue and revenue per available unit.
Operating Expenses and Staffing
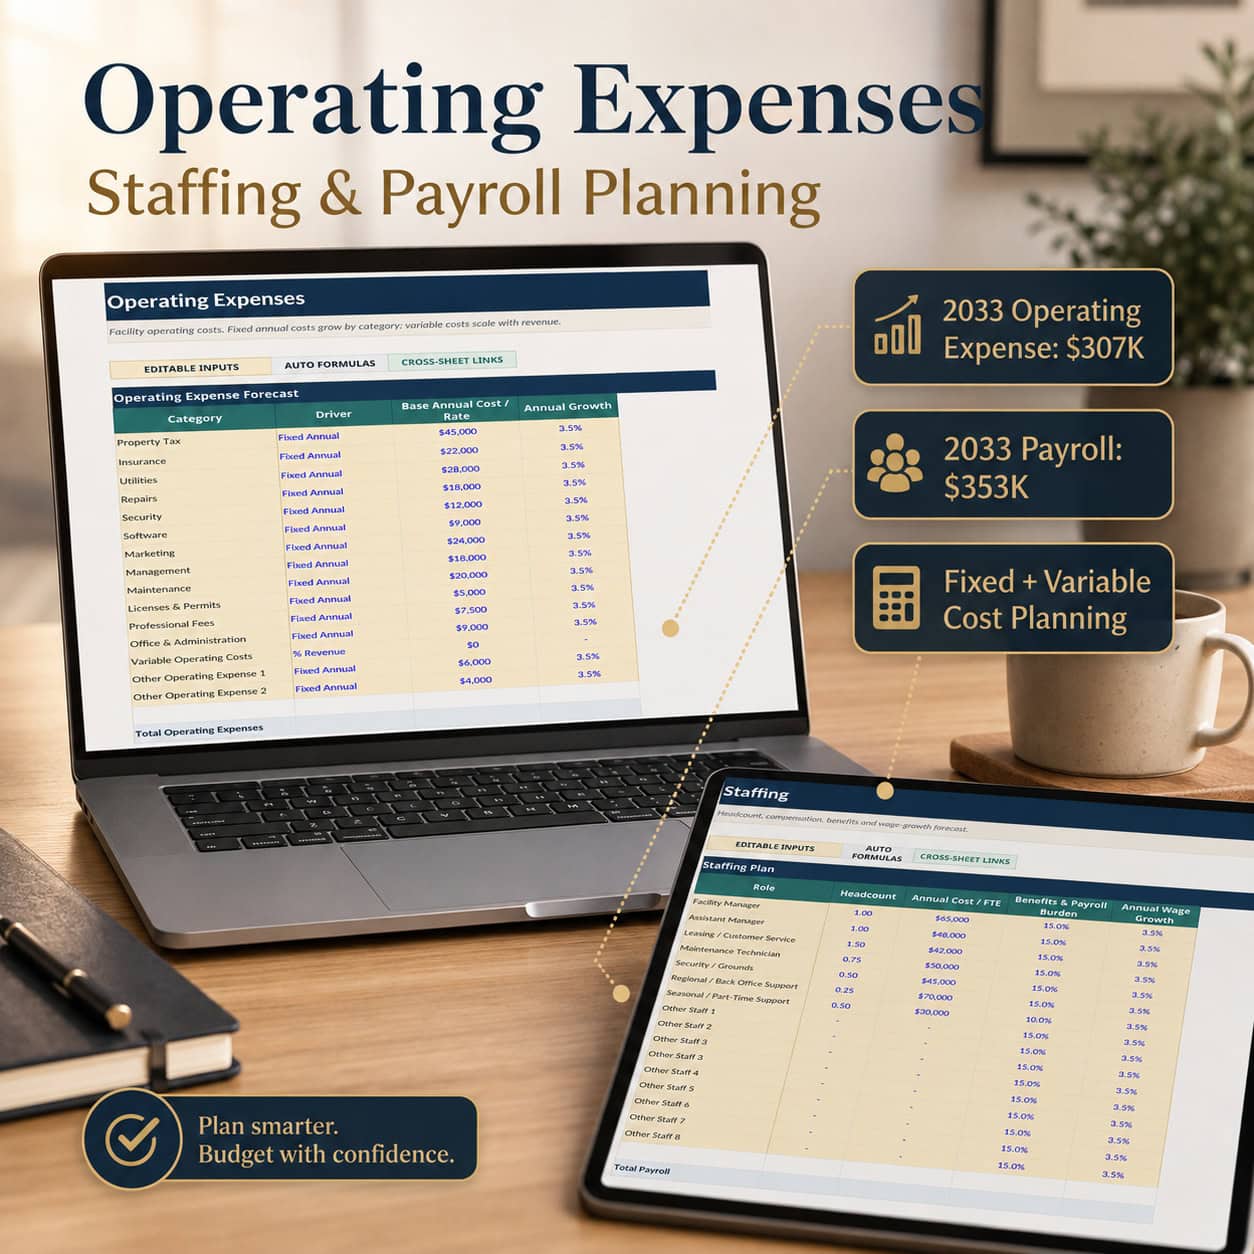
Develop forecasts for major facility expenses, including property taxes, insurance, utilities, repairs, security, software, marketing, management, payroll and maintenance.
Users can adapt the operating cost assumptions to their facility’s location, operating model and staffing requirements.
Capital Expenditure and Depreciation
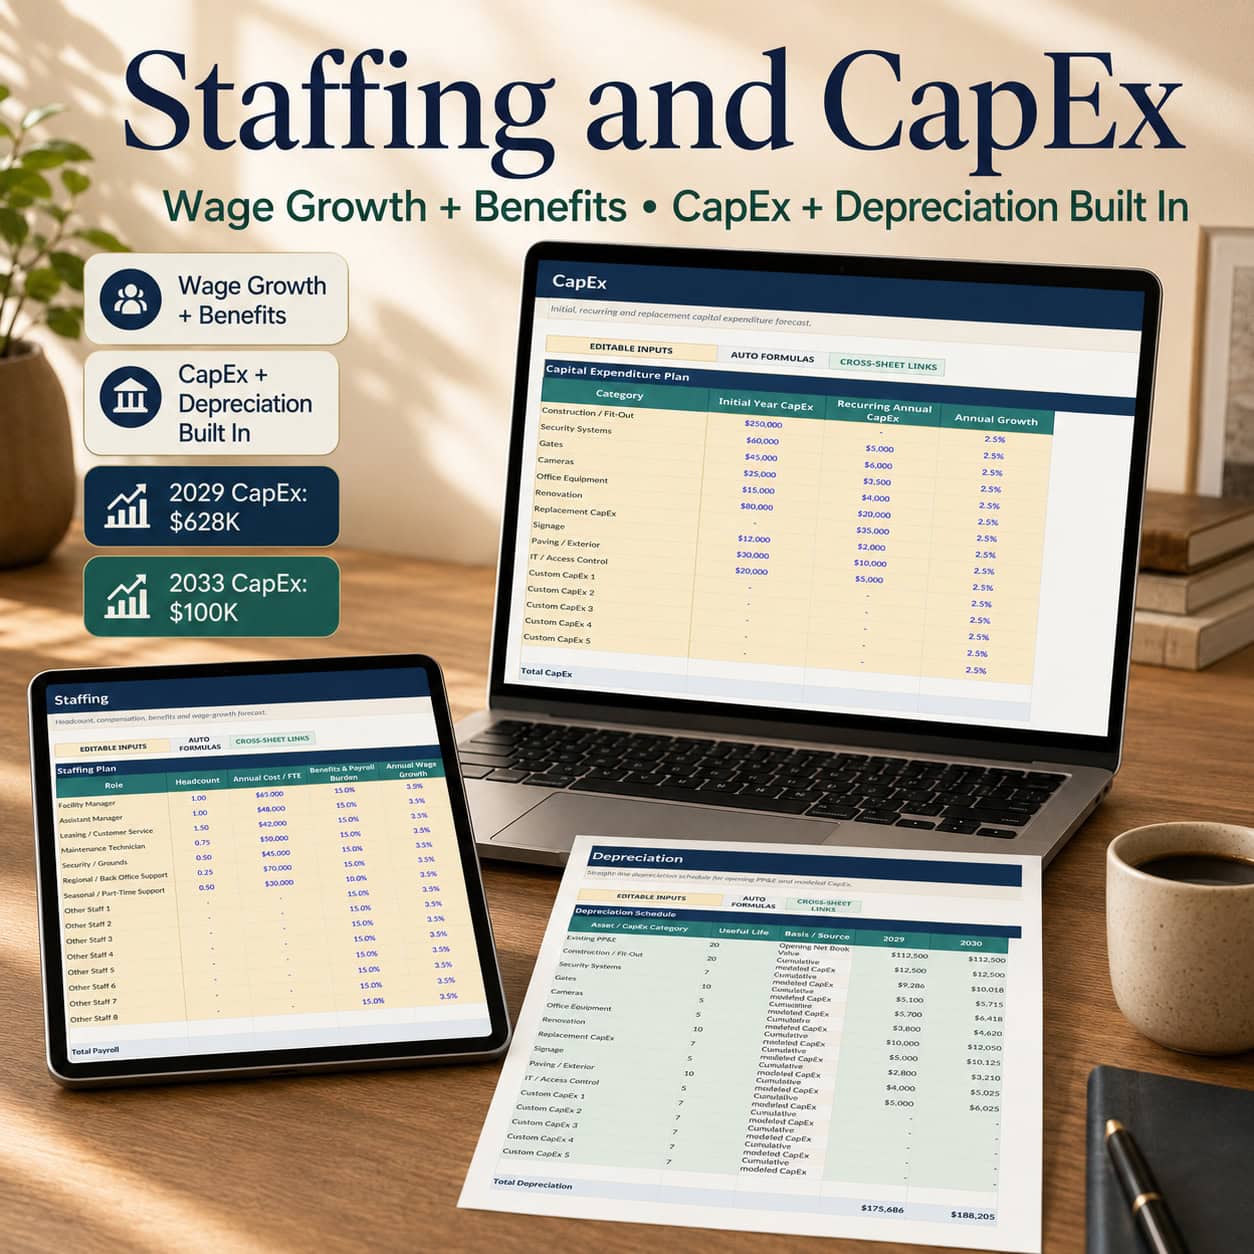
Plan construction and fit-out costs, security systems, access gates, cameras, renovations, equipment and replacement capital expenditure.
Dedicated depreciation schedules support integration with the financial statements.
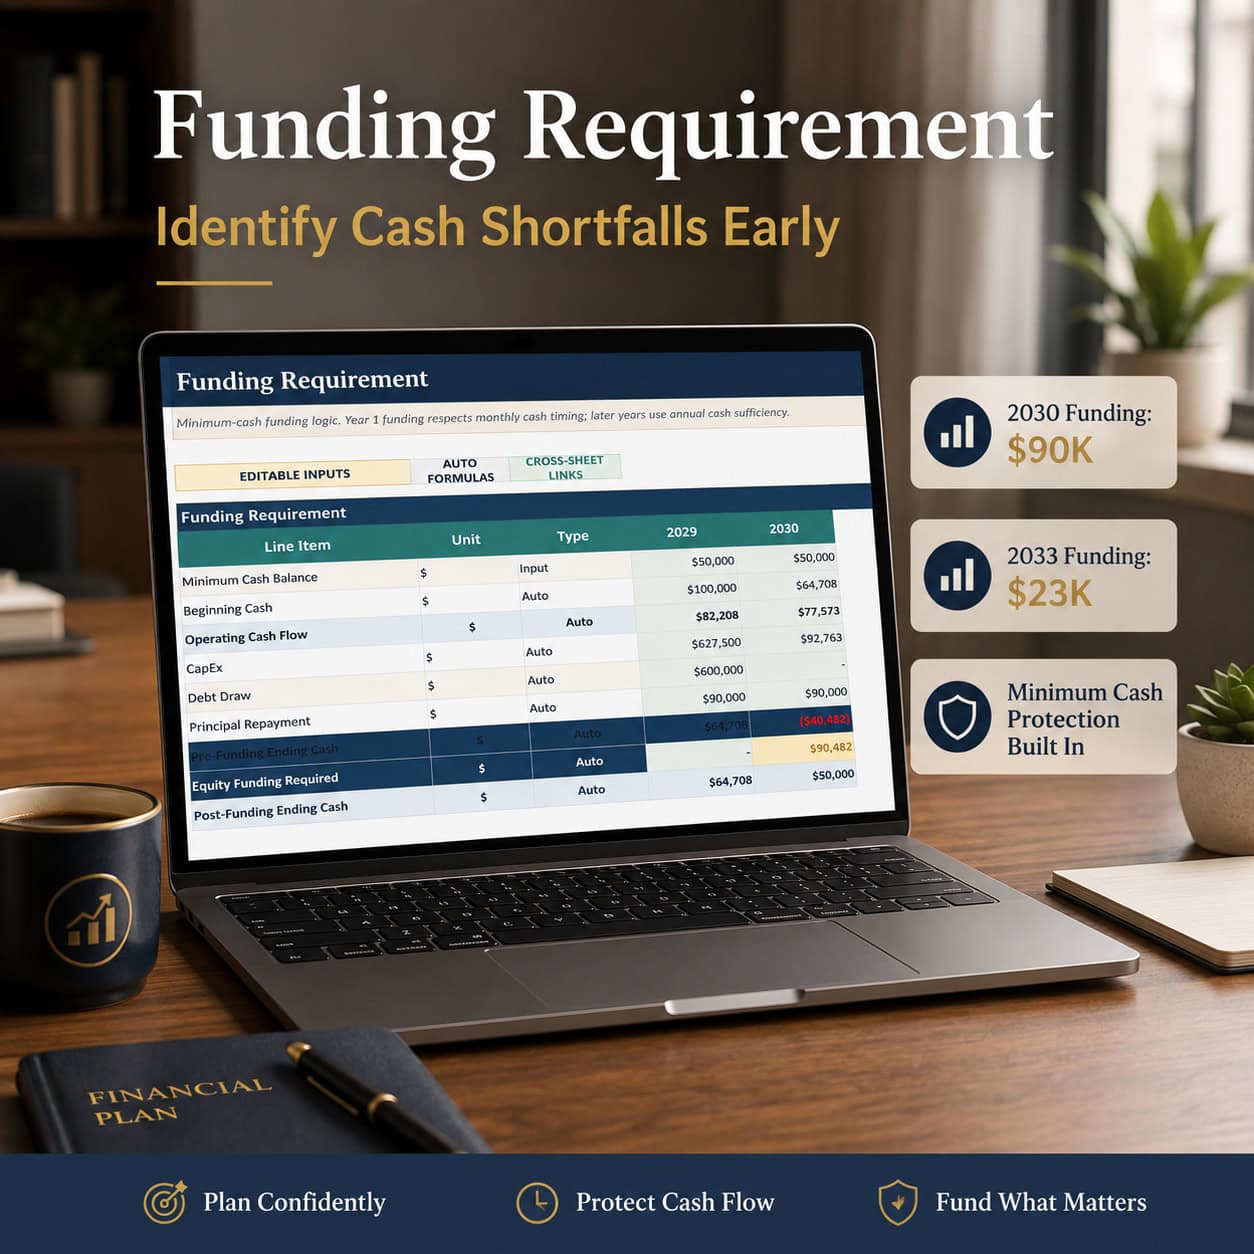
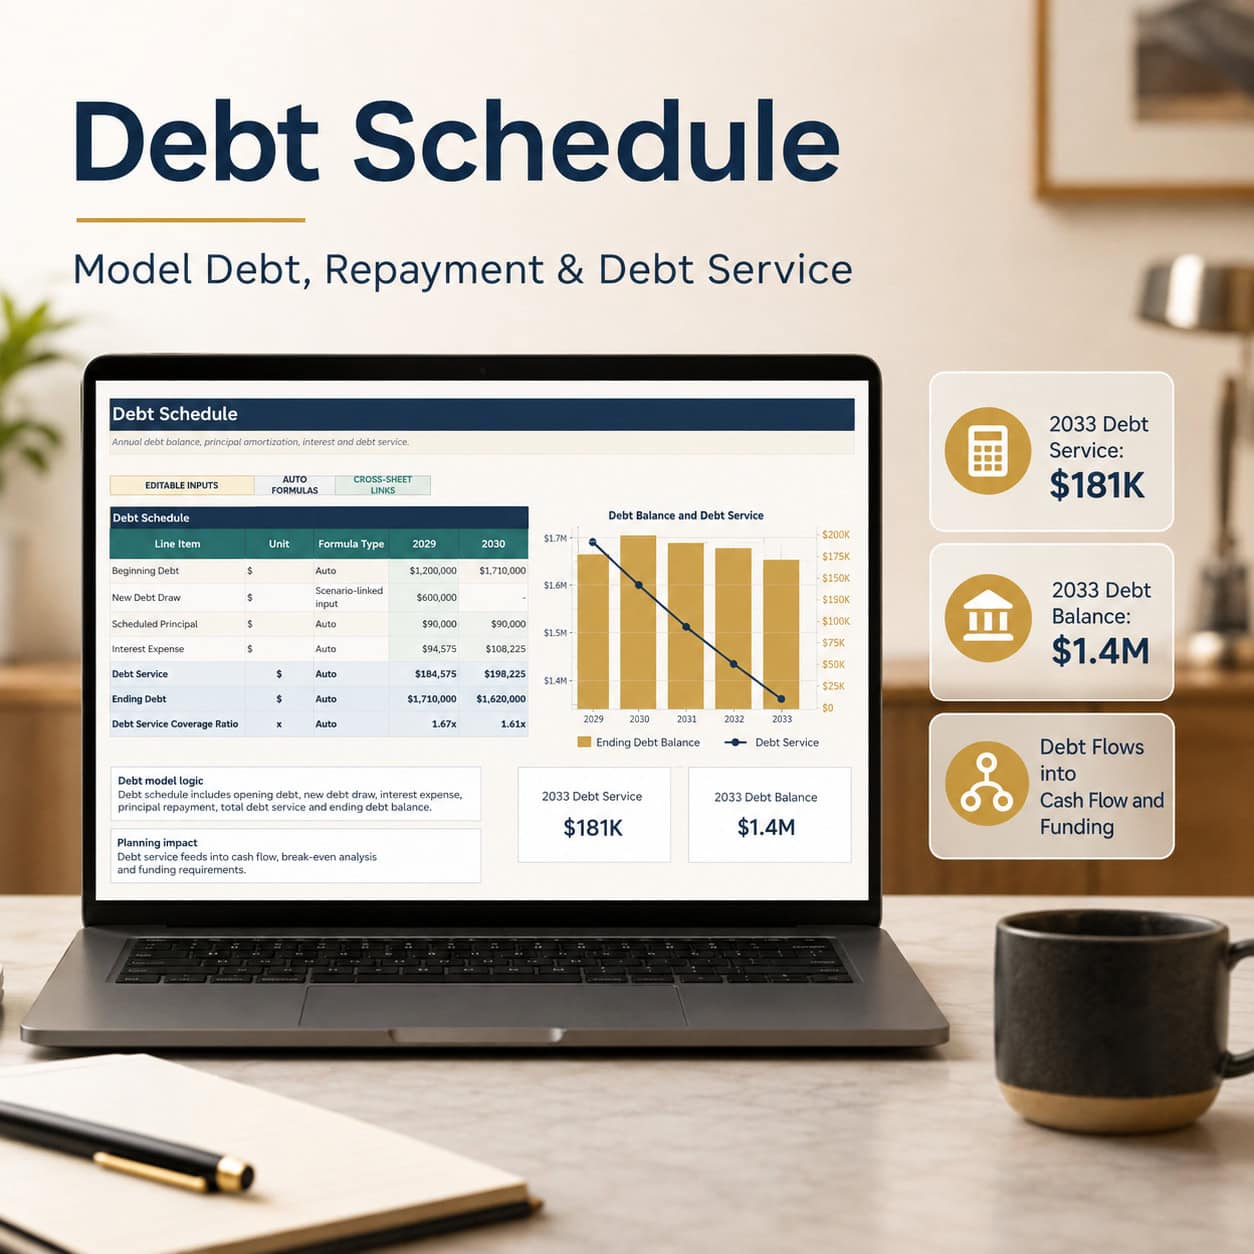
Debt Financing and Funding
Forecast debt draws, interest, principal repayments and debt service.
The model also supports analysis of projected cash balances and additional funding requirements.
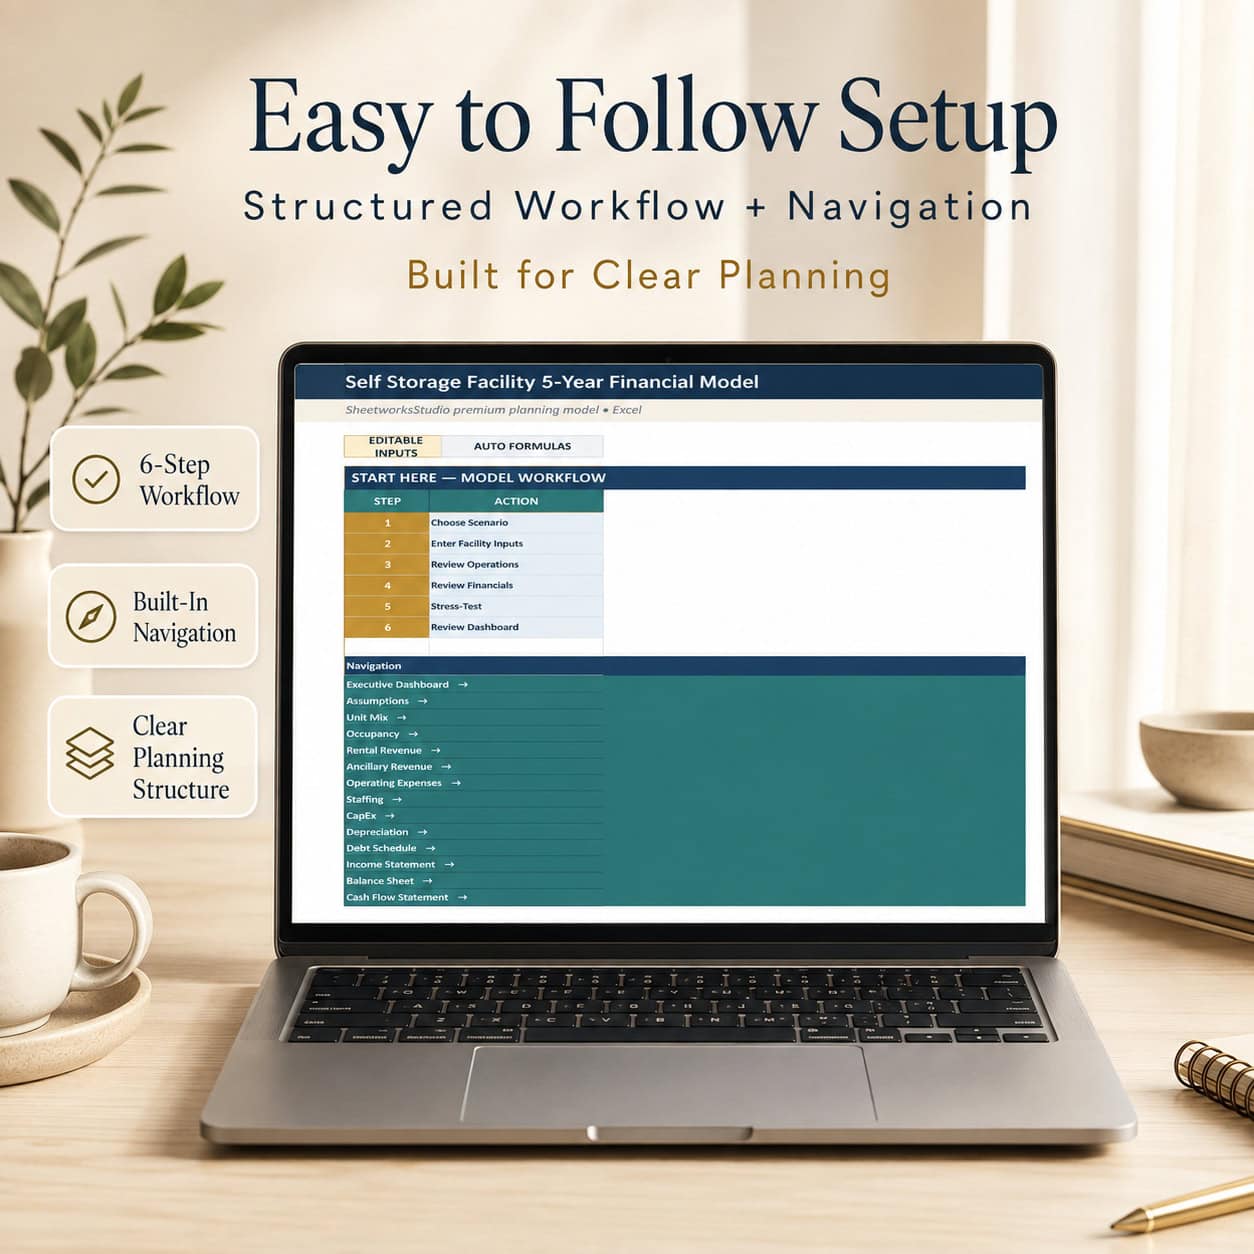
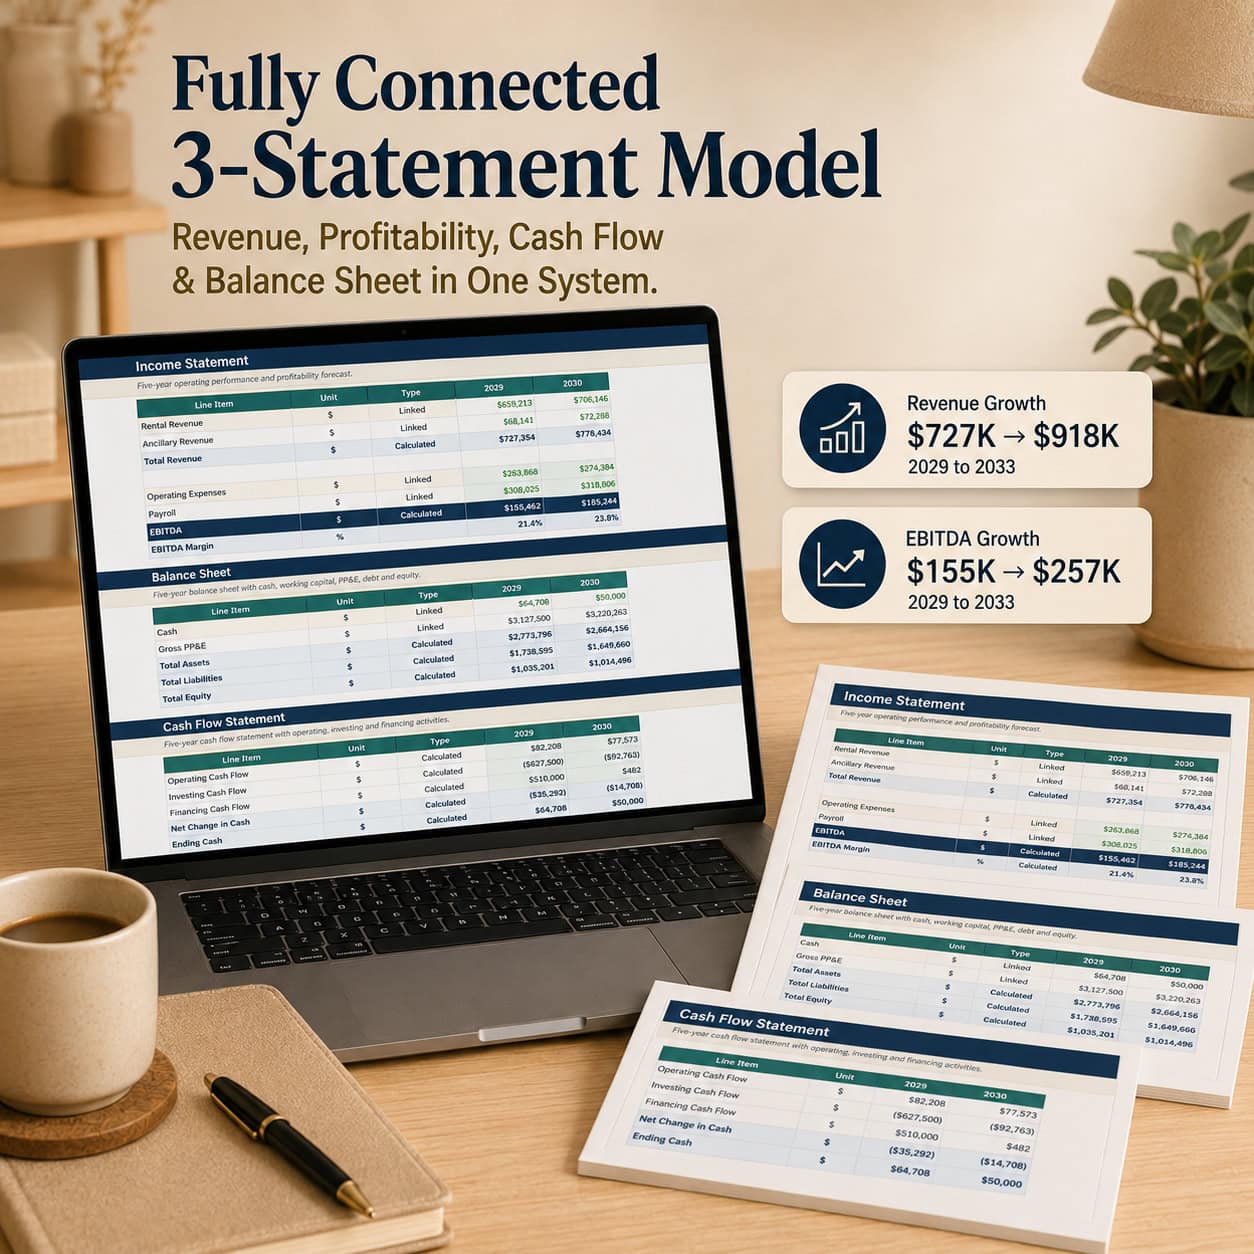
Integrated Three-Statement Financial Model
The workbook connects:
Income Statement: Revenue, operating costs and profitability.
Balance Sheet: Assets, liabilities and equity.
Cash Flow Statement: Operating, investing and financing cash movements.
A detailed first-year monthly forecast complements the annual projections for the five-year planning period.
Executive Dashboard and KPIs
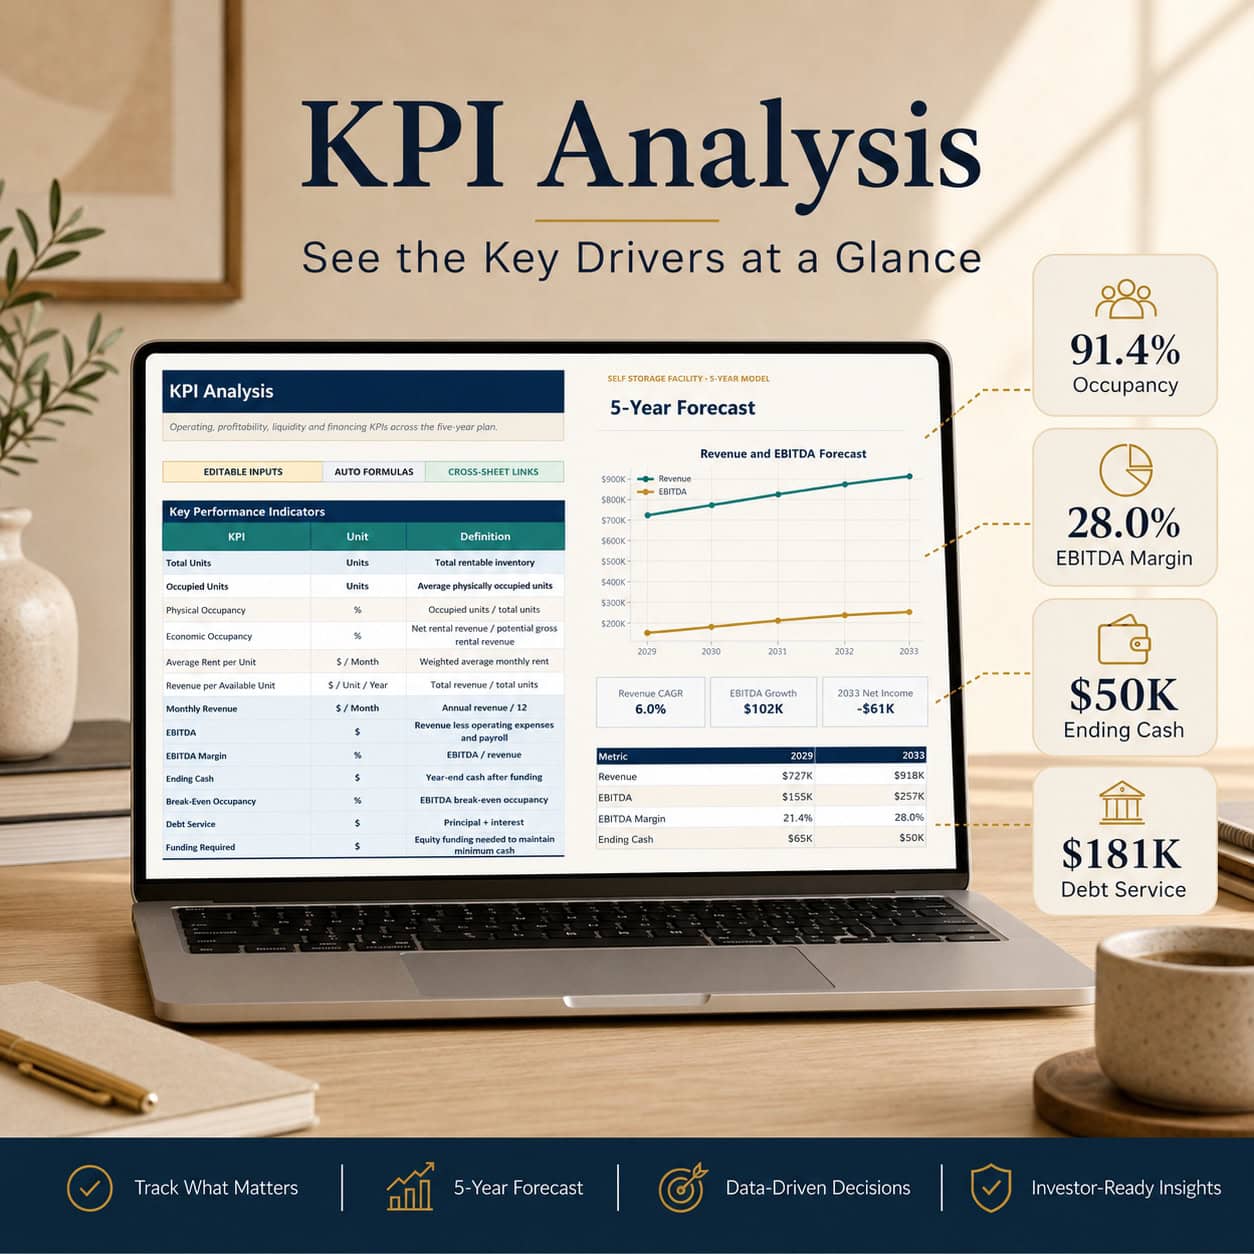
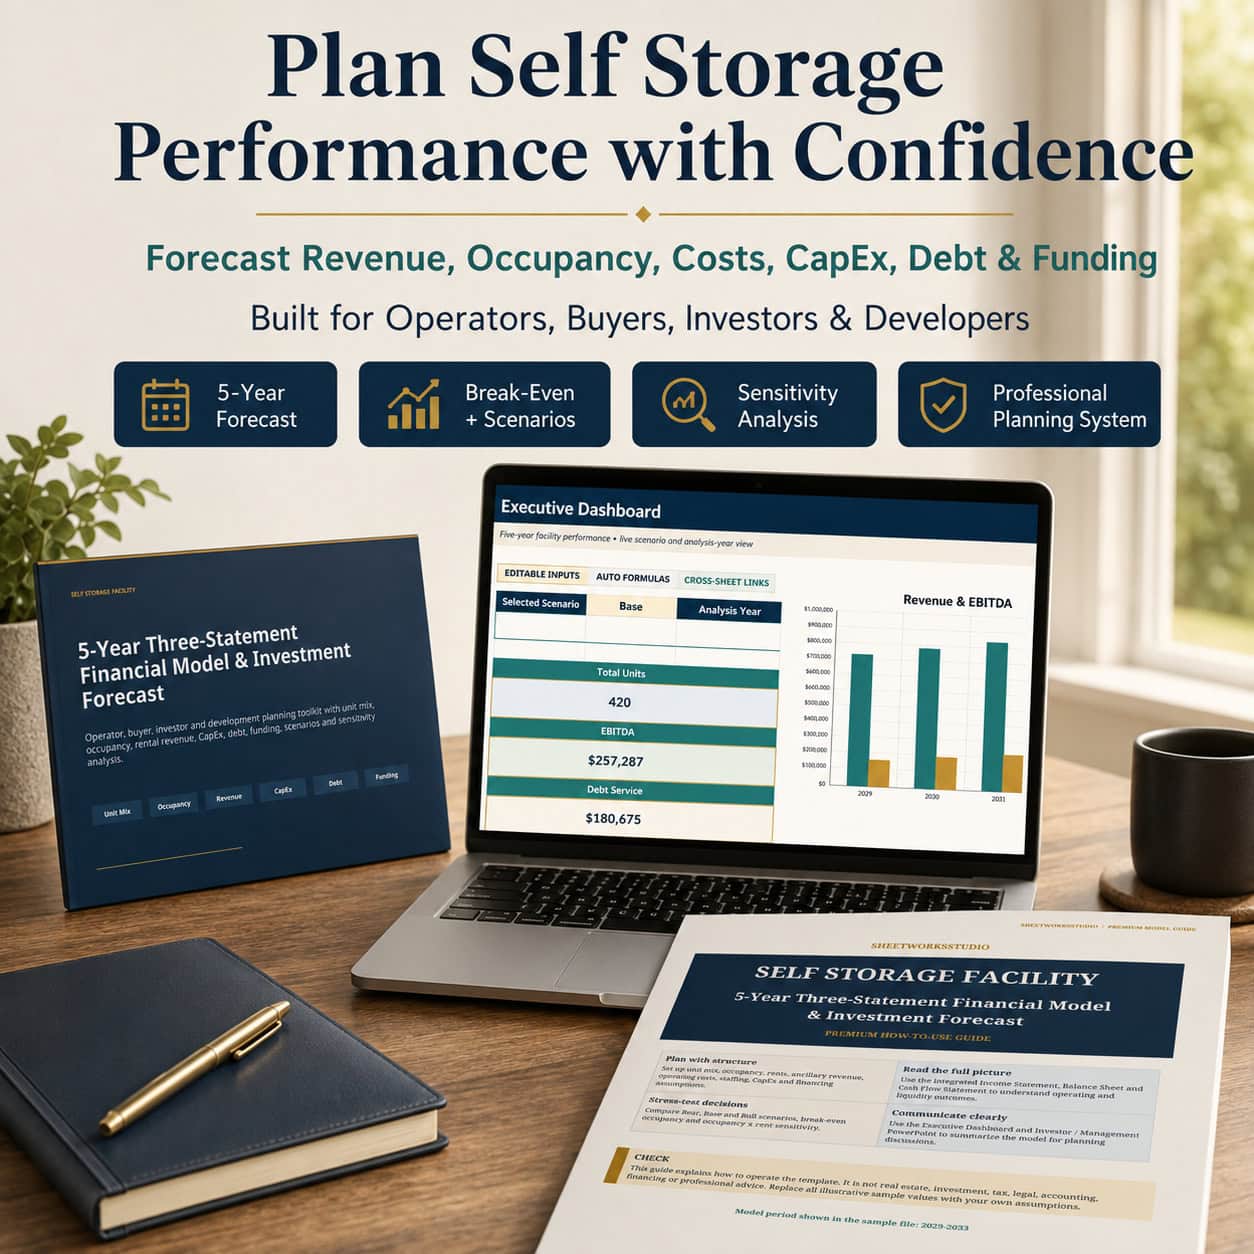
The Executive Dashboard consolidates important facility performance indicators, including:
- Total Storage Units
- Physical Occupancy
- Economic Occupancy
- Average Rent per Unit
- Monthly Revenue
- Revenue per Available Unit
- EBITDA and EBITDA Margin
- Ending Cash
- Break-Even Occupancy
- Debt Service
- Funding Required
Four embedded Excel charts support visual performance reporting.
EBITDA and Cash Break-Even Analysis
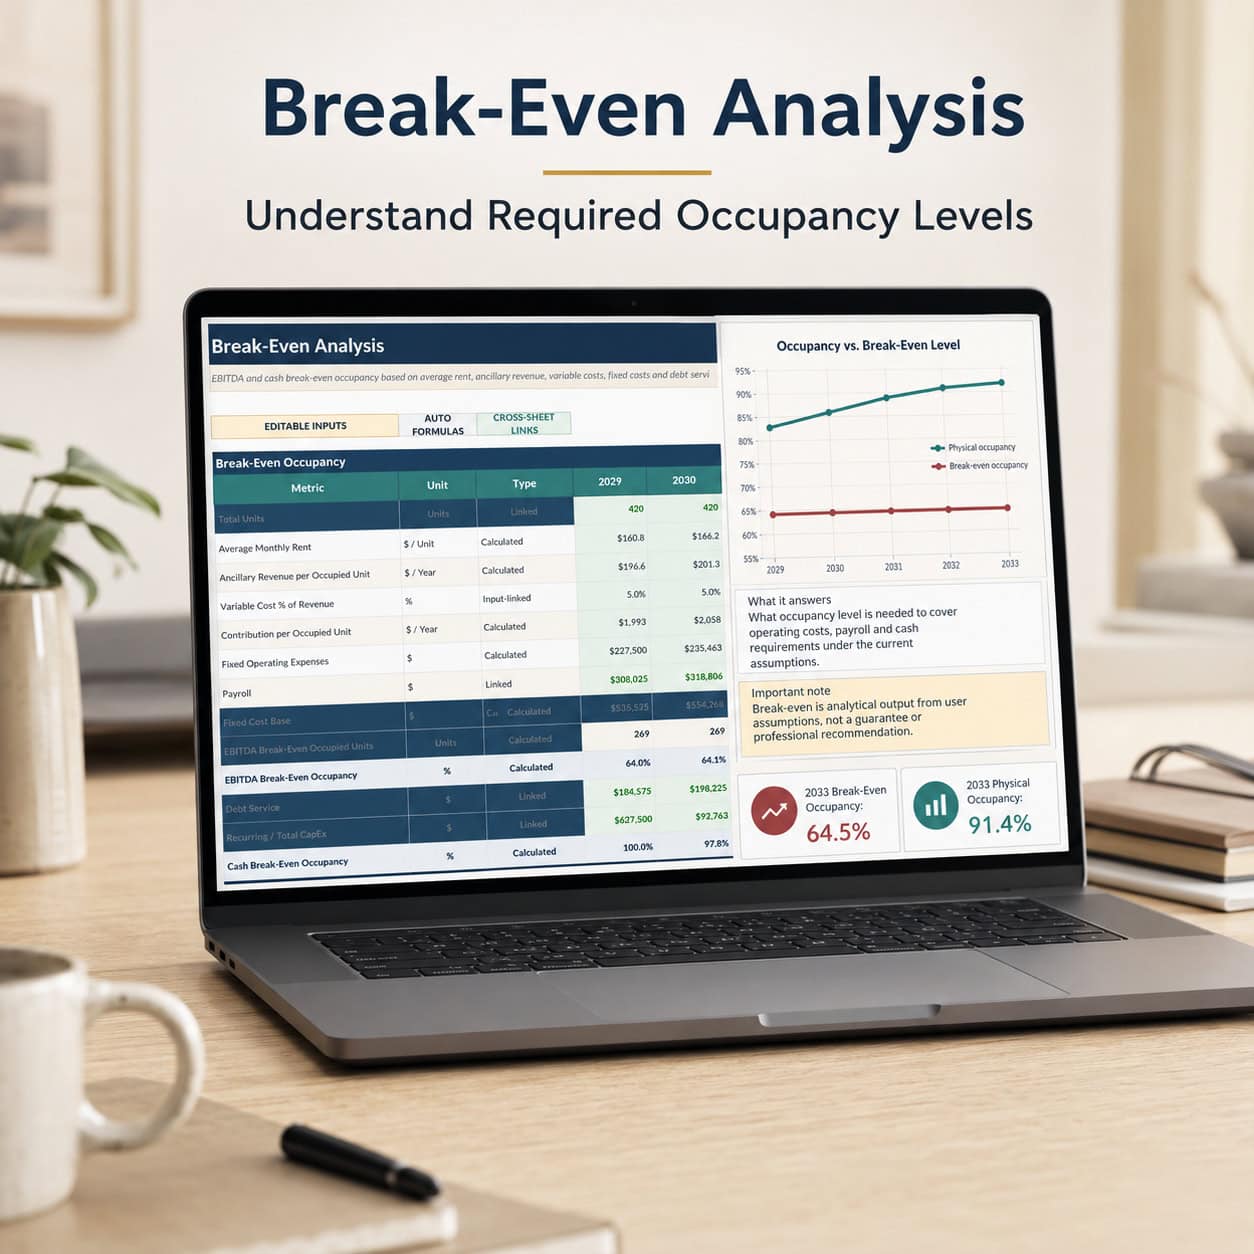
Evaluate the occupancy levels required to reach modeled EBITDA and cash break-even conditions.
These calculations provide useful planning references for assessing occupancy targets and financial sustainability under the entered assumptions.
Bear, Base and Bull Scenarios
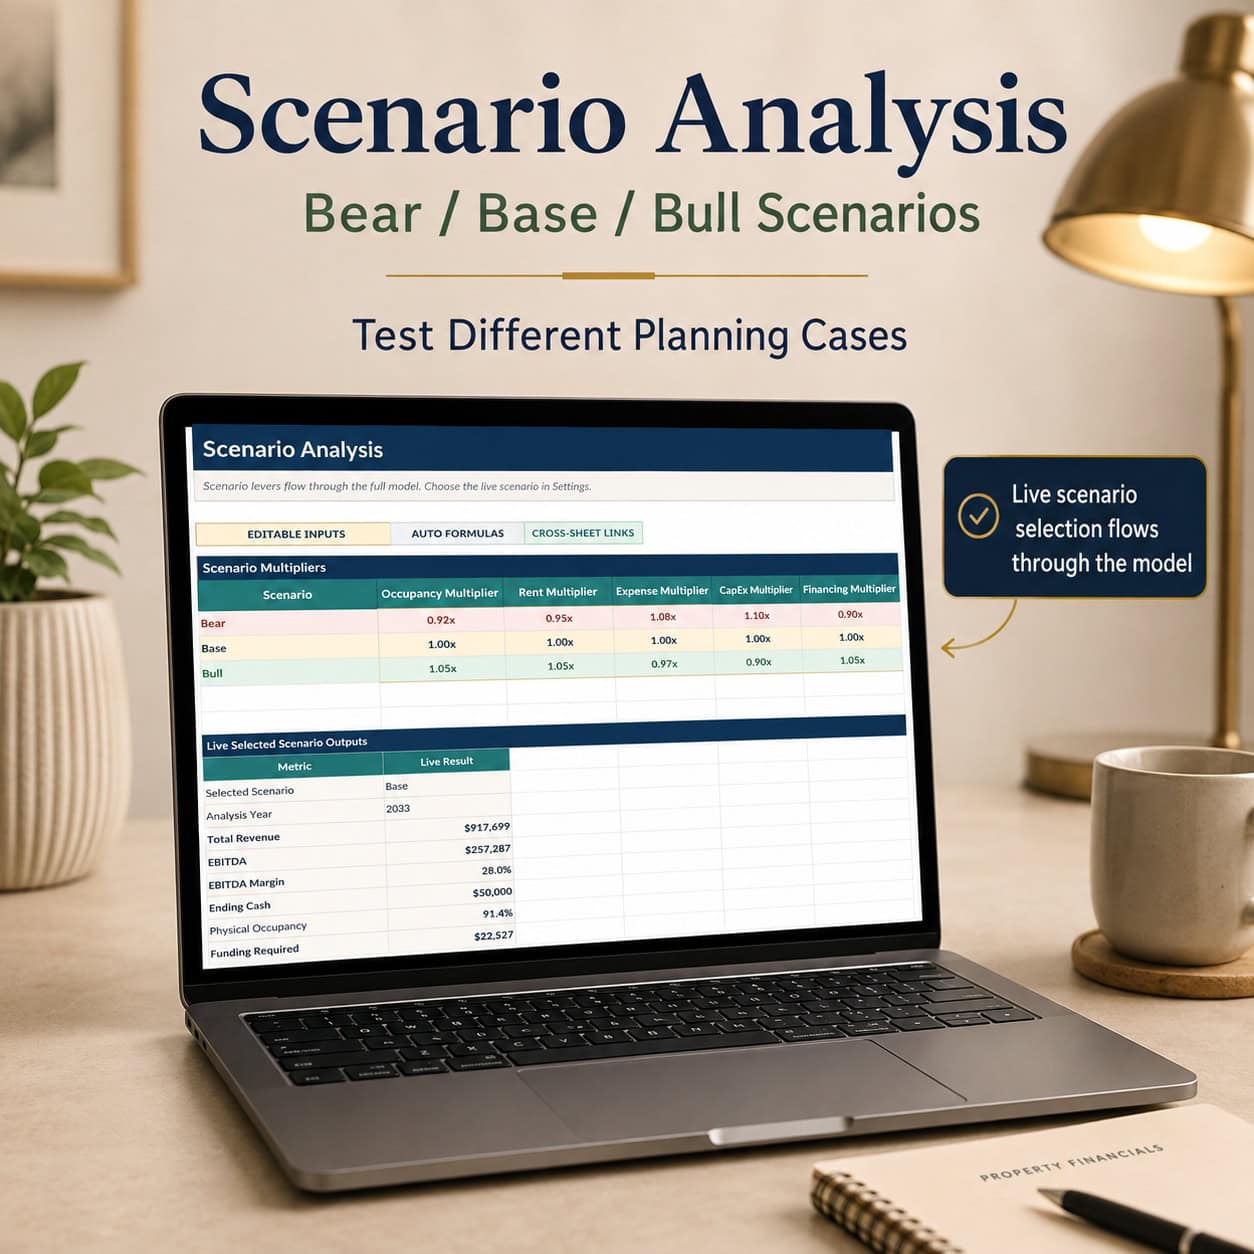
Compare alternative assumptions for occupancy, rental rates, expenses, capital expenditure and financing.
Scenario analysis helps users understand how changes in facility operations and financial conditions may affect forecast outcomes.
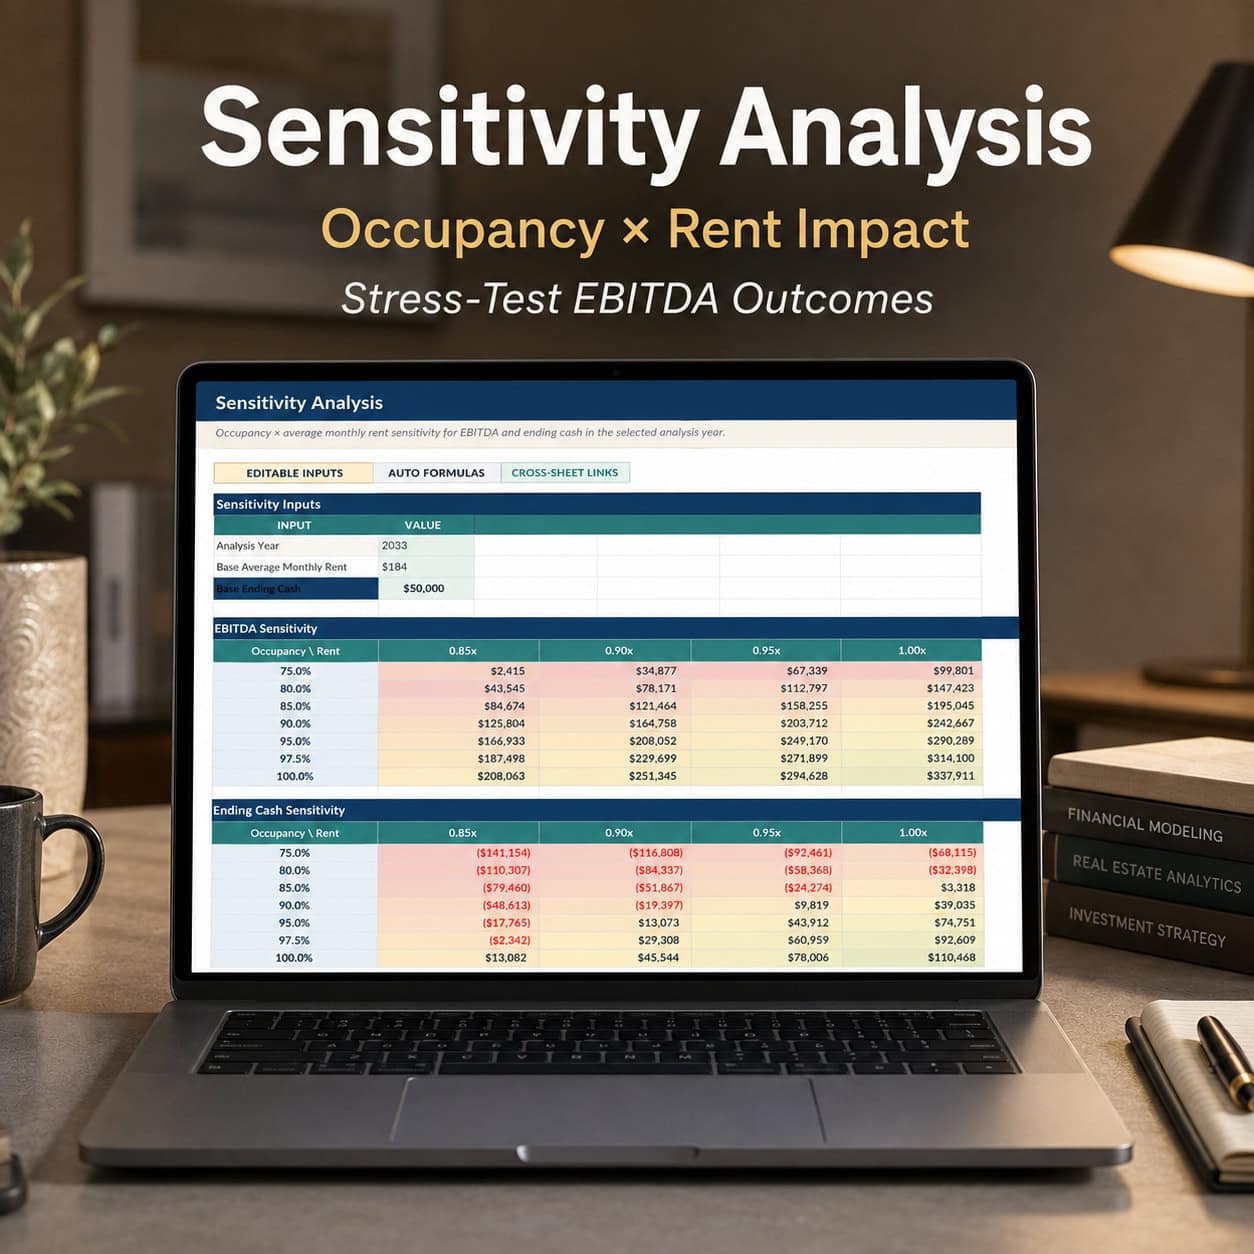
Occupancy and Rental Rate Sensitivity
Analyze how combinations of occupancy and average monthly rent affect projected EBITDA and ending cash.
The sensitivity analysis supports evaluation of pricing, utilization and financial performance.
Technical Specifications
- Excel Financial Model: 24 worksheets
- Planning Horizon: Five years
- Illustrative Sample Period: 2029–2033
- Monthly Forecast: First planning year
- Financial Statements: Income Statement, Balance Sheet and Cash Flow Statement
- Executive Dashboard: Four charts
- Break-Even Analysis: EBITDA and Cash Break-Even Occupancy
- Scenario Analysis: Bear / Base / Bull
- Sensitivity Analysis: Occupancy × Average Monthly Rent
- PowerPoint: 15 editable slides
- PDF Guide: 24 pages
- File Formats: XLSX, PPTX and PDF
- Macros and External Data Connections: None required
Ideal For
Self storage facility operators, owners, buyers, developers, investors, financial analysts, consultants and professionals preparing facility budgets, business plans, financial projections or funding presentations.
Important Information and Disclaimer
This product is a digital financial planning template. All included data and assumptions are illustrative and should be replaced with user-specific information.
The model does not provide live market data, verified industry benchmarks, guaranteed investment returns or automatic property valuations.
It does not constitute investment, financial, accounting, tax, legal, real estate or financing advice. Forecast results depend on the assumptions entered by the user. Users are responsible for reviewing all calculations and obtaining qualified professional advice where appropriate.
Microsoft Excel is the reference environment. Google Sheets import may be possible, but compatibility of formulas, charts and formatting should be checked after import.
Developed by SheetworksStudio. No external certification, endorsement or affiliation is implied.
Similar ProductsOther customers were also interested in...



 eFinancialModels
Electric Vehicle (EV) Charging Station Financial M...
With this comprehensive 5- or 10-year monthly tool, investors can assess the viability of setting up... Read more

Financial Model for Mobile App | Mobile App Busine...
The Mobile App Financial Plan Template in Excel allows you to develop financial projections when lau... Read more

 HenrySheykin
Food Truck Financial Model Excel Template
The Food Truck Financial Model helps entrepreneurs, founders, business owners, consultants, and anal... Read more

Green Hydrogen Production from Wind Energy Financi...
The Green Hydrogen from Wind Financial Model aims to comprehensively forecast a horizon of 40 years ... Read more

Simple Mutual Non-Disclosure Agreement Template
Protect your business secrets with ease using our Simple Mutual Non-Disclosure Agreement Template. S... Read more

Solar Energy Financial Model
The Solar Energy Financial Model Spreadsheet Template in Excel assists you in preparing a sophistica... Read more

 Peter Graf
The Customer-Centric Financial Model for Restauran...
Starting a restaurant without a financial plan is like driving a car blindfolded. You wouldn´t do i... Read more
You must log in to submit a review.