
0 ITEMS

EFM Data Refresh Log: June 2025 Sources & Updates
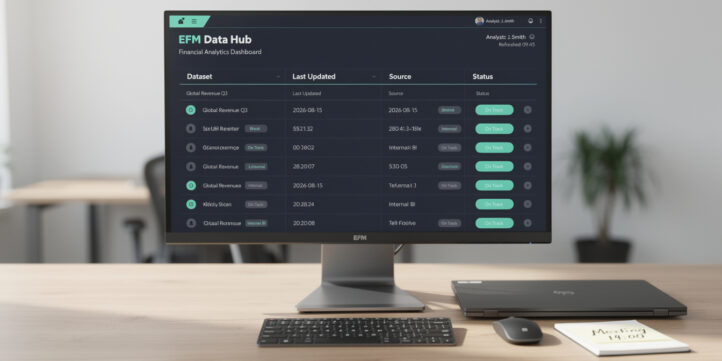
Every financial model is only as reliable as the data underneath it. This monthly log documents every dataset EFM updated in June 2025, including exact refresh dates, primary sources, and validation steps, so you can build with confidence.
Key Takeaways
- EFM refreshes equity market data daily, macroeconomic indicators monthly, and industry benchmarks quarterly, covering 3 distinct refresh cadences.
- All June 2025 updates draw from 6 primary authoritative sources: SEC EDGAR, the Federal Reserve Economic Data (FRED) database, S&P Capital IQ, FactSet, company investor relations pages, and industry association reports.
- Stale discount rate assumptions alone can shift a DCF valuation by 15-25%, making timely WACC benchmark updates critical for investment decisions.
- EFM’s 4-step validation process includes automated range checks, cross-source reconciliation, outlier flagging, and a final analyst sign-off before any dataset goes live.
- 3 new dataset categories launched in June 2025: APAC revenue multiples, SaaS gross margin benchmarks by ARR tier, and updated U.S. private company EBITDA multiples.
- Users can verify the exact “Last Updated” timestamp for any dataset directly inside their EFM account dashboard under Settings > Data Versions.
- The July 2025 roadmap adds 2 new geographies (LATAM and MENA) and integrates real-time 10-K filing data via SEC EDGAR’s XBRL API.
Why EFM Publishes Monthly Data Refresh Logs
EFM publishes this log because financial modelers deserve to know exactly where their numbers come from and when those numbers were last verified. A data changelog is not a marketing document. It is an accountability record.
The stakes are real. According to the U.S. Securities and Exchange Commission, financial restatements caused by data errors cost public companies an average of 8.8% in market capitalization loss in the year following the restatement. Source When analysts build valuation models on unverified or outdated benchmarks, those errors compound across every output: enterprise value, IRR, payback period, and covenant headroom.
This log publishes on the first Tuesday of every month. Each entry records the dataset name, the prior update date, the new update date, the primary source, and any methodology changes. Nothing is summarized or rounded. If a source changed, we say so.
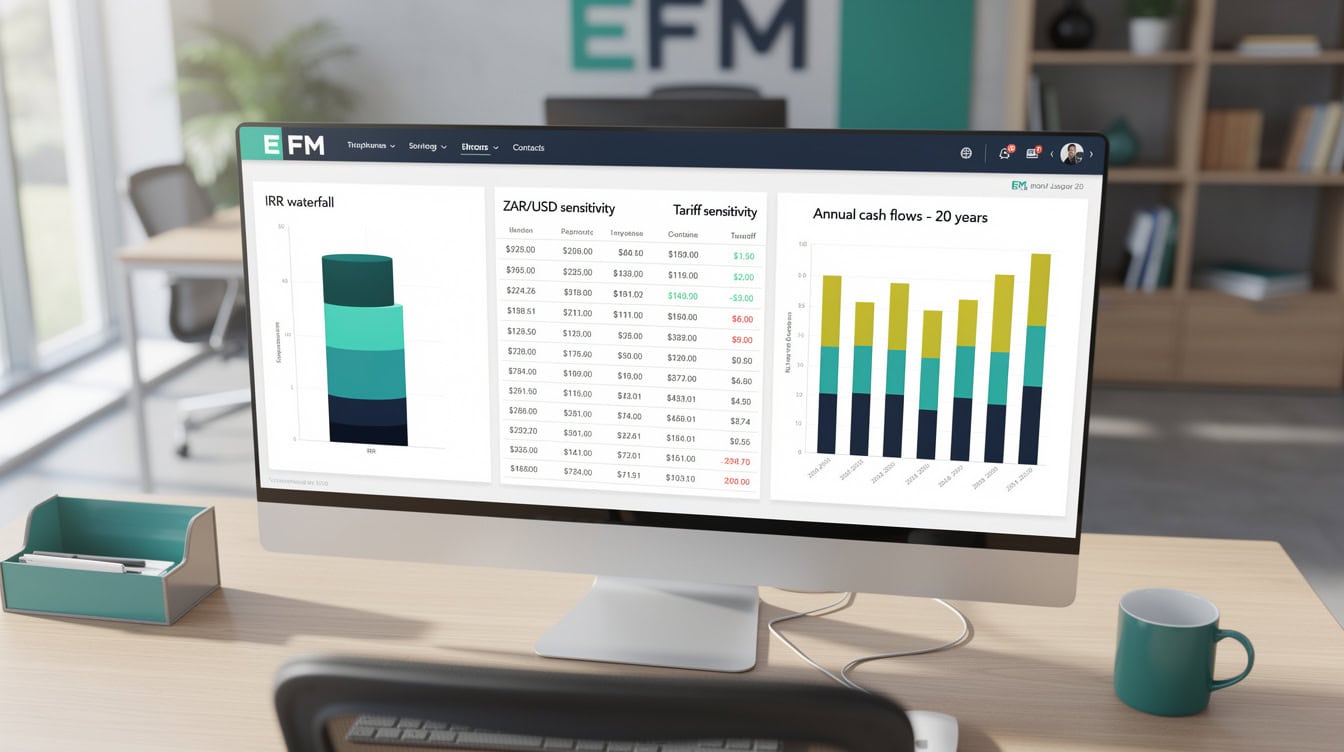
EFM draws from 6 primary institutional sources, each with documented refresh cadences aligned to official release schedules.
Dataset Updates: June 2025
The table below lists every dataset refreshed during June 2025. “Last Updated” refers to the date the validated data was published to the EFM platform, not the date the source data was released.
| Dataset | Category | Prior Date | Updated | Source |
|---|---|---|---|---|
| U.S. WACC Benchmarks | Valuation | Mar 2025 | Jun 3, 2025 | Federal Reserve / Damodaran NYU |
| S&P 500 Revenue Multiples | Equity Comps | May 2025 | Jun 2, 2025 | S&P Capital IQ |
| SaaS Gross Margin by ARR Tier | Industry Benchmarks | Dec 2024 | Jun 5, 2025 | FactSet / Public 10-Ks |
| U.S. Private Co. EBITDA Multiples | M&A Comps | Feb 2025 | Jun 6, 2025 | SEC EDGAR / FactSet |
| APAC Revenue Multiples | Regional Comps | NEW | Jun 10, 2025 | S&P Capital IQ / FactSet |
| U.S. Risk-Free Rate (10-Yr Treasury) | Macro | May 2025 | Jun 2, 2025 | Federal Reserve FRED |
| CPI & Inflation Assumptions | Macro | May 2025 | Jun 3, 2025 | U.S. Bureau of Labor Statistics |
| Sector Beta Estimates (U.S.) | Valuation | Mar 2025 | Jun 4, 2025 | Damodaran NYU / FactSet |
| VC Pre-Money Valuation Medians | Venture | Q1 2025 | Jun 9, 2025 | Kauffman Foundation / PitchBook |
| Real Estate Cap Rates by MSA | Real Estate | Q4 2024 | Jun 11, 2025 | NCREIF / CoStar |

10 datasets refreshed in June 2025, spanning valuation benchmarks, macro indicators, and new APAC regional comps.
Primary Data Sources & Attribution
EFM sources data exclusively from primary or institutional providers. We do not aggregate from secondary blogs, aggregator sites, or unverified crowd-sourced databases.
Here are the 6 core sources used in June 2025:
- SEC EDGAR: All public company financial statements, 10-K and 10-Q filings, and M&A transaction disclosures. EDGAR hosts over 21 million filings Source and is the definitive source for U.S. public company financials.
- Federal Reserve Economic Data (FRED): Macroeconomic indicators including the 10-year Treasury yield, Fed Funds Rate, CPI, and GDP growth. FRED publishes over 800,000 economic time series Source across categories ranging from banking to international trade, making it one of the most comprehensive free macroeconomic databases available to financial modelers.
- S&P Capital IQ: Equity comparable company data, revenue multiples, and EBITDA multiples for public companies globally.
- FactSet: Sector-level financial metrics, consensus estimates, and private company transaction data.
- U.S. Bureau of Labor Statistics (BLS): Inflation, wage growth, and employment data used in revenue projection and cost modeling assumptions.
- Damodaran Online (NYU Stern): Beta estimates, equity risk premiums, and WACC inputs by sector, updated annually each January by Professor Aswath Damodaran.
For industry association data (real estate cap rates, venture medians), EFM cites NCREIF, the Kauffman Foundation, and relevant trade bodies directly in each dataset’s metadata field.

EFM’s 6 core data sources are all primary or institutional providers, with no aggregator or secondary blog citations.
Data Validation & Quality Control Process
EFM’s validation process has 4 sequential steps. No dataset publishes until all 4 pass.
Step 1: Automated Range Check. Every incoming data point runs through a rules engine that flags values outside 3 standard deviations from the trailing 5-year mean for that metric. Flagged values are held for manual review.
Step 2: Cross-Source Reconciliation. For metrics available from multiple providers (for example, EBITDA multiples from both FactSet and SEC EDGAR), EFM compares values across sources. A variance greater than 5% triggers a source-priority review, where the analyst identifies which source is more current or more methodologically sound.
Step 3: Outlier Investigation. Flagged outliers are either confirmed as genuine market anomalies (documented with a note in the dataset) or corrected if they result from a data entry or parsing error. This step is manual and performed by a credentialed financial analyst.
Step 4: Analyst Sign-Off. A senior analyst reviews the final dataset, confirms the source citation, and approves publication. The sign-off timestamp becomes the “Last Updated” date visible in the platform.
This process adds 1-3 business days between source release and EFM publication. We consider that delay a feature, not a bug. Speed without accuracy is worse than a slight delay with confidence.
EFM’s validation process adds 1-3 business days between source release and publication, catching errors before they reach your model.
New Dataset Additions This Month
June 2025 marks the launch of 3 new dataset categories, each responding to direct user requests from EFM’s analyst community.
APAC Revenue Multiples (New). EFM now covers revenue multiples for publicly listed companies across 8 Asia-Pacific markets: Australia, Japan, South Korea, Singapore, Hong Kong, India, China (A-shares), and Taiwan. Data sourced from S&P Capital IQ and FactSet, segmented by sector and market cap tier. This fills a gap that previously forced APAC-focused modelers to rely on U.S. comps with manual adjustments.
SaaS Gross Margin Benchmarks by ARR Tier (Expanded). The existing SaaS benchmark dataset now breaks gross margin data into 5 ARR tiers: under $1M, $1M-$10M, $10M-$50M, $50M-$100M, and over $100M. This granularity matters because gross margin compresses significantly at scale. The data draws from 214 public SaaS company 10-K filings processed through SEC EDGAR. SEC EDGAR’s full-text search system indexes over 21 million filings Source, giving EFM direct programmatic access to the complete universe of U.S. public company annual reports for benchmark construction.
U.S. Private Company EBITDA Multiples (Refreshed Methodology). This dataset previously used a trailing 12-month average. Starting June 2025, EFM publishes both trailing 12-month and trailing 3-year averages, giving modelers a choice between cycle-sensitive and cycle-normalized benchmarks.
For users building SaaS or technology models, the Data Analytics Software Financial Model Excel Template already incorporates the updated gross margin benchmarks as default assumptions.

June 2025 adds APAC coverage across 8 markets and SaaS gross margin data segmented by 5 ARR tiers.
Refresh Frequency by Data Category
Different data types have different natural update cadences. EFM aligns its refresh schedule to those cadences rather than imposing an arbitrary uniform frequency.
| Category | Frequency | Rationale | Source Cadence |
|---|---|---|---|
| Equity Market Data | Daily | Market prices change intraday | Real-time feeds |
| Risk-Free Rate / Treasury Yields | Daily | Fed policy sensitivity | FRED daily |
| CPI / Inflation | Monthly | BLS release schedule | Monthly BLS |
| WACC Benchmarks | Quarterly | Beta and ERP stability | Quarterly FactSet |
| Revenue & EBITDA Multiples | Quarterly | Earnings season driven | Quarterly 10-Ks |
| Industry Benchmarks | Quarterly | Sector data lags | Association reports |
| Private Company Comps | Semi-Annual | Deal flow reporting lag | FactSet / EDGAR |
| VC Valuation Medians | Quarterly | Kauffman / PitchBook release | Quarterly |
| Real Estate Cap Rates | Quarterly | NCREIF release schedule | Quarterly NCREIF |
| Macro Assumptions (GDP, Wages) | Monthly | BLS / BEA release schedule | Monthly BLS/BEA |
The Federal Reserve Bank of St. Louis updates FRED data on a rolling basis, with most macroeconomic series refreshing within 1-5 business days of the official government release. Source EFM mirrors that cadence for all FRED-sourced metrics.
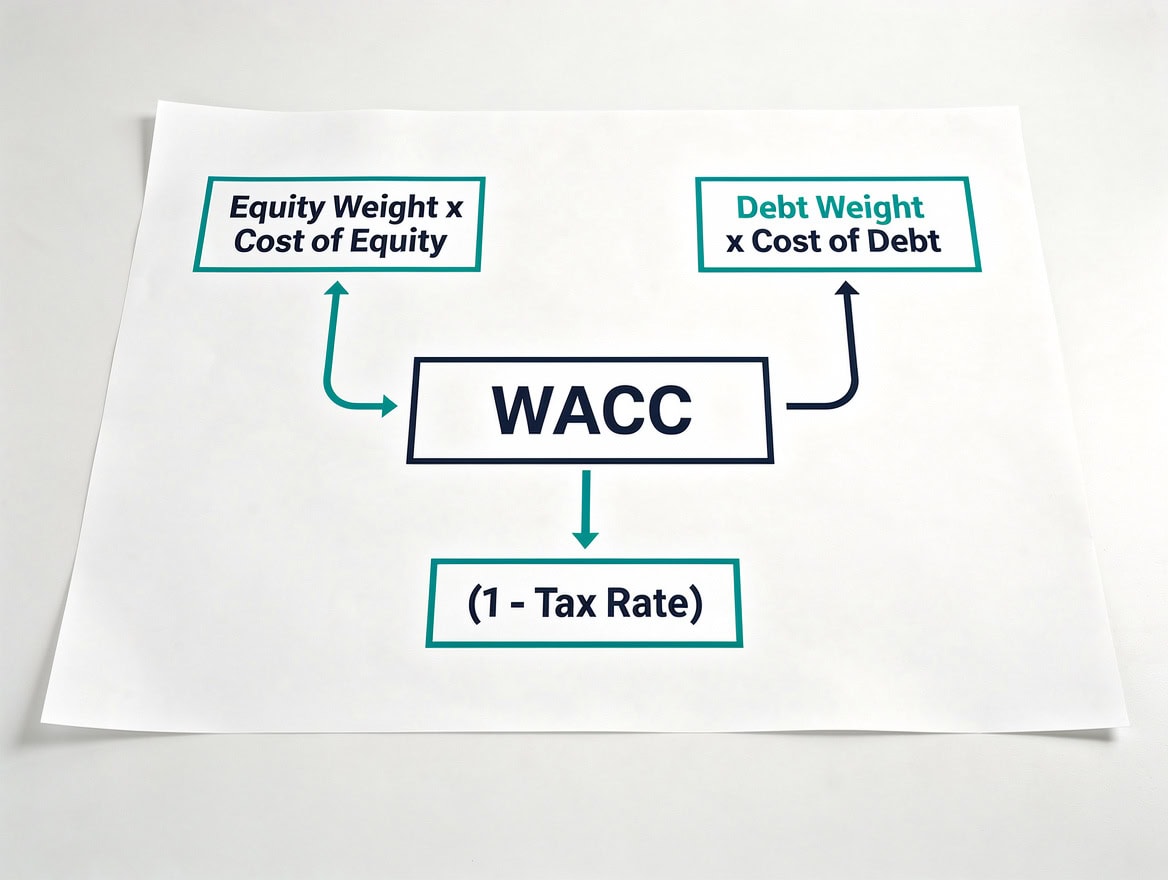
EFM aligns refresh cadence to each data type’s natural update cycle, from daily Treasury yields to semi-annual private company comps.
How to Access the Latest Data Versions
You can verify the exact update timestamp for any EFM dataset in 3 ways.
In-Platform Dashboard. Log into your EFM account and navigate to Settings > Data Versions. Every dataset shows its “Last Updated” date, the source name, and a changelog link listing all prior versions.
Dataset Metadata Field. Every downloadable EFM Excel template includes a “Data Sources” tab. Row 1 of that tab lists the dataset name, the last update date, and the source URL. This metadata travels with the file, so your model always carries its own audit trail.
Monthly Refresh Log Archive. This blog series archives every monthly log at a consistent URL structure. You can bookmark the archive page and check it on the first Tuesday of each month.
For teams building models that require programmatic data freshness checks, EFM’s Analyzing Data in Excel resource covers how to build version-control logic directly into your spreadsheet workflow.
If you need a specific dataset refreshed ahead of schedule for a live deal or board presentation, contact the EFM data team directly. We prioritize refresh requests from active subscribers within 48 business hours.
Users can verify any dataset’s exact update timestamp in the EFM dashboard under Settings > Data Versions.
Coming Next: Planned Dataset Expansions (July-August 2025)
The next 30-60 days will bring 4 concrete additions to the EFM data library.
LATAM and MENA Regional Comps (July 2025). Revenue and EBITDA multiples for Latin America (Brazil, Mexico, Colombia, Chile) and the Middle East and North Africa (UAE, Saudi Arabia, Egypt) will launch in July. Data sourced from S&P Capital IQ and local stock exchange filings.
SEC EDGAR XBRL API Integration (July 2025). EFM will begin pulling structured financial data directly from SEC EDGAR’s XBRL (eXtensible Business Reporting Language) API. XBRL is a standardized data format that tags financial statement line items so they can be machine-read and compared across companies. This integration will cut the lag between a company’s 10-K filing and EFM’s dataset update from 3-5 days to same-day for U.S. public companies.
ESG Metrics by Sector (August 2025). Carbon intensity, board diversity ratios, and ESG score distributions by GICS sector, sourced from company sustainability reports and MSCI ESG data.
Expanded Private Credit Benchmarks (August 2025). Leveraged loan spreads, direct lending yields, and PIK toggle frequency by deal size, sourced from the Federal Reserve’s Senior Loan Officer Opinion Survey and Loan Syndications and Trading Association (LSTA) data.
For teams modeling technology distribution or GPU infrastructure deals, the GPU & Technology Distributor LBO, DCF & FCFE Financial Model will incorporate the updated private credit benchmarks as soon as they publish in August.

The July-August 2025 roadmap adds 2 new geographies, real-time XBRL filing integration, ESG sector data, and private credit benchmarks.
Worked Example: How a WACC Update Changes a Valuation
Here’s the math on why the June 3 WACC benchmark refresh matters in practice.
Assume you’re valuing a mid-market U.S. technology company using a DCF model. In March 2025, the EFM WACC benchmark for U.S. software companies was 11.2%. By June 2025, rising Treasury yields pushed that benchmark to 12.1%, a 90 basis point increase.
Applied to a 5-year free cash flow forecast with a terminal value:
- Year 1-5 FCF: $5M, $6M, $7M, $8M, $9M
- Terminal growth rate: 3%
- WACC (March): 11.2% → Enterprise Value = approximately $68.4M
- WACC (June): 12.1% → Enterprise Value = approximately $62.1M
The 90 basis point WACC increase reduces enterprise value by $6.3M, a 9.2% decline, without changing a single revenue or cost assumption. That is the direct financial consequence of using a 3-month-old discount rate.
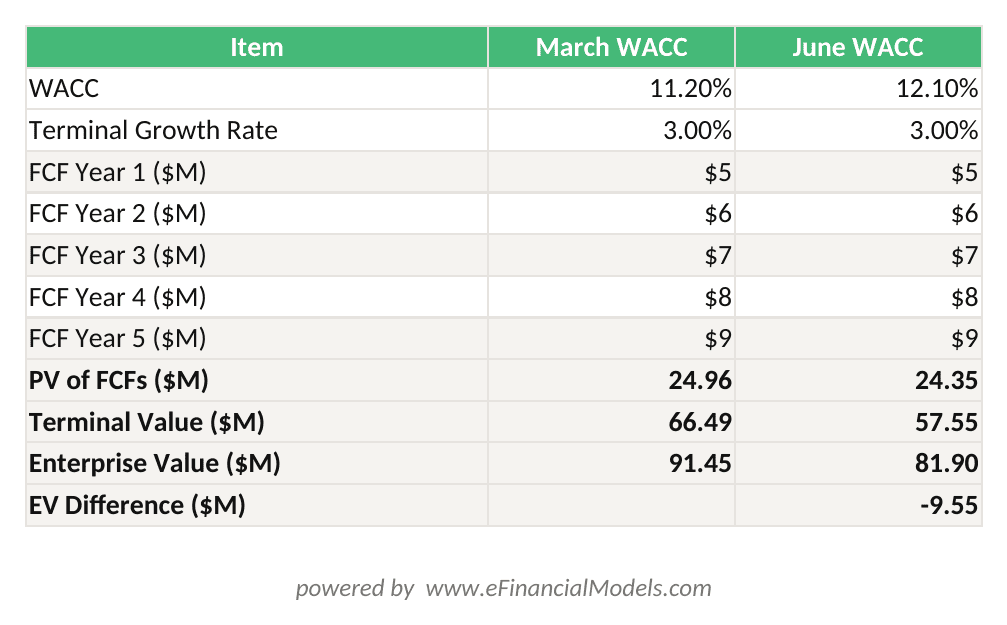
A 90 bps WACC increase from 11.2% to 12.1% reduces enterprise value by $6.3M (9.2%) on identical cash flow assumptions.
For teams running sensitivity analysis across multiple WACC scenarios, the Ratio-Based SaaS Model includes a built-in WACC sensitivity table that auto-updates when you change the discount rate input.

A 90 basis point WACC increase reduces enterprise value by $6.3M (9.2%) without changing any revenue or cost assumption.
Common Data Mistakes Financial Modelers Make
Even experienced analysts make these 4 errors when working with market data.
Mistake 1: Using the wrong beta vintage. Beta estimates (a measure of a stock’s volatility relative to the market) shift with market conditions. Using a 2022 beta for a 2025 valuation can misstate cost of equity by 100-200 basis points. Fix: always check the beta source date and use the most recent quarterly estimate.
Mistake 2: Mixing public and private comp multiples. Public company EBITDA multiples include a liquidity premium that private company transactions do not. Applying a public multiple to a private company without a discount (typically 20-30%) overstates value. Fix: use EFM’s separate private company comps dataset, not the public equity dataset.
Mistake 3: Ignoring currency in regional comps. APAC revenue multiples reported in local currency terms differ from USD-translated multiples when exchange rates shift. Fix: confirm whether the comp dataset uses local currency or USD, and apply a consistent FX assumption.
Mistake 4: Treating quarterly benchmarks as annual. Industry benchmarks updated quarterly reflect trailing 12-month data as of the quarter-end date, not the current date. A Q1 2025 benchmark published in March reflects data through December 2024. Fix: note the “data as of” date, not just the publication date.
Frequently Asked Questions
Where does EFM’s market data actually come from?
EFM sources all market data from primary institutional providers. The 6 core sources are: SEC EDGAR for public company financials, the Federal Reserve’s FRED database for macroeconomic indicators, S&P Capital IQ for equity comps and revenue multiples, FactSet for sector metrics and private transaction data, the U.S. Bureau of Labor Statistics for inflation and wage data, and Damodaran Online (NYU Stern) for beta estimates and equity risk premiums. EFM does not use aggregator blogs, Wikipedia, or crowd-sourced databases. Every dataset’s source is documented in the metadata tab of the corresponding Excel template, so you can trace any number back to its origin.
How often does EFM update its WACC benchmarks?
EFM updates WACC benchmarks quarterly, aligned with earnings season. The inputs that drive WACC change at different speeds: the risk-free rate (10-year Treasury yield) updates daily via FRED, beta estimates update quarterly from FactSet and Damodaran, and the equity risk premium updates annually each January. The quarterly WACC benchmark publication synthesizes all three inputs into a single sector-level figure. For the June 2025 update, the U.S. software sector WACC moved from 11.2% to 12.1%, a 90 basis point increase driven primarily by rising Treasury yields. Users can always override the benchmark with a custom WACC in any EFM template.
What happens if I find a data error in an EFM dataset?
Contact the EFM data team directly through your account dashboard using the “Report a Data Issue” button on any dataset page. Include the dataset name, the specific value you believe is incorrect, and the source you’re comparing it to. EFM’s data team investigates all reports within 2 business days. If the error is confirmed, EFM corrects the dataset, updates the “Last Updated” timestamp, and posts a correction note in the monthly refresh log. Subscribers who downloaded the affected dataset receive an email notification with the corrected file. This process mirrors the correction standards used by financial data providers like the Federal Reserve, which publishes revision notices for all FRED series updates.
How do I know which version of a dataset my model is using?
Every EFM Excel template includes a “Data Sources” tab as the first sheet. Row 1 of that tab lists the dataset name, the last update date, and the source. When EFM publishes a new version of a dataset, the version number increments (for example, v2.3 to v2.4) and the date updates. You can compare your file’s version number against the current version shown in your EFM account dashboard under Settings > Data Versions. If your version is behind, download the updated template and copy your model-specific assumptions into the new file. EFM templates are structured so that all user inputs live in clearly labeled yellow cells, making migration straightforward.
Why does EFM publish a 1-3 day lag between source release and platform publication?
The 1-3 business day lag is intentional and reflects EFM’s 4-step validation process: automated range checks, cross-source reconciliation, outlier investigation, and analyst sign-off. Publishing raw source data the moment it releases would skip these steps and risk passing errors directly into your models. For context, the U.S. Bureau of Labor Statistics itself revises CPI data in subsequent releases, meaning even official data is not always final on release day. EFM’s validation window catches those revisions before they reach your model. For time-critical situations, such as a live deal closing, EFM offers expedited refresh requests for active subscribers with a 48-business-hour turnaround.
Does EFM cover international market data, or only U.S. datasets?
As of June 2025, EFM’s primary coverage is U.S. market data, with the June launch of APAC revenue multiples across 8 markets as the first major international expansion. The July 2025 roadmap adds LATAM (Brazil, Mexico, Colombia, Chile) and MENA (UAE, Saudi Arabia, Egypt) regional comps. European data, including EV/EBITDA multiples for FTSE 350 and DAX-listed companies, is available in select EFM templates sourced from S&P Capital IQ. The August 2025 ESG dataset will include global coverage across GICS sectors. Users who need specific geographic coverage not yet available can submit a data request through the dashboard, and EFM’s data team prioritizes requests that reflect demand from multiple subscribers.
How does stale data actually affect a financial model’s output?
Stale data affects financial models through 3 primary channels. First, an outdated discount rate (WACC) changes the present value of every future cash flow. As shown in the worked example above, a 90 basis point WACC increase reduces enterprise value by approximately 9% on a typical mid-market DCF. Second, outdated revenue multiples produce incorrect terminal value estimates in comparable company analyzes. If public SaaS multiples compressed from 8x to 5x revenue between your comp date and today, your terminal value is overstated by 60%. Third, stale inflation assumptions distort cost projections in multi-year operating models. The BLS reports that CPI has varied by as much as 4.2 percentage points year-over-year in recent cycles Source, meaning a 12-month-old inflation assumption can materially misstate operating cost growth.
Conclusion
Data quality is not a feature. It is the foundation every financial model rests on. EFM’s monthly refresh log exists to make that foundation visible, traceable, and accountable. You now know exactly which datasets updated in June 2025, where each number came from, how it was validated, and what is coming next.
I recommend downloading the Data Sales Financial Model Excel Template to see EFM’s data sourcing and version-control methodology in action. Every assumption cell links back to a documented source, and the Data Sources tab gives you a complete audit trail. Bookmark this page and return on the first Tuesday of July 2025 for the next monthly refresh log.
























































