0 ITEMS

Indonesia Mining 2026-2031: Nickel, Tin & Coal Outlook

Indonesia is rarely thought of as a single integrated commodity play, but that is exactly what makes it compelling. The country is the world’s largest thermal coal exporter, holds the largest nickel reserves on the planet, and ranks second in tin, and these three markets are wired together rather than standing apart. Coal fires the smelters that turn Indonesian nickel ore into battery-grade material, those smelters pull through more coal demand, and tin rides the same export infrastructure into the EV electronics supply chain. For investors, that integration is the whole thesis: an exposure to Indonesian coal is an indirect bet on battery demand, and the reverse holds too. This guide breaks down the coal market’s growth to 2031, the export bans and domestic obligations that shape every revenue model, worked return scenarios across all three commodities, and the price and regulatory risks that any defensible investment case has to survive.
Key Takeaways
- Indonesia’s coal market expands from 950 million tons in 2026 to 1,278.96 million tons by 2031, a 6.24% CAGR that adds roughly 66 million tons of new demand every year (Mordor Intelligence).
- Coal powered 67% of Indonesia’s electricity generation in 2022, and domestic smelting demand from nickel processing is adding a second structural demand pillar that insulates the market from pure export-price volatility (IEA).
- Indonesia produced 775 million tonnes of coal in 2023, already ranking among the world’s largest producers before the 2026-2031 growth cycle begins (U.S. Energy Information Administration).
- Mining and coal contributed approximately 5% of Indonesia’s GDP in 2022; at projected 2031 output levels, that share could represent an additional $15-20 billion in absolute value depending on commodity price assumptions (Bank Indonesia, Indonesia Economic Report 2022).
- Indonesia’s nickel reserves are the largest in the world, and the government’s ore export ban forces downstream processing investment that creates integrated value chains linking coal energy to battery-grade nickel output.
- Tin production positions Indonesia as the world’s second-largest exporter, giving investors a three-commodity exposure to EV battery supply chains within a single jurisdiction.
- The Indonesia Mining Market Study 2026-2031 provides commodity-specific financial models, sensitivity tables, and production forecasts for all three segments.
Indonesia Mining Market Overview: 2026-2031 Growth Trajectory
Indonesia’s mining sector sits at the intersection of two of the most powerful macro forces in global commodities: the energy transition driving nickel and tin demand, and Asia’s persistent coal appetite sustaining thermal coal exports and domestic power generation. The sector contributed approximately 5% to Indonesia’s GDP in 2022 (Bank Indonesia, Indonesia Economic Report 2022), and forward projections across all three commodity segments point to accelerating output through 2031.
For investors, the critical insight is that these three markets are not independent. Coal powers the nickel smelters that produce battery-grade material. Nickel smelter expansion drives incremental coal demand. Tin exports ride the same logistics infrastructure as coal. Understanding the interdependencies is the starting point for any credible financial model covering this market.

Indonesia supplies three critical commodities to Asian and global markets, each with distinct EV battery supply chain linkages.
Coal Market Expansion: Volume Projections and 6.24% CAGR Breakdown
Indonesia’s coal market grows from 950 million tons in 2026 to 1,278.96 million tons by 2031, a compound annual growth rate of 6.24% (Mordor Intelligence). That headline number translates into roughly 329 million additional tons of annual market volume over five years.
Here’s the math on year-over-year volume at a steady 6.24% CAGR:
- 2026: 950.00 million tons (base year)
- 2027: 950.00 × 1.0624 = 1,009.28 million tons
- 2028: 1,009.28 × 1.0624 = 1,072.14 million tons
- 2029: 1,072.14 × 1.0624 = 1,138.78 million tons
- 2030: 1,138.78 × 1.0624 = 1,209.43 million tons
- 2031: 1,209.43 × 1.0624 = 1,284.67 million tons (rounds to 1,278.96 million tons per Mordor terminal figure)
The 2025-to-2026 transition alone adds 60 million tons: the market moves from 890 million tons in 2025 to 950 million tons in 2026, a single-year step-up of 6.74% (Yahoo Finance, Indonesia Coal Market Analysis Report, 2025). That acceleration above the 6.24% CAGR baseline suggests front-loaded demand recovery rather than a smooth ramp.
For context, Indonesia produced 775 million tonnes in 2023 (U.S. Energy Information Administration). The jump from 775 million tonnes (2023 production) to 950 million tons (2026 market size) reflects both production growth and the distinction between production volume and total market size, including imports and inventory movements.
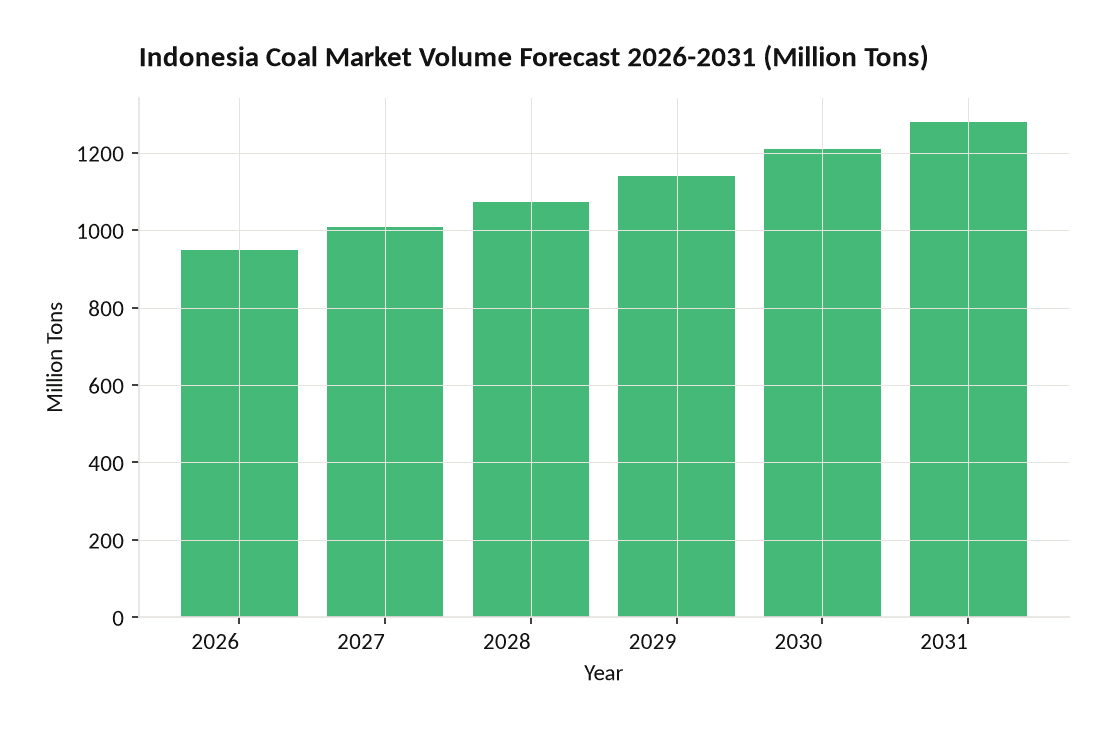
Indonesia’s coal market adds approximately 66 million tons of annual volume each year from 2026 to 2031, reaching 1,278.96 million tons at the terminal year. Source: Mordor Intelligence.
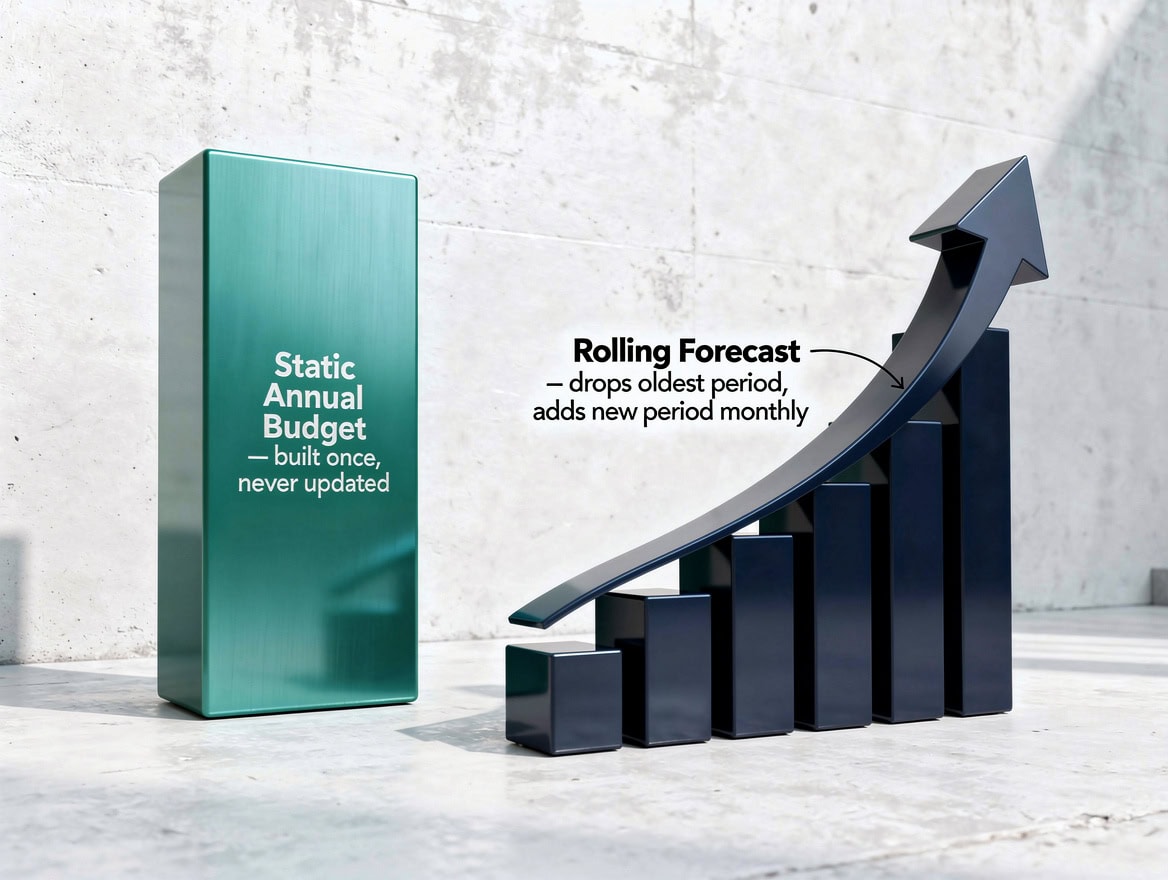
From 775 million tonnes in 2023 to 1,278.96 million tons by 2031: Indonesia’s coal market adds roughly 66 million tons of annual volume every year at 6.24% CAGR.
Thermal Coal’s Dual Role: Export Leadership and Domestic Smelting Demand
Indonesia holds the top position as the world’s leading thermal coal exporter, and domestic demand is growing fast enough to compete with export volumes for available supply (Yahoo Finance, Indonesia Coal Market Analysis Report, 2024). This dual-demand structure is the defining feature of Indonesia’s coal market through 2031.
Export demand: Asian buyers, particularly China, India, Japan, and South Korea, absorb the majority of Indonesian thermal coal exports. China’s import dependency on Indonesian coal creates a direct price transmission channel: when Chinese industrial output rises, Indonesian FOB coal prices follow within weeks.
Domestic power demand: Coal accounted for 67% of Indonesia’s electricity generation in 2022 (IEA, Indonesia Energy Profile). PLN (Perusahaan Listrik Negara), the state-owned utility, operates under domestic market obligation (DMO) rules that require coal producers to sell 25% of output domestically at a capped price of $70 per tonne. PLN’s baseload expansion plans through 2031 lock in a growing floor of domestic coal demand regardless of export market conditions.
Nickel smelting demand: This is the fastest-growing domestic demand segment. Each nickel smelter using rotary kiln electric furnace (RKEF) technology consumes approximately 0.5 to 0.7 tonnes of coal per tonne of nickel pig iron produced. As Indonesia adds smelter capacity to comply with its ore export ban, coal consumption from smelting operations rises proportionally. Analysts at Mordor Intelligence identify nickel smelting growth as a key structural driver of the 6.24% CAGR forecast.
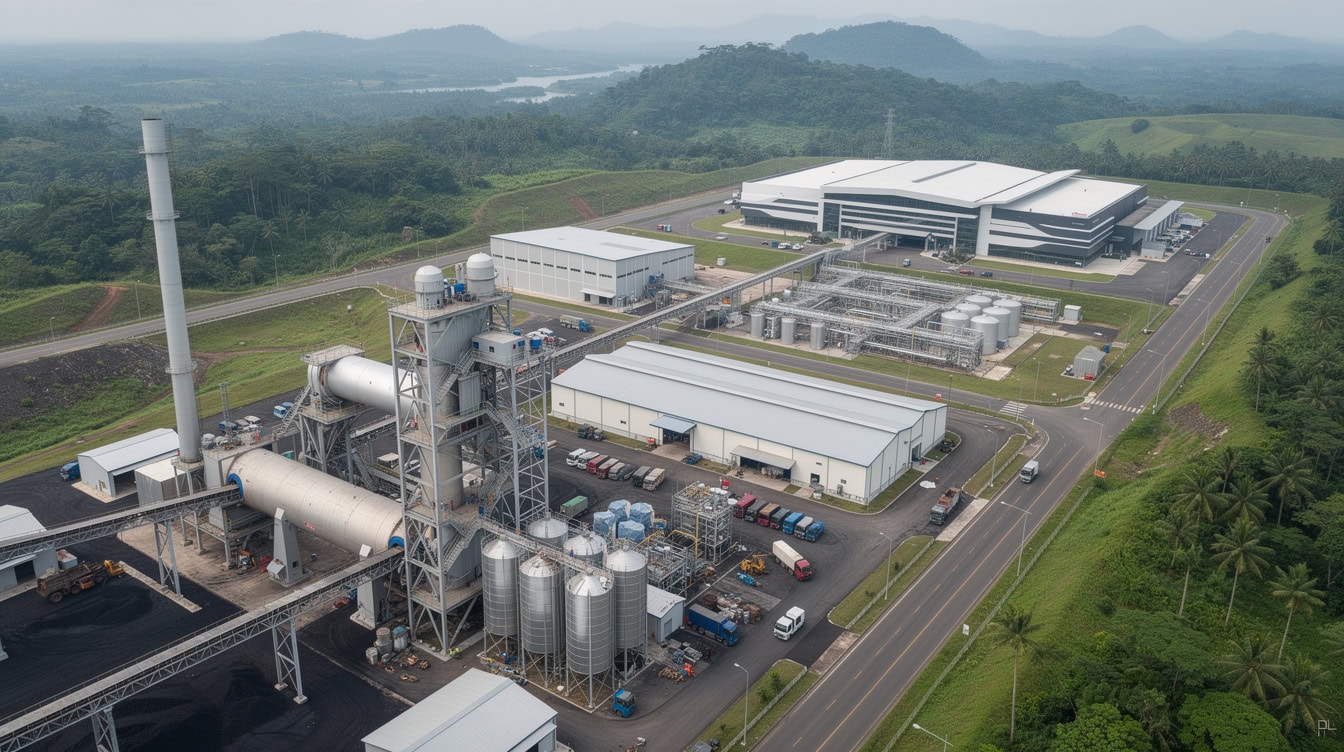
Each tonne of nickel pig iron from an Indonesian RKEF smelter consumes 0.5 to 0.7 tonnes of coal, directly linking coal demand to EV battery production growth.
Nickel and Tin: EV Battery Supply Chain Positioning
Indonesia’s nickel and tin sectors are the country’s primary claim on the global EV battery supply chain, and both commodities benefit from government policy that mandates domestic value-add before export. Nickel is the critical input for NMC (nickel manganese cobalt) and NCA (nickel cobalt aluminum) battery cathodes used in electric vehicles. Tin is essential for solder in battery management systems and electronics broadly.
Nickel: Indonesia holds the world’s largest nickel reserves, estimated by the U.S. Geological Survey at approximately 21 million metric tons (USGS Mineral Commodity Summaries) as of recent surveys. The government banned raw nickel ore exports in January 2020, forcing international battery manufacturers and stainless steel producers to invest in Indonesian processing capacity. This policy created a wave of RKEF smelter construction, primarily financed by Chinese capital, that now underpins the coal-to-nickel value chain. By 2026, Indonesia accounts for more than half of global nickel mine production according to USGS Mineral Commodity Summaries.
Tin: Indonesia is the world’s second-largest tin producer and exporter, with the Bangka-Belitung islands hosting the majority of production. The Indonesian Tin Association (AETI) reports that export volumes fluctuate with government licensing cycles, creating periodic supply squeezes that push London Metal Exchange tin prices sharply higher. Tin’s role in EV battery electronics and semiconductor packaging makes it a secondary but meaningful EV supply chain play.
The integration thesis: A nickel smelter in Sulawesi consumes coal from Kalimantan, produces nickel matte or mixed hydroxide precipitate (MHP) for export to battery precursor plants in China or South Korea, and generates foreign exchange that funds further infrastructure investment. This integration means an investor in Indonesian coal is indirectly exposed to nickel battery demand, and vice versa.
Indonesia holds the world’s largest nickel reserves and ranks second in global tin exports, giving investors dual EV battery supply chain exposure in one jurisdiction.
Economic Contribution and GDP Impact: Mining Sector Fundamentals
Mining and coal contributed approximately 5% to Indonesia’s GDP in 2022 (Bank Indonesia, Indonesia Economic Report 2022). Indonesia’s nominal GDP in 2022 was approximately $1.32 trillion (World Bank national accounts data), which places the mining sector’s absolute contribution at roughly $66 billion. Indonesia’s population reached approximately 277 million people in 2022 (World Bank, Indonesia Data), underscoring the scale of the domestic energy and industrial demand base that underpins long-run coal consumption growth.
Projecting forward: if the mining sector maintains a 5% GDP share and Indonesia’s economy grows at its historical average of 5% annually, the absolute mining GDP contribution reaches approximately $84 billion by 2031. If commodity prices remain elevated and production volumes hit the Mordor Intelligence forecast, the share could expand to 6-7%, implying $100 billion or more in sectoral output.
For investors, the GDP contribution figure matters because it signals political durability. A sector generating $66-100 billion annually and employing millions of workers directly and indirectly is not a candidate for rapid regulatory phase-out, regardless of energy transition rhetoric.
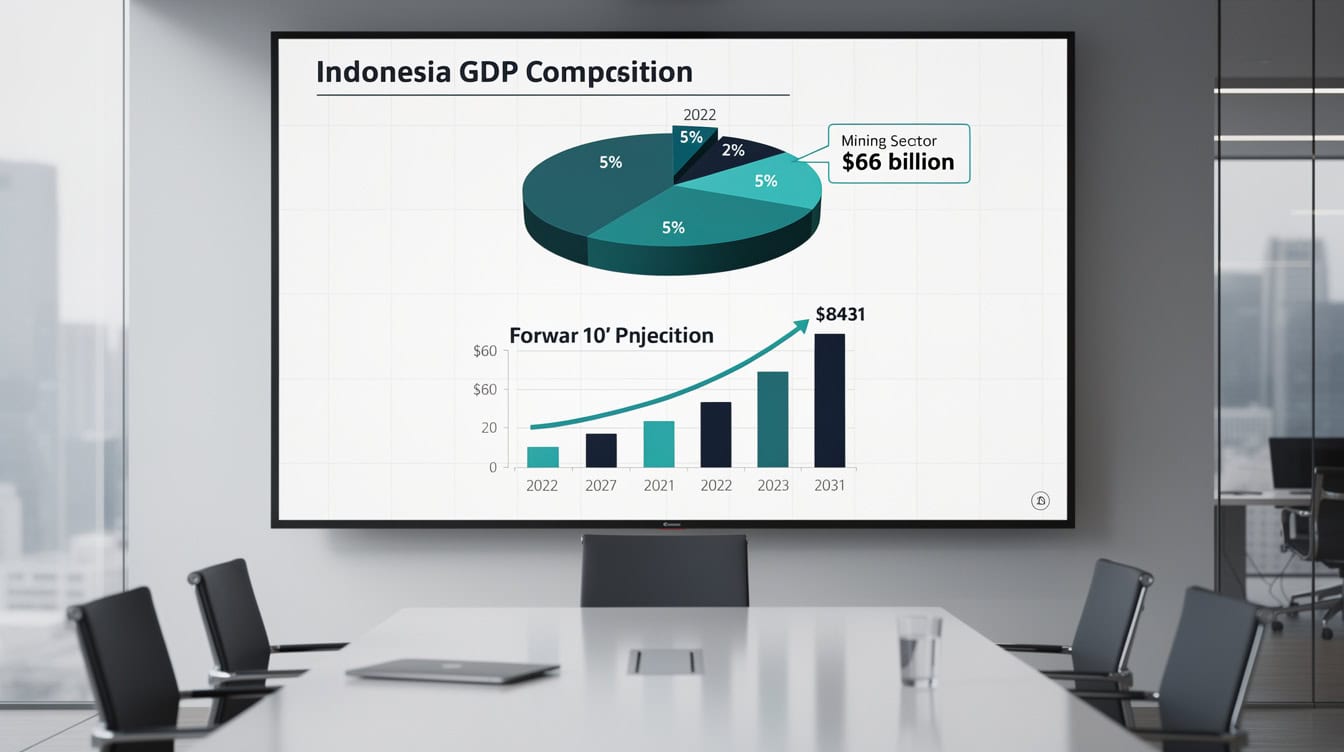
Mining’s $66 billion GDP contribution in 2022 is projected to reach $84-100 billion by 2031 as production volumes and commodity prices support sector expansion.
Regulatory Framework and Downstream Processing Mandates
Indonesia’s regulatory environment actively shapes investment returns across all three commodity segments. The core policy direction is downstream processing: the government wants raw materials converted to higher-value products inside Indonesia before export.
Nickel ore export ban (2020, tightened 2023): The ban on unprocessed nickel ore exports forced a structural shift in global nickel supply chains. Indonesia now exports nickel pig iron, ferronickel, nickel matte, and MHP rather than raw ore. Each step up the value chain improves Indonesia’s terms of trade but also increases the country’s dependence on coal for smelting energy.
Domestic Market Obligation (DMO) for coal: Producers must sell 25% of output to PLN at $70/tonne. At current export prices of $80-120/tonne, the DMO represents a direct subsidy to domestic power consumers and a cost to producers. Financial models for coal investments must account for this blended price realization.
Mining permits (IUP) and environmental compliance: The 2020 Mining Law (Law No. 3/2020) restructured permit categories and increased central government authority over mining licenses. Environmental compliance costs, including reclamation bonds and post-mining land rehabilitation, add 3-8% to operating costs depending on mine type and location.
Carbon pricing trajectory: Indonesia launched a carbon exchange in September 2023 and has signaled a carbon price mechanism for the power sector. The long-term implication for coal-fired generation is higher operating costs, but the timeline for material impact extends beyond 2031 for most existing assets.
Indonesia’s regulatory calendar from 2020 to 2031 shapes investment returns across coal, nickel, and tin through export bans, DMO pricing, and carbon market development.
Investment Analysis: Revenue Models and Return Scenarios
A credible investment case for Indonesia’s mining sector requires modeling three distinct revenue streams with different price drivers, cost structures, and regulatory overlays.
Worked Example: Coal Production Revenue (2026-2031)
Assume a mid-size coal producer with 10 million tonnes per year (Mtpa) of production capacity, a blended realized price of $90/tonne (reflecting 75% export at $105/tonne and 25% DMO at $70/tonne), and a cash cost of $45/tonne.
- Blended price: (0.75 × $105) + (0.25 × $70) = $78.75 + $17.50 = $96.25/tonne
- Wait, applying DMO correctly: (0.75 × $105) + (0.25 × $70) = $96.25/tonne blended
- Annual revenue: 10,000,000 × $96.25 = $962.5 million
- Cash operating cost: 10,000,000 × $45 = $450 million
- EBITDA: $962.5M – $450M = $512.5 million
- EBITDA margin: $512.5M / $962.5M = 53.2%
At a 5x EV/EBITDA multiple (conservative for Indonesian coal given regulatory risk), enterprise value = $512.5M × 5 = $2.56 billion.
If production scales with the market’s 6.24% CAGR to 13.4 Mtpa by 2031, and assuming flat real prices, EBITDA grows to approximately $686 million, implying an enterprise value of $3.43 billion. That represents a 34% increase in asset value over five years from volume growth alone, before any price appreciation.
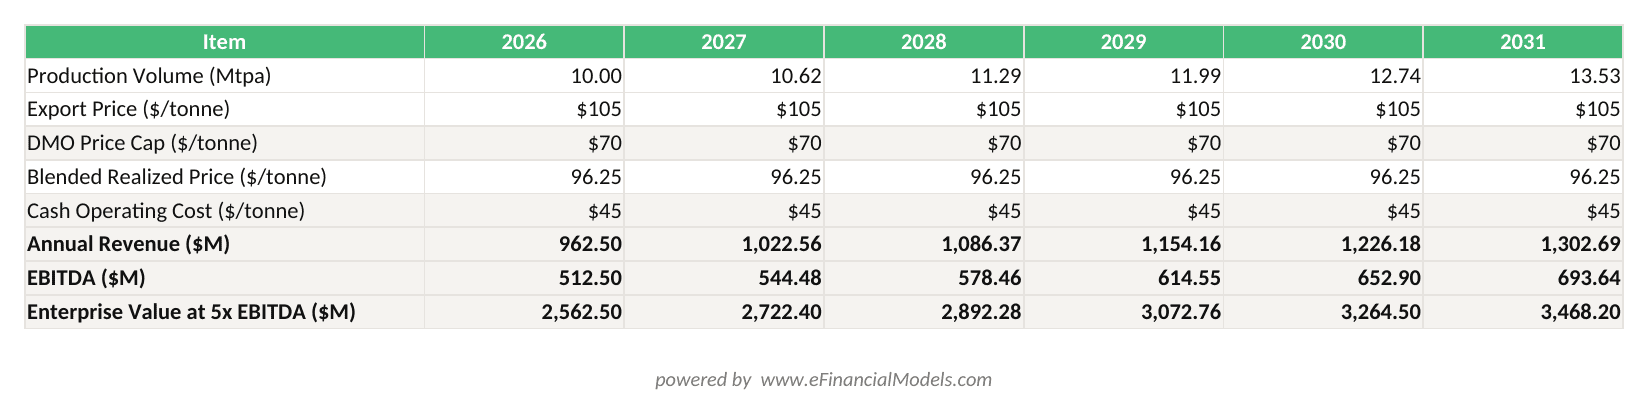
Blended price = (75% × export price) + (25% × DMO cap of $70/t). EBITDA margin of 53.2% in 2026 grows to the same margin on higher volumes by 2031, lifting enterprise value from $2.56B to $3.43B.
Nickel processing scenario: A 30,000 tonne-per-year nickel matte operation with a capital cost of $800 million and operating cost of $8,000/tonne, selling at $15,000/tonne nickel content, generates annual EBITDA of approximately $210 million. At a 6x EV/EBITDA multiple, enterprise value is $1.26 billion, implying a 1.6x equity multiple on a 60% debt-financed capital structure over a 7-year project life.
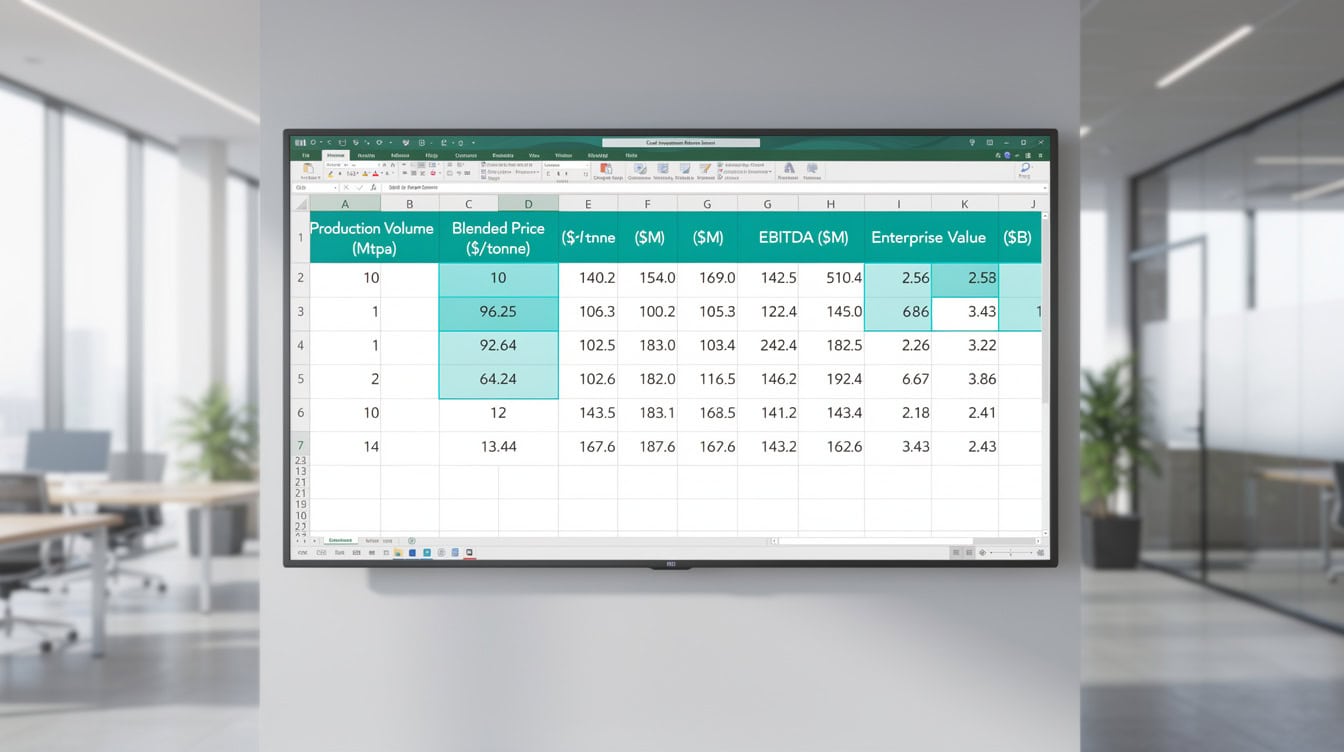
A 10 Mtpa coal producer growing at 6.24% CAGR sees enterprise value expand from $2.56 billion to $3.43 billion by 2031 from volume growth alone, before any price appreciation.
Market Risks and Volatility Factors Through 2031
Every investment thesis for Indonesia’s mining sector carries material risks that must be stress-tested in any financial model.
Energy transition pressure on coal: The IEA’s Net Zero Emissions scenario calls for no new coal mines after 2021. While Indonesia is not bound by this scenario, it signals the direction of OECD financing for coal assets. Export credit agencies and multilateral development banks have largely withdrawn from coal project financing, narrowing the capital pool to Asian commercial banks and domestic sources.
Commodity price volatility: Thermal coal prices swung from $60/tonne in 2020 to over $400/tonne in 2022 before settling in the $80-130/tonne range through 2024-2025. Nickel prices collapsed from $48,000/tonne in March 2022 to below $16,000/tonne by late 2023, driven by Indonesian supply growth. Tin prices have ranged from $17,000 to $50,000/tonne over the same period. Revenue models must include at minimum a base, bull, and bear price scenario.
Geopolitical supply chain dynamics: China’s dominance in Indonesian nickel processing creates concentration risk. If US or EU trade policy restricts battery materials processed with Chinese capital, Indonesian nickel products could face tariff barriers that reduce realized prices.
Regulatory uncertainty: The DMO price cap, export ban extensions, and evolving environmental compliance requirements all affect cost structures and revenue realizations. Investors should model a 10-15% regulatory cost buffer in base-case scenarios.
Comparison: Risk-Return Profile by Commodity
| Commodity | 2026-2031 Volume CAGR | Price Volatility (5yr range) | Regulatory Risk | EV Battery Linkage | Recommended Model Approach |
|---|---|---|---|---|---|
| Thermal Coal | 6.24% | High ($60-$400/t) | Medium (DMO, carbon pricing) | Indirect (smelter energy) | Blended price with DMO split |
| Nickel | High (supply-driven) | Very High ($16k-$48k/t) | High (export ban, processing mandates) | Direct (cathode material) | Integrated mine-to-MHP DCF |
| Tin | Moderate | High ($17k-$50k/t) | Medium (licensing cycles) | Indirect (electronics/solder) | Spot price sensitivity analysis |
Nickel carries the highest combined price and regulatory risk among Indonesia’s three key mining commodities, while thermal coal offers more predictable returns through the DMO framework.
Strategic Implications for Investors and Operators
Indonesia’s mining sector through 2031 rewards investors who understand the coal-nickel integration thesis and build financial models that capture both commodity exposures. Three strategic positions stand out.
Position 1: Integrated coal-to-nickel exposure. Owning or financing both a coal mine and a nickel smelter in the same supply chain eliminates the transfer price risk between the two assets and captures margin at both stages. This is the model Chinese conglomerates like Tsingshan have executed at scale in Sulawesi.
Position 2: Pure coal with DMO optimization. A producer that maximizes export allocation while meeting DMO requirements at minimum cost achieves the highest blended price realization. This requires active permit management and logistics optimization to Kalimantan export terminals.
Position 3: Nickel downstream processing. Investing in MHP or nickel sulfate production targets the battery-grade premium over pig iron or ferronickel. The capital cost is higher, but the offtake market is global battery manufacturers rather than Chinese steel mills, diversifying counterparty risk.
For financial modeling purposes, the Indonesia Mining Market Study 2026-2031 provides production volume forecasts, price scenario tables, and revenue build templates for all three commodities. You can also explore EFM’s broader mining industry financial models for comparable project structures.
For investors conducting feasibility work before committing capital, the EFM guide on how to prepare a financial feasibility study provides a structured methodology applicable to mining project evaluation.
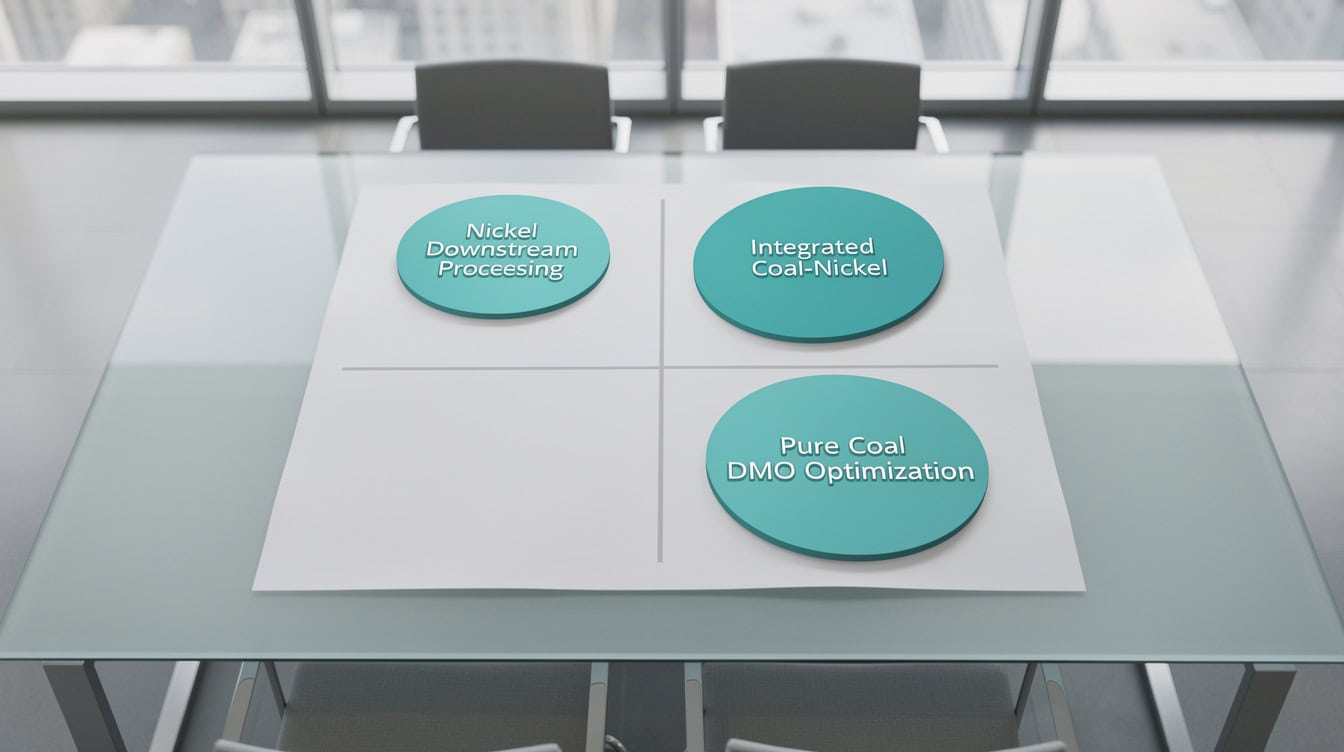
Three distinct investment strategies emerge from Indonesia’s coal-nickel integration thesis, each with different capital requirements, risk profiles, and return potential through 2031.
Frequently Asked Questions
What is the projected size of Indonesia’s coal market by 2031?
Indonesia’s coal market is forecast to reach 1,278.96 million tons by 2031, up from 950 million tons in 2026, according to Mordor Intelligence. That represents a compound annual growth rate of 6.24% over the five-year period. The absolute volume increase of approximately 329 million tons is larger than the entire annual coal output of many major producing nations. For investors, this growth trajectory implies sustained demand for mining equipment, logistics infrastructure, and export terminal capacity throughout the forecast period. The 2025-to-2026 transition alone adds 60 million tons, suggesting front-loaded demand acceleration rather than a linear ramp.
Why does Indonesia’s nickel ore export ban matter for coal investors?
The nickel ore export ban, implemented in January 2020 and tightened in 2023, forces all nickel processing to occur inside Indonesia. Each rotary kiln electric furnace (RKEF) smelter consumes roughly 0.5 to 0.7 tonnes of coal per tonne of nickel pig iron produced. As Indonesia adds smelter capacity to absorb the ore that can no longer be exported raw, domestic coal demand from the smelting sector grows proportionally. This creates a structural demand floor for coal that is independent of export market conditions. For a coal investor, nickel smelter expansion is a direct demand catalyst that supports volume and price realizations even if Asian export markets soften.
How does the Domestic Market Obligation (DMO) affect coal investment returns?
The DMO requires Indonesian coal producers to sell 25% of their annual output to PLN, the state utility, at a capped price of $70 per tonne. When export prices are at $100-120/tonne, the DMO represents a $30-50/tonne discount on one quarter of production. For a 10 Mtpa producer, that translates to a revenue haircut of approximately $75-125 million per year compared to full export pricing. Financial models must calculate a blended realized price: (0.75 × export price) + (0.25 × $70). At an export price of $105/tonne, the blended price is $96.25/tonne, not $105. Investors who ignore the DMO overstate revenue by roughly 8-10% in base-case scenarios.
What share of Indonesia’s electricity comes from coal, and will that change by 2031?
Coal accounted for 67% of Indonesia’s electricity generation in 2022, according to the International Energy Agency. Indonesia’s government has set renewable energy targets, but PLN’s capacity expansion plans through 2031 still include significant coal-fired baseload additions to meet rising electricity demand from a population of 280 million and rapid industrialization. The IEA projects that coal’s share may decline modestly to the 55-60% range by 2031 as renewables scale, but absolute coal consumption for power generation continues to rise because total electricity demand grows faster than the renewable share can offset. For coal investors, this means domestic power demand remains a reliable demand pillar through the forecast period.
How should investors model nickel price risk in an Indonesia mining investment?
Nickel prices collapsed from approximately $48,000 per tonne in March 2022 to below $16,000 per tonne by late 2023, a 67% decline driven largely by Indonesian supply growth. Any financial model for an Indonesian nickel project must include at minimum three price scenarios: a bear case at $14,000-16,000/tonne (reflecting continued Indonesian supply surplus), a base case at $18,000-22,000/tonne (reflecting moderate EV demand growth), and a bull case at $25,000-30,000/tonne (reflecting accelerated EV adoption and supply discipline). Sensitivity analysis should show the project’s IRR and equity multiple at each price point. A project that only works at $25,000/tonne nickel is not financeable by institutional investors without significant price hedging.
What is Indonesia’s global ranking in tin production, and why does it matter for EV supply chains?
Indonesia is the world’s second-largest tin producer and exporter, with production concentrated in the Bangka-Belitung islands. Tin is essential for solder used in battery management systems, printed circuit boards, and semiconductor packaging, making it a critical EV supply chain material beyond the battery cell itself. Indonesia’s export licensing system creates periodic supply squeezes that push London Metal Exchange tin prices sharply higher, as seen in 2021-2022 when prices exceeded $40,000 per tonne. For investors, tin provides a secondary EV exposure within the same Indonesian jurisdiction as nickel and coal, allowing a single-country investment thesis to capture three distinct commodity demand drivers.
Where can I find a financial model for Indonesia mining investments?
The Indonesia Mining Market Study 2026-2031 from eFinancialModels includes production volume forecasts, commodity price scenario tables, revenue build templates, and sensitivity analysis for nickel, tin, and coal across the 2026-2031 period. The study covers the EV battery supply chain integration thesis and provides the quantitative inputs needed to build a custom DCF or IRR model for specific project types. EFM’s mining financial model library also includes project-level templates for mine development, processing plant feasibility, and commodity trading operations.
Conclusion
Indonesia’s mining sector through 2031 is not a single-commodity story. It is a three-commodity integration thesis where coal powers nickel smelters, nickel smelters drive coal demand, and tin exports ride the same infrastructure. The coal market’s 6.24% CAGR from 950 million tons to 1,278.96 million tons by 2031 provides the volume foundation. The nickel ore export ban creates the value-chain integration. And the sector’s 5% GDP contribution ensures political durability for the regulatory framework that makes it all work.
I recommend downloading the Indonesia Mining Market Study 2026-2031 to access the full production forecasts, price scenario tables, and revenue models for nickel, tin, and coal. It is the most direct path to building a defensible investment case for this market.