
0 ITEMS

Peru Mining Market Study 2026-2031 — Copper, Zinc, Silver & Gold
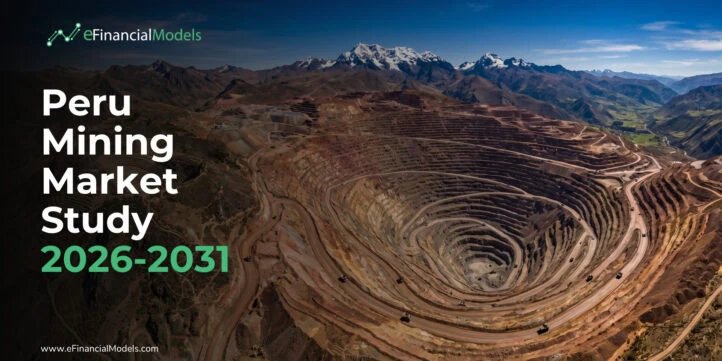
A 33-page, data-rich market study of Peru’s copper, zinc, silver, and gold mining sector for 2026-2031 — production, prices, costs, the project pipeline, tax regime, and three scenarios. Built for financial modelers and investors.
| Financial Model, Mining Industry |
| Financial Modeling, Financial Planning, Free Financial Model Templates, Market Studies, PDF |


Why this study
Peru is the world’s #3 copper producer, #2 in both silver and zinc, holder of the planet’s largest silver reserves, and a top-ten gold producer — a polymetallic powerhouse whose growth now hinges on permitting, social licence, and a knife-edge 2026 election. This study gives financial modelers and investors a complete, sourced assumption set for valuing a Peruvian copper, zinc, silver, or gold asset over 2026-2031.
What you get
- A 33-page Word/PDF study with 12 EFM-branded charts and 11 data tables.
- USGS 2026 production and reserve baselines for all four metals.
- An LME copper price outlook (2025 actual plus 2026 bank consensus and a 2026-2031 base case with scenario band) and record-regime silver and gold price decks.
- A copper cost-curve and tax-burden view: corporate income tax, the profit-based Mining Royalty, the Special Mining Tax (IEM), the Special Mining Contribution (GEM), and the 8% workers’ profit share.
- The full project pipeline — Tia Maria, Zafranal, Los Chancas, Michiquillay, Yanacocha Sulfides, Corani — against a government pipeline exceeding US$60 billion.
- Three scenarios to 2031 (Bear 25% / Base 50% / Bull 25%) with explicit copper output and price outcomes.
- Coverage of the dominant non-price risks: social conflict on the southern copper corridor, the Tia Maria permit episode, the REINFO informal-mining cliff, and the June 2026 presidential runoff.
Key findings
- Peru mined about 2.7 Mt of copper, 1.3-1.4 Mt of zinc, 3,600 t of silver, and 110 t of gold in 2025; it has slipped to #3 in copper behind Chile and DR Congo.
- Copper is a price-levered, pipeline-gated growth story — reserves are ample; permitting and social licence are the constraint.
- By-product silver, gold, and molybdenum credits — at record precious-metal prices — materially lower effective copper and zinc cash costs and are central to asset economics.
- Policy and politics, not commodity demand, are the variables most likely to separate the bear from the bull case at 2031.
Who it is for
Financial modelers and project-finance analysts (primary); mining investors and developers; corporate strategy and offtake teams; and students of the sector.
Methodology and sources
Built from USGS Mineral Commodity Summaries 2026, MINEM, the IEA, the Silver Institute, the World Gold Council, Goldman Sachs and J.P. Morgan, EY, and company filings. eFinancialModels uses AI-assisted research and drafting tools alongside human research, source verification, and editorial review; every claim, statistic, source, chart, and recommendation was reviewed and verified before publication. Forward-looking statements are labeled and reflect analyst judgment.
Pair it with a template
Translate the findings into project-level cash flows with the mining financial model templates at eFinancialModels.com: https://www.efinancialmodels.com/downloads/category/financial-model/mining/
This study is for informational and educational purposes only and is not investment, financial, legal, or tax advice. Conduct your own due diligence.
Similar ProductsOther customers were also interested in...



 eFinancialModels
Electric Vehicle (EV) Charging Station Financial M...
With this comprehensive 5- or 10-year monthly tool, investors can assess the viability of setting up... Read more

Financial Model for Mobile App | Mobile App Busine...
The Mobile App Financial Plan Template in Excel allows you to develop financial projections when lau... Read more

 HenrySheykin
Food Truck Financial Model Excel Template
The Food Truck Financial Model helps entrepreneurs, founders, business owners, consultants, and anal... Read more

Green Hydrogen Production from Wind Energy Financi...
The Green Hydrogen from Wind Financial Model aims to comprehensively forecast a horizon of 40 years ... Read more

Simple Mutual Non-Disclosure Agreement Template
Protect your business secrets with ease using our Simple Mutual Non-Disclosure Agreement Template. S... Read more

Solar Energy Financial Model
The Solar Energy Financial Model Spreadsheet Template in Excel assists you in preparing a sophistica... Read more

 Peter Graf
The Customer-Centric Financial Model for Restauran...
Starting a restaurant without a financial plan is like driving a car blindfolded. You wouldn´t do i... Read more
You must log in to submit a review.