
0 ITEMS

How to Evaluate a New Solar Park for Investment?

Investing in solar energy projects can offer steady long-term returns, but careful financial analysis is essential to assess profitability.
- The lifetime of a solar park depends on factors like degradation rates, permits, and manufacturer guarantees.
- Capital expenditures for a utility-scale solar farm typically range from $610 to $900 per kW, varying by location and technology.
- Forecasting electricity production involves estimating installed capacity, solar yield, and accounting for annual efficiency declines.
- Power purchase agreements (PPAs) provide predictable revenue streams and are critical for securing financing.
- Financial metrics like IRR, NPV, and ROI help evaluate if a solar project will generate sufficient returns relative to risks.
Understanding these core elements can help determine whether a solar investment aligns with your financial goals.























Are Solar Panels a Good Investment?
Before investing in a solar power plant, you will need extensive technical, commercial, and financial due diligence. It should result in an analysis of the expected financial projections of a Photovoltaic (PV) project. Like any new venture, your solar park investment proposal must validate its financial viability.
Financial viability in this context means that a solar park can service its debt as per standard applicable lending requirements expected from lenders and generate sufficient returns to compensate investors for the project risk. The question is if the solar power plant can generate adequate returns to pay for the risk and motivate capital providers to commit the funding sources. The basis for this analysis typically is comprehensive and detailed financial projections, including:
- Income Statement
- Balance Sheet
- Cash Flow Statement
- Free Cash Flow Forecast
- Projected Financial Ratios
- Financial Metrics of the Project
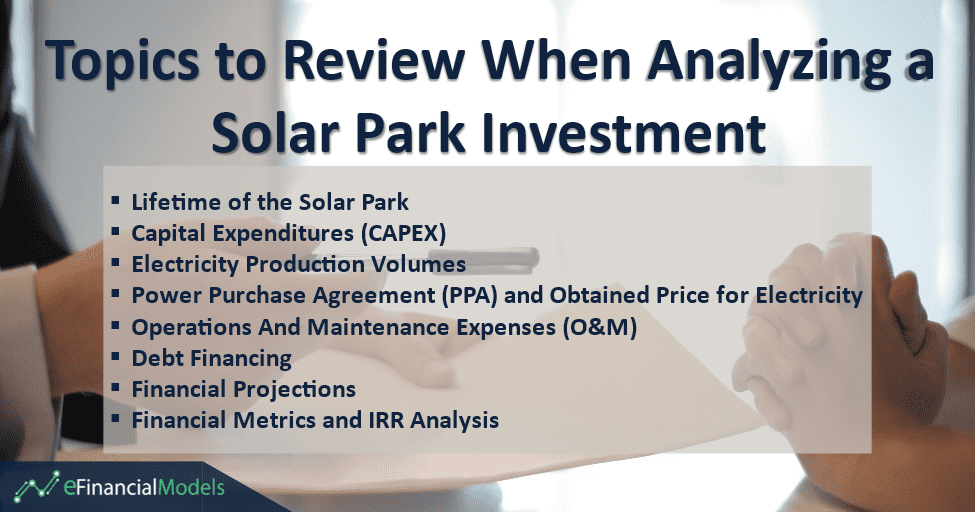
When it comes to profitability, the financial analysis will need to look into detail into the following topics:
- Lifetime of the Solar Park
- Capital Expenditures (CAPEX)
- Electricity Production Volumes
- Power Purchase Agreement (PPA) And Obtained Price for Electricity
- Operations And Maintenance Expenses (O&M)
- Debt Financing
- Financial Projections
- Financial Metrics and IRR Analysis
Let us review each topic in detail to understand what we need to do and the pitfalls for each one.
Part 1 – Assumptions You Need to Know

Check the Expected Lifetime of Your Solar Park
There are four ways to look at how long solar panels last:
- Expected Productive Lifetime: This is the actual lifetime of a solar park until the end of profitable electricity production. Based on the National Renewable Energy Laboratory (NREL) studies on how solar panel works, every system had an average degradation rate of roughly 0.5% per year.
- Generation License: This is the permitted duration of electricity production per the received permit; an example is from the Ministry of Energy. Typical lifetimes of generation license range between 25 to 35 years. It’s important to know if the generation license is renewable or not. In most cases, the generation license should be renewable. However, we will exclude the renewal period from our financial projections for planning purposes. So, in most cases, the duration of the generation license will determine the length of our forecast period.
- Guaranteed Panel Lifetime: This is the guaranteed lifetime of the solar panels by its manufacturer. A guarantee will only be valid if the solar panels are only manipulated as permitted by the contract terms. In most cases, it might not be possible to get a full guarantee of the solar panels from the manufacturer. But sometimes, you can get insurance to protect the solar panels against such risks.
- Commercial Lifetime: A Power Purchase Agreement (PPA) will define the duration of the off-take of the produced electricity, typically via sale to an electricity distribution company for a utility-scale solar park. The length of such PPAs varies from agreement to agreement, typically 15 to 25 years. The commercial lifetime, therefore, guarantees an agreed price over this period. Once the end of the PPA has been reached, the solar park will have to sell its electricity at market prices or enter into a new agreement with an electricity distribution company.
To conclude, for financial planning purposes, the PPA’s length and the generation license’s duration will be essential to define our financial forecast period length.

Define the Required Investment by Knowing Your Capital Expenditures
Capital Expenditures (CAPEX) is a list of costs that need to be incurred to secure a site for the solar power plant, prepare the land for building, transport, equip and install the solar panels, inverters, and other equipment needed, and connect the park to the electricity grid. A list of CAPEX items for a solar park typically looks like this:
- Planning Costs – Civil & Structural Design
- Permitting Costs
- Land Costs
- Land Preparation
- Fixtures for the Panels
- Solar Panels
- Inverters
- Substation and Connection Point Equipment
- Battery (In Some Cases)
- Transport Costs
- Installation Costs
- Construction Costs for Electricity Lines
- VAT

Statista states that the initial costs of building solar power plants have significantly decreased since 2010. As of 2020, the CAPEX for utility-scale solar PV park is around $610 per kW per installed capacity. However, the actual cost still varies from site to site as costs for transport and land vary per location. Also, there are many different original equipment manufacturers (OEMs) for solar panels.
Furthermore, their panels can be installed statically or with trackers that adjust the angle of the way the panels are directed towards the sun to maximize the capture of sunlight. These changes will impact the reasonable costs, and realistically the park can cost anything between USD 610,000 per Megawatt peak (MWp) to USD 900,000 per MWp.
Please note the CAPEX will result in Fixed Assets activated on the Balance Sheet. As such, the CAPEX costs will need to be depreciated as per the permitted accounting rules, which typically should result in a depreciation period over the useful life of the solar park.
Forecast the Electricity Production Volumes of Your Solar Park
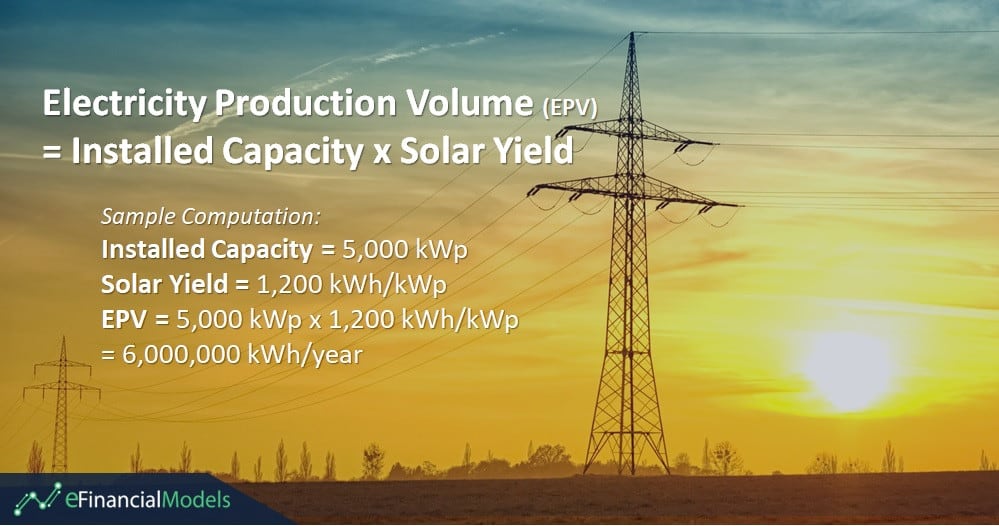
The electricity production volume of a solar park is defined by two factors which, when multiplied together, result in the forecasted electricity production.
Installed Capacity
Installed capacity is the measured generation capacity of a solar park. It is otherwise called peak installed capacity or rated capacity. Technically it is the size of the solar system in kilowatt peak kWp.
Under standard laboratory conditions equating to bright sunshine, installed capacity is how much energy a solar panel produce. Most solar farms have installed capacities ranging from 1 megawatts to 800 megawatts.
Solar Yield
Solar yield is the amount of sunlight solar power plants receive per year. Across the globe, the amount of sunshine varies heavily. For commercial solar energy production, locations produce solar yields between 1,200 MWh/MWp to 2,000 MWh/MWp.
Solar yield depends on the solar radiation a specific location may receive but is also heavily affected by the quality and state of the solar panels. Factors like dirt, heat, and shade can impact the yield of the park. An easy way to determine the solar yield of a specific location is by checking the Global Solar Atlas map.
Besides, the angle of your solar panels determines the amount of energy they absorb from the sun. E.g., when we install a solar park of 10 MWp and have a yield of 1500 MWh/MWp, the annual electricity production will result in 15,000 MWh per year.
Please note that the installed capacity gradually decreases year by year. It is called the adjusted capacity, which typically diminishes by 5.0% annually. So, you will need to consider an annual yield degression of 0.5% every year. It means that over time the solar park produces less electricity than at the beginning.
Negotiate a Good Power Purchase Agreement (PPA) and Price for Electricity
So, you now have an estimated CAPEX and forecasted electricity production volumes for your solar farm investment. Next, you should work on a power purchase agreement or PPA.
A Power Purchase Agreement (PPA) is a legal agreement between a solar energy producer and a significant commercial buyer or electricity distributor. The solar energy producer is otherwise called the developer or investor, while the buyer is often called the off-taker.
The off-taker in a PPA typically agrees to buy electricity from the solar producer within 18 to 25 years at a cost typically lower than traditional utility costs. Most PPA-obtained prices for electricity are between USD Cents 3.5/kWh to USD Cents 7.0/kWh.
PPA is a prerequisite to getting financing for your solar park. They guarantee a solar farm investment return as protection over the risk of being unable to sell produced electricity. A higher obtained price for electricity and a longer contract duration makes a PPA more appealing to investors, lenders, and solar finance companies.
Set Up the Operations and Maintenance Expenses (O&M) of Your Solar Park
Operations and maintenance (O & M) expenses must be established to evaluate the business case for a solar park.
Operating expenses include fixed and variable costs in running a solar park. These may include land rental and security costs preventing access to unauthorized persons to avoid damaging the panels. You may also need to hire people to grass and weed the ground regularly.
Solar panels do not require much maintenance. Because it does not require fuel, it has no variable costs. Hence, the operating cost of a solar park is very minimal. Yet, it is critical to ensure electricity output is at optimal levels. As such, there is a need to clean the solar panels twice a month.
The most crucial maintenance step if you invest in solar farms is an annual inspection and preventive care. All that is required is a routine inspection if your inverter is operating correctly (i.e., there are no red blinking lights) and the energy meter is rising daily. They can significantly reduce the cost of solar panel repairs and replacement.
A ballpark estimate of the annual maintenance cost for a solar park is 1% of the CAPEX. For example, if your CAPEX for a 1-MW solar farm is around $600,000, the OPEX will most likely be $6,000 per annum.
Visualize Debt Financing in Different Scenarios
Financing PV solar stations comprise two parts: equity and debt.
An equity investment model offers a greater return on investment (ROI) by avoiding third-party financing costs. However, it means assuming all the risks in building and maintaining the solar park.
Unlike equity investment, where shareholders receive stock certificates, lenders and solar finance companies purchase bills, bonds, or notes in debt financing. In exchange, the investment loan or the principal must be paid within the agreed time. If the solar farm fails to profit, these lenders and solar finance companies have higher claims on the liquidated assets than the shareholders.
A solar park can significantly benefit from long-term loans with a fixed interest rate. It allows the project to build a reserve fund and generate income during the first years. By leveraging funds to much more significant sums, it enables rapid growth. Additionally, debt payments are typically tax-deductible.
The Need for a Debt Schedule
Under standard terms, a typical target when building a new solar park project is an 80/20 debt-equity model. But the question is, how much debt financing can your solar park get?
A debt schedule enables you to track and visualize your debts. It can be an instrument to help you negotiate a higher line of credit at lower interest rates with lenders. By analyzing cash flows and plan payments, the debt schedule also allows you to grow your solar farming investment in the long run.
Furthermore, a debt schedule ties three financial statements together.
- The ending balance flows onto the balance sheet.
- The principal repayments flow in the cash flow statement.
- The interest expenses flow into the income statement.
As such, it can benefit financial planning, investment decision-making, and wealth management.
Debt Schedule Model Template

The easiest way to visualize your debt schedule in different scenarios is through a debt schedule model. It is a dynamic excel template that can handle complicated debt situations, including amortizations up to 30 years, fixed interest rates, and monthly or annual repayments.
All you need is to input the debt assumptions, such as the loan amount, terms of payment, and interest rate. After inputting the assumptions in the summary or assumption sheets, the template auto-calculates the total payment, interest payment, and principal payment in the debt schedule until the balance gets zeroed out.

The above example shows that the solar park obtained two loans from two different lenders. The loan amounts are a percentage of the CAPEX amounting to $4,000,000. With portions of 50 and 20, respectively, Loan A has a principal amount of $2,000,000 with an interest rate of 1.5%, and Loan B has a principal amount of $800,000 with an interest rate of 3%. Both loans are payable for a term of 20 years.
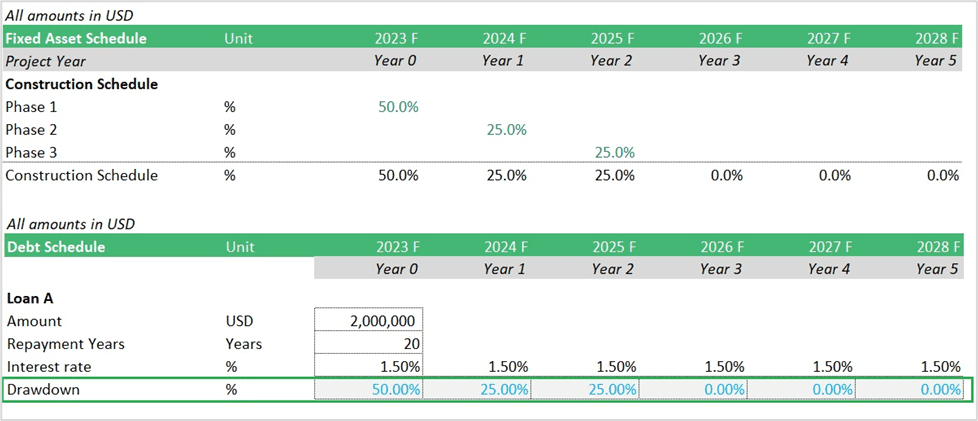
The drawdown of debt is suggested to be availed in three phases based on the construction schedule of the solar park:
- Phase 1: 50%
- Phase 2: 25%
- Phase 3: 25%
But users can still change the drawdown schedule based on their need for debt financing.
Debt repayment usually starts after the drawdown of the debt has been completed. In the illustration, repayment begins in Year 3. Users also have the option to decide on the repayment percentage each year as long as the debt is paid on or before the loan term ends.
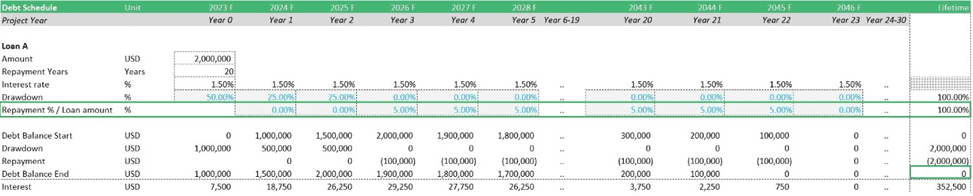
A debt schedule model template can help you monitor your financial obligations while operating the solar farm. In a larger context, it can give you a better picture of the financial health of your project.
Part 2 – Conduct a Financial Analysis of Your Solar Project

Model Your Financial Projections
Financial projections can show if your new solar park project is worthwhile. They can assess when you expect the solar park to become profitable, plan your startup budget, and set benchmarks for achieving financial goals. At the same time, they can help convince investors and lenders of the solar farm’s growth potential.
Financial projections forecast your company’s future revenue and expenditures using actual or estimated financial data. They frequently incorporate various scenarios to show how adjustments to one area of your finances (like increased sales or decreased operating costs) impact your profitability.
The following financial assumptions typically complete a financial projection for a solar park:
- CAPEX
- Forecast Electricity Volumes
- Power Purchase Agreement (PPA) and Obtained Price for Electricity
- O & M
- Debt Financing
Furthermore, three financial statements under financial projections accurately show the financial condition and profitability of a solar park project:
- Income Statement
- Balance Sheet
- Cash Flows
Income Statement
The income statement lists associated expenses and revenues earned by a solar park. Others call it the profit and loss statement, as it shows the net income during a specific period. Hence, it tells if the operating performance of a PV station is good or bad.
Balance Sheet
The balance sheet reveals how much a new solar park project is worth in terms of book value. It displays a company’s capitalization structure and liquidity ratios. Also called the financial position statement, it follows the basic accounting format: Assets = Liabilities + Equities. A strong balance sheet with income-generating assets and positive cash flow is equivalent to a solid solar park investment.
Cash Flows
The cash flow statement displays cash transaction activity and shows a company’s overall liquidity. It summarizes the available cash and reports all cash inflows and outflows throughout an accounting period. It answers how solar panels can make you money, where they came from, and where they went.
The benefits of a cash flow statement match the drawbacks of an income statement, more notably, the notion of profit. Investors and lenders favor companies with low expenses when comparing companies based on profit because they want to get the most out of the company’s reported net income.
Financial analysts, entrepreneurs, CFOs, and CEOs typically use financial projections templates to save time, effort, and resources. They help them acquire accurate financial projections and better concentrate on other critical business issues.
Run IRR Analysis and Other Key Financial Metrics
Lenders and investors commonly rely on financial metrics to determine a business’s economic viability and profitability. It is best to calculate the following to answer the question: are solar panels worth it? To answer this question, you will need to understand key financial metrics to evaluate if investing in a proposed photovoltaic park is worth your while. Among the most common financial key metrics you might consider using are the following ones:
- Internal Rate of Return (IRR)
- Payback Analysis
- Net Present Value (NPV)
- Return On Investment (ROI)
Furthermore, understanding these financial key metrics can help you assess the solar park’s performance and make better investment decisions.
Internal Rate of Return
Similar to WACC or discount rate, the Internal Rate of Return (IRR) is based on forecasted free cash flows. IRR is the discount rate that results in a zero NPV in a Discounted Cash Flow (DCF) valuation model. Manually calculating IRR is an iterative trial-and-error and time-consuming process which can best be done using an Excel model. That is why many entrepreneurs, financial analysts, investors, and lenders use an IRR Excel template.
Please note that IRR does not show an absolute amount. Instead, it shows the percentage return of an expected investment. This makes it easy to compare the expected returns of a solar park project to the expected returns of alternatives such as wind parks or returns at the stock market. In general, a higher IRR is equivalent to a more profitable investment. If the IRR of a solar park is lower than the WACC, it is not a worthwhile investment.
IRR is the most popular method of evaluating the financial attractiveness of a new solar park investment. A positive or negative IRR shows if the project will make or lose money respectively. IRR makes it easier to see an investment’s attractiveness based on stock market returns. Besides, it is easy to manipulate to show strong rates of returns among potential investors and lenders.
Payback Analysis
The payback period is the number of years it will take to repay the initial investment based on the cash flow of a solar park. Hence, payback analysis is an initial financial feasibility measure. It will show if the solar park has sufficient cash flow and income to meet debt obligations and sustain the operation in the long run.
Calculating the payback period if a project has an even cash flow is easy. Divide the initial investment by the expected annual cash flow. For example, if your initial investment is $1,000,000 and your expected yearly cash flow is $100,000, your payback period is $1,000,000/$100,000 = 10 years.
If your PV park has uneven cash flows, you can calculate the payback period by subtracting the cash flows from the initial investment until the initial investment is covered. Alternatively, you can use a payback period calculator for more straightforward computation.
Net Present Value
Net Present Value (NPV) is the discounted value of all future free cash flows during the entire life of an investment. Positive or negative, it will help you understand if the solar project can sustain itself in the long run. That is because it quantifies the exact value of an investment in numbers. You can check this article to find out how to calculate NPV in general.
For a solar park project, we can forecast the annual unlevered free cash flows of the park (excluding debt financing) as follows (simplified)
- Revenues = Electricity production x PPA price
- – Operations & Maintenance Costs
- – Taxes
- +/- Changes in Net Working Capital
- – CAPEX
- = Free Cash Flows
Now we need to calculate annual Free Cash Flows over the whole lifetime of the park and discount them using the Weighted average cost of capital (WACC) as the discount rate. The higher the implied risk of a PV park project (e.g., in case it is situated in a country with high inflation and political risk), the higher the discount rate will be.
Theoretically, an NPV greater means that a project creates more value than is justified by its risk. This would mean it’s a good investment. Such a positive value indicates that future free cash flows discounted into present value exceed the required returns of an investment. Hence, a positive NPV is worth investing in for a solar park, but a negative NPV should be avoided.
Return On Investment (ROI)
ROI is the profit of a project over its investment cost. It is effortless to compute it using the formula: ROI = Profit / Cost of the investment x 100. For example, the initial investment of a solar park might be $1,000,000, and the annual profits without debt financing might be $100,000. Ergo, the annual ROI would be $100,000 / $1,000,000 = 10.0%.
Because it is one of the easiest computations to execute and comprehend, an ROI analysis is helpful when you look at a long-term buy-and-hold scenario. Such analysis is especially beneficial when discussing a long-term investment horizon and our forecast assumptions, such as the PPA price and annual operating costs, based on substantiated and solid estimates.

Overall, a payback analysis only focuses on the period until you can repay an initial investment but does not state how much excess profit can be obtained. NPV is the discounted cash flow during the entire life of an investment. ROI tells you how much the annual returns of an investment will be but is not impacted by the time value of money (it does not make any difference if cash flows can be obtained earlier than later).
IRR is the fundamental metric of interest for a solar park investment as it gives you the estimated return of your PV project, which can easily be compared to the returns of alternative investment opportunities.
Summary
Is the investment in solar panels a good investment? Financial analysis and due diligence can answer the question if investing in a photovoltaic project is a good idea or not by comparing the expected returns with the risk of the project. Even though there is great potential to earn in a solar farm, you must assess and balance many factors. These include the electricity production volume and the lifetime of the solar park, CAPEX, debt financing, O&M, and PPA.
In addition, you will also need to undergo iterative trial-and-error IRR calculations combined with other financial metrics and projections. The general rule of thumb is to have an attractive IRR to convince capital providers, investors, and lenders that your solar park can generate sufficient returns. At the same time, it will help you make a rational decision about whether the investment is worthwhile.
A solar energy financial model template can help you with the financial analysis of a solar park project. It can help you quickly calculate relevant financial ratios required by banks, investors, and lenders. Furthermore, it is a flexible tool for running different assumptions, scenarios, and sensitivity analyses.
You might also like:
- How Does Solar Radiation Affect the Returns of Your Solar Park?
- 10 Main Elements of a Business Plan
- Financial Modeling for Startups and Small Businesses
- 10 Tips to Develop a First Class Business Valuation Report
- Financial Modeling using Excel
- A Step-By-Step Guide to the Merger and Acquisition Process
- Business Valuation
- Renewable Energy
- 10 Funding Sources for Businesses and Startups
- Understanding the Levelized Cost of Energy Formula
- 10 Best Practices in Financial Modeling
- Financial Planning Retirement Tips
- How to Optimize the Average Selling Price: Strategies for Higher Profits
- All About Financial Modeling for Project Finance
- Financial Statements – Definition, Uses, Contents and Templates
- How to Build a Capitalization Table
- Financial Applications of Excel in Business Planning
- Financial Model Templates Easy to Use
- Financial Ratios Analysis and Its Importance