
0 ITEMS

Roofing Service Financial Model Excel Template
The Roofing Service Financial Model Template helps contractors, founders, consultants, and business planners turn a roofing service concept into a structured financial forecast. Instead of relying on disconnected estimates or a spreadsheet built from scratch, users can work from a ready-to-use model designed around the economics of roofing operations, including customer acquisition, job volume, service mix, labor, materials, equipment, overhead, and cash flow timing. It supports practical financial planning for new roof installation, roof repair services, proactive maintenance, and related revenue opportunities. This template is useful for entrepreneurs launching a roofing company, established roofing businesses planning expansion, analysts preparing forecasts, and consultants building business plans or funding documents for clients. It gives users a clear framework for entering revenue assumptions, startup costs, operating expenses, payroll, capital expenditures, and working capital needs, then reviewing how those assumptions flow into profitability, cash flow, and long-term performance. The model is fully editable, allowing users to replace the pre-filled assumptions with their own pricing, customer volumes, cost structure, staffing plan, and growth strategy. Built for business planning and decision-making, the Roofing Service Financial Model Template helps users evaluate whether the business can generate enough revenue to cover direct job costs, recurring overhead, crew payroll, marketing spend, and administrative expenses. It also helps identify when the business may reach break-even, how cash balances may move over time, and which assumptions have the greatest effect on financial outcomes. This makes it a practical tool for reviewing strategy before committing to vehicles, tools, hiring, advertising, or investor conversations. The template is designed to be presentation-ready for lenders, investors, partners, and internal stakeholders. It includes organized financial outputs, dashboards, charts, scenario analysis, profitability metrics, and performance indicators that help communicate the business case clearly. Whether you are preparing a startup plan, seeking funding, comparing growth scenarios, or managing an existing roofing service, this financial model provides a structured way to forecast results, test assumptions, and make more informed financial decisions.


Financial Model Overview
The Roofing Service Financial Model Template gives entrepreneurs, roofing contractors, consultants, and business planners a structured way to forecast the financial performance of a roofing service business. It is built around the core drivers of a roofing operation, including customer acquisition, service mix, billable work, materials, crew labor, vehicles, tools, payroll, overhead, cash flow, and investor-facing financial outputs.
Instead of starting from a blank spreadsheet, users can work from an organized, editable model that connects assumptions to financial statements, charts, key performance indicators, and decision-ready outputs. This makes it useful for launching a new roofing company, expanding an existing contractor business, preparing funding materials, evaluating profitability, or reviewing whether a service model can support sustainable growth over a multi-year planning period.
All-in-One Dashboard
The all-in-one dashboard brings the most important inputs and outputs into one central planning view, helping users quickly understand the financial position of the roofing business without searching across multiple worksheets. It may include key assumptions such as starting period, customer acquisition cost, marketing spend, average job values, pricing, service volume, material cost percentages, labor cost assumptions, overhead, capital investment, and financing inputs. As these assumptions are updated, the dashboard helps summarize outputs such as revenue, gross profit, EBITDA, net profit, cash balance, return metrics, and other business indicators.
For a roofing service, this is especially useful because operational decisions are highly connected: a change in crew capacity, hourly rate, job mix, or materials cost can quickly affect margins and cash flow. The dashboard gives founders and managers a practical control center for reviewing the model, explaining the forecast to stakeholders, and identifying whether the business plan is financially balanced before making major commitments.
Low Base High Scenario Analysis
The low, base, and high scenario analysis component allows users to test how the roofing service may perform under different market and operating conditions. The model can use alternative assumptions for variables such as hourly billing rates, customer acquisition cost, marketing spend, job volume, service mix, material pricing, crew labor, overhead, and growth rates. A low scenario may reflect slower lead generation, higher costs, or lower pricing pressure, while a high scenario may reflect stronger demand, better conversion rates, improved margins, or more efficient crew utilization. The base scenario can represent the expected operating plan.
This section is valuable because roofing businesses often face seasonality, weather-related delays, competitive pricing, labor availability constraints, and fluctuations in materials costs. By comparing multiple scenarios, users can stress-test revenue, margins, cash flow, payback period, and funding needs. It also supports investor and lender conversations because stakeholders can see that the business plan has been evaluated beyond a single optimistic forecast.
Professional Charts
The professional charts component transforms the financial model’s projections into clear visual outputs that are easier to review, present, and discuss. These charts may display revenue growth, expense trends, gross margin, EBITDA, net profit, cash balance, payback timing, service revenue mix, and other important financial indicators over the forecast period. For a roofing service business, visual reporting is useful because it helps explain how operational assumptions translate into financial performance over time.
For example, charts can show how new roof installation revenue compares with repair and maintenance revenue, how cash builds after the initial investment period, or how profitability improves as fixed overhead is spread across a larger volume of work. These presentation-ready visuals are helpful for pitch decks, lender meetings, internal planning sessions, partner discussions, and business plan documents. They reduce the need to manually create separate graphs and help users communicate the financial story of the roofing business in a polished, professional format.
ROE Components and DuPont Analysis
The ROE components and DuPont analysis section helps users break down return on equity into the underlying drivers that influence investor returns and business efficiency. Rather than viewing return on equity as a single result, this component can show how profitability, asset utilization, and financial leverage contribute to the overall return profile of the roofing service. Inputs may include net income, equity investment, total assets, revenue, margins, debt levels, and capital requirements. Outputs can help users understand whether returns are being driven by strong margins, efficient use of assets such as vehicles and equipment, or financing structure.
For a roofing service business, this type of analysis is useful because the company may require meaningful upfront investment in trucks, vans, specialized tools, equipment, office setup, and working capital. Investors and founders can use the section to evaluate whether the business is generating an acceptable return from the capital deployed. It also helps identify whether improving margins, increasing job volume, optimizing asset use, or adjusting financing could improve overall financial performance.
Revenue Inputs
The revenue inputs section is where users define the commercial assumptions that drive the roofing service forecast. It may include marketing spend, customer acquisition cost, number of new customers, conversion rates, service categories, billable hours, hourly rates, average job size, repeat work, maintenance contracts, and pricing growth. For a roofing service, revenue is usually driven by a mix of high-value new roof installations, recurring or repeat repair jobs, and proactive maintenance services.
The template helps users organize these assumptions in a structured way so that revenue is not simply entered as a single top-line guess. Instead, the forecast can be built from practical operating drivers, such as the number of jobs secured, the average time required per job, and the price charged per service. This makes the revenue forecast more credible for business plans, funding documents, and internal decision-making. It also allows users to test how changes in marketing efficiency, pricing, service mix, or customer demand affect sales performance and long-term growth.
Bank-Ready Reports
The bank-ready reports component provides lender-friendly financial outputs that help users present the roofing business in a clear and organized format. These reports may include projected profit and loss statements, cash flow forecasts, balance sheet summaries, debt service analysis, funding requirements, profitability summaries, and key assumptions.
For a roofing service seeking a loan, line of credit, equipment financing, or working capital facility, lenders need to understand how revenue will be generated, how expenses will be controlled, whether the business can maintain liquidity, and whether it can support repayment obligations.
The bank-ready report section helps organize these financial outputs so users can present a more professional funding case. It is also useful for internal planning because it shows how operating performance connects with cash availability and financing needs. By using a structured reporting format, founders and business owners can reduce the risk of presenting incomplete or inconsistent numbers and can focus lender discussions on the assumptions and financial outcomes that matter most.
Revenue Breakdown
The revenue breakdown component provides a detailed view of how total sales are generated across the roofing service’s different revenue streams. Instead of showing only total revenue, this section can separate income from new roof installations, roof repair services, proactive maintenance, and any other service lines the user chooses to include. Inputs may include the number of customers, jobs per customer, billable hours, average hourly rate, average project value, service utilization, and growth assumptions for each revenue stream.
Outputs can show monthly and annual revenue by category, revenue mix percentages, and the contribution of each service line to total sales. This is particularly useful in roofing because different services have different margins, scheduling requirements, labor needs, and cash flow patterns. New roof installations may create larger project revenue, repairs may offer quicker turnaround and attractive margins, and maintenance plans may provide recurring income. A clear revenue breakdown helps users decide where to focus marketing, staffing, and operational resources while building a more realistic forecast.
KPI Dashboard
The KPI dashboard tracks key performance indicators that help users monitor the health and efficiency of the roofing service business. These metrics may include revenue growth, gross margin, EBITDA margin, net profit margin, customer acquisition cost, payback period, cash runway, average revenue per customer, service mix, labor cost ratio, materials cost ratio, return on equity, and other financial benchmarks. The purpose of this section is to translate detailed financial projections into practical management indicators that can be reviewed at a glance.
For a roofing company, KPIs are important because profitability depends on both sales performance and operational execution. A business can generate strong revenue but still struggle if materials costs rise, crews are underutilized, jobs are mispriced, or customer acquisition becomes too expensive. The KPI dashboard helps users identify these issues earlier and compare projected performance against internal goals or industry benchmarks. It is useful for monthly review meetings, investor updates, management reporting, and ongoing decision-making after the original business plan has been prepared.
Startup Cost Breakdown
The startup cost breakdown section organizes the initial investment required to launch or prepare the roofing service for operations. It may include work vehicles such as trucks or vans, specialized roofing tools and equipment, office setup, technology, licensing, insurance deposits, initial marketing, website development, software, safety equipment, legal and accounting costs, and working capital reserves. The section helps users distinguish one-time startup costs from ongoing operating expenses, which is important for understanding how much funding is needed before the business begins generating reliable revenue.
For a roofing service, startup capital planning is especially important because the business may need significant upfront assets to deliver jobs professionally and safely. Vehicles and equipment can represent a large portion of the initial investment, while working capital is needed to manage deposits, supplier payments, payroll timing, and cash gaps between completing work and collecting invoices. This component supports funding requests, budgeting, launch planning, and founder decision-making by showing where capital will be used and whether the planned investment is sufficient.
Break-Even Analysis
The break-even analysis component helps users estimate when the roofing service may become profitable and what level of revenue or job volume is needed to cover costs. It can use assumptions for fixed overhead, payroll, marketing, rent, insurance, administrative expenses, direct materials, crew labor, gross margin, pricing, and service volume. The output may show the projected break-even month, required sales level, margin needed to cover operating expenses, and the relationship between revenue growth and profitability.
For a roofing service business, this section is valuable because it helps founders and investors understand how quickly the business must generate jobs to support its cost structure. It also helps users evaluate whether the pricing strategy, crew model, and marketing plan are realistic. If break-even depends on a high number of large jobs, the user may need to revisit assumptions around lead generation, capacity, or working capital. If break-even appears achievable with a balanced mix of repairs, installations, and maintenance, the model can support stronger confidence in the operating plan. This makes the break-even section useful for planning, risk assessment, funding discussions, and operational target setting.
File types:
Excel – Single-User: .xlsx
Excel – Multi-User: .xlsx
Similar ProductsOther customers were also interested in...


 HenrySheykin
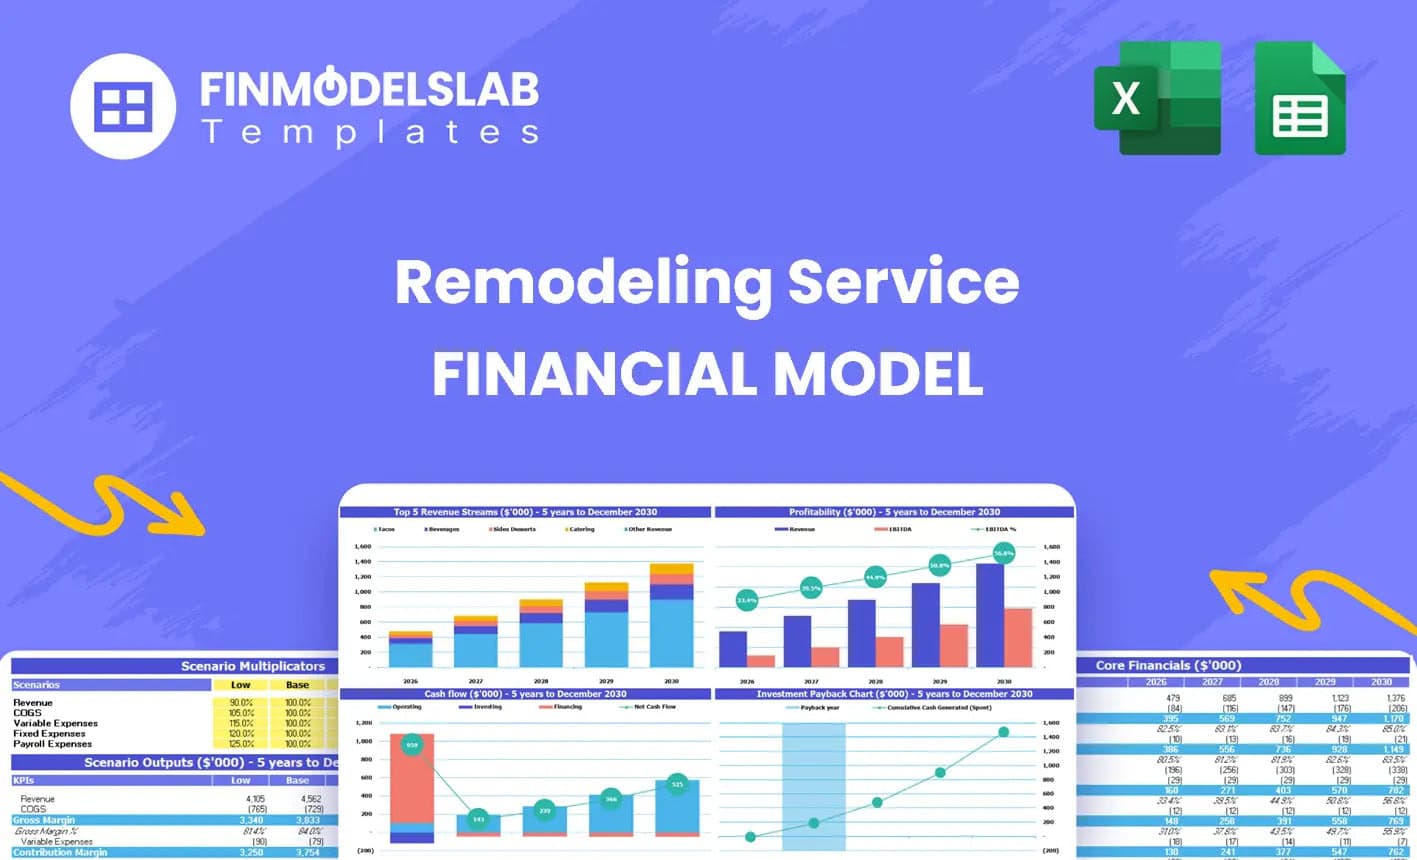
Remodeling Service Financial Model Excel Template
This Remodeling Service Financial Model financial model template helps contractors, founders, busine... Read more
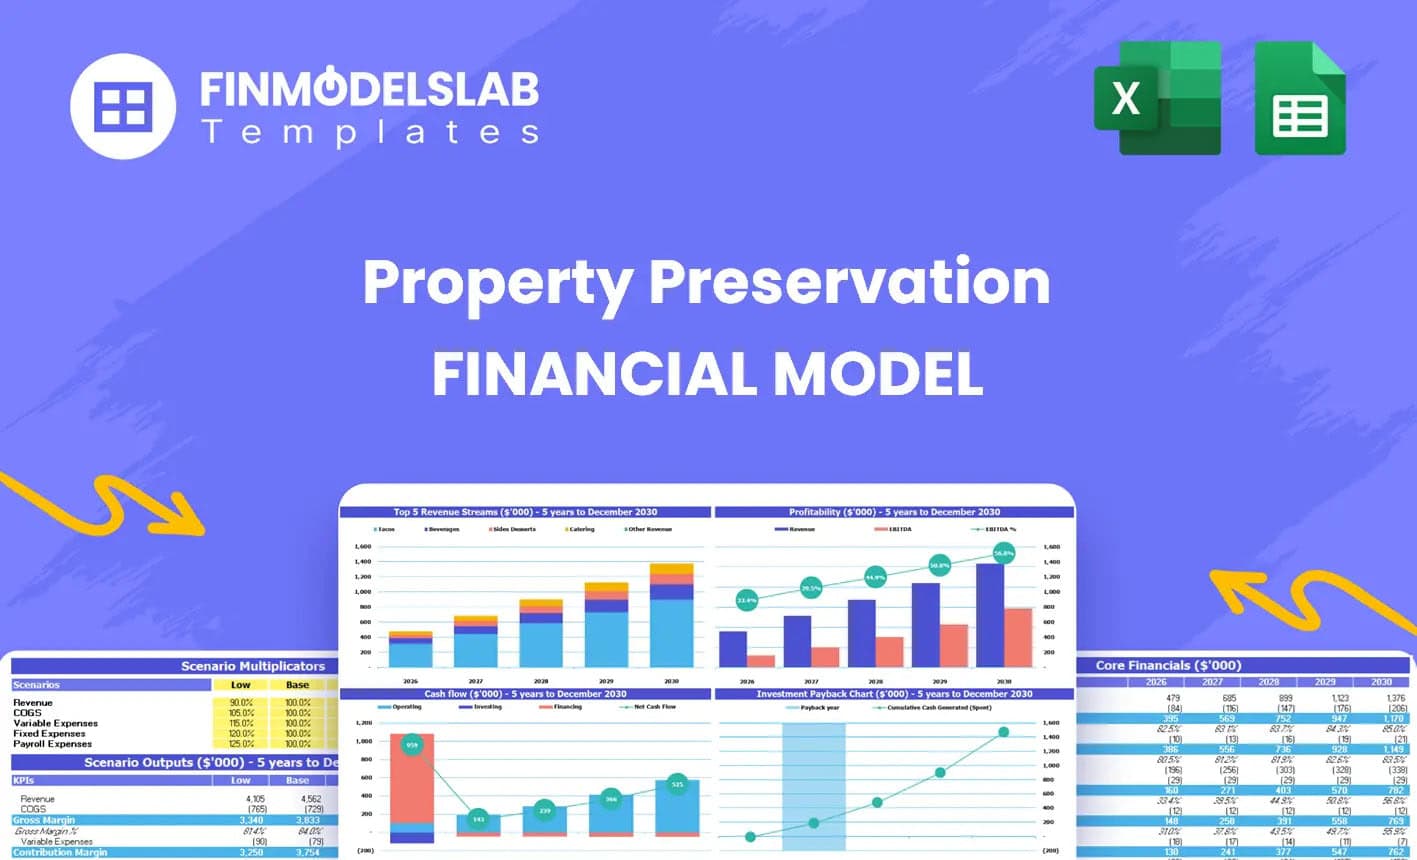
Property Preservation Financial Model Excel Templa...
The Property Preservation Financial Model helps entrepreneurs, operators, consultants, analysts, and... Read more

 Giorgos
Artisan Contractor Business – 5 Year Financial M...
Financial Model providing an advanced 5-year financial plan for an Artisan Contractor Business scena... Read more

Carpentry Business – 5 Year Financial Model
Financial Model providing an advanced 5-year financial plan for a startup or operating Carpentry Bus... Read more

 eFinancialModels
Crane Truck Rental Company Financial Model
Step into the world of crane rental business success with our Crane Truck Rental Company Financial M... Read more
Plumbing Business Financial Model – 5 Year Forec...
Financial Model presenting an advanced 5-year financial plan for a startup or operating Plumbing Bus... Read more

Equipment Leasing Company Financial Model – Dyna...
Financial model presenting a business scenario of an Equipment Leasing Company, which offers Monthly... Read more

Electrician Business Financial Model – 5 Year Fo...
Financial Model presenting an advanced 5-year financial plan for a startup or operating Electrician ... Read more

 City Finance
20 Year 3 Statement Architect Company Finance Mode...
A comprehensive 20 Year 3 Statement editable, MS Excel spreadsheet for tracking Architect Company fi... Read more
 anthony
Bundle – Business Financial Forecasting Mode...
The purpose of this Bundle of Business Forecasting and Financial Models is to assist Business Owners... Read more
You must log in to submit a review.