
0 ITEMS

Charcoal Production Business Plan Financial Model Excel Template
The Charcoal Production Financial Model helps users turn a charcoal manufacturing idea into a structured five-year financial forecast. It is designed for planning a production operation that may sell lump charcoal, briquettes, restaurant bulk bags, retail packs, and wholesale pallet mixes. Instead of starting with a blank spreadsheet, buyers can work from a ready-to-use model built around the core economics of charcoal production, including production capacity, product pricing, raw material costs, operating expenses, payroll, capital investments, cash flow, profitability, and investor returns. This financial model template is useful for entrepreneurs, founders, business owners, consultants, analysts, and anyone preparing a business plan, loan application, investor presentation, feasibility study, or internal budget for a charcoal production business. It helps organize the assumptions that matter most, such as expected sales volume, selling prices, cost of wood or biomass inputs, packaging costs, labor requirements, fixed overhead, equipment purchases, and working capital needs. By connecting these assumptions to projected income statements, cash flow forecasts, balance sheets, and performance metrics, the model gives users a clearer view of how the business may perform before launch or expansion. The template supports practical financial planning by showing how revenue assumptions flow through cost of goods sold, gross margin, payroll, operating expenses, EBITDA, net profit, and cash balance over time. Users can test different operating conditions, compare low, base, and high scenarios, review break-even timing, and assess whether the business has enough liquidity to support production growth. This makes it easier to evaluate funding requirements, manage risk, and make informed decisions about pricing, capacity, supplier terms, staffing, and capital spending. Built for both planning and presentation, the Charcoal Production Financial Model includes editable inputs, automated calculations, professional charts, KPI views, investor metrics, and lender-friendly outputs. It is suitable for Microsoft Excel and Google Sheets, allowing users to customize the assumptions to match their own facility, product mix, currency, market, and growth plan. Whether you are assessing a new charcoal plant, expanding an existing production business, or preparing financial documents for stakeholders, this model provides a clear and efficient framework for decision-making.
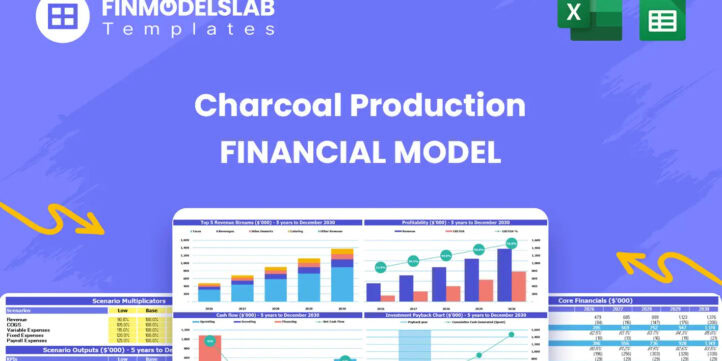


Financial Model Overview
The Charcoal Production Financial Model is a ready-to-use financial model template created for planning, evaluating, and presenting the economics of a charcoal manufacturing business. It helps users estimate how a charcoal production operation may perform over a five-year period by connecting production assumptions, product sales, startup costs, operating expenses, payroll, cost of goods sold, financing needs, cash flow, and profitability in one structured workbook. This is especially useful for a business that may sell multiple charcoal products through retail, restaurant, wholesale, and distribution channels, because each product line can have different pricing, volume, margin, and growth assumptions. Entrepreneurs can use it to test whether a new facility is financially feasible, business owners can use it to plan expansion, consultants can use it for client projects, and analysts can use it to prepare funding documents or investment cases. The template replaces guesswork with a more organized planning process, making it easier to understand required startup capital, expected returns, monthly cash requirements, break-even timing, and long-term financial sustainability.
All-in-One Dashboard
The all-in-one dashboard gives users a centralized view of the most important inputs and outputs in the Charcoal Production Financial Model. Instead of moving through multiple worksheets to understand the business, users can review key assumptions, financial results, profitability indicators, cash flow signals, and summary metrics from one control area. Inputs may include production volumes, product pricing, cost drivers, fixed expenses, staffing assumptions, capital investments, and financing assumptions, while outputs may include revenue, EBITDA, net profit, cash balance, break-even point, and return metrics. This component is useful because charcoal production is a manufacturing business with many moving parts, including raw material sourcing, kiln operations, packaging, storage, logistics, and customer channels. A dashboard helps owners and stakeholders see how changes in assumptions affect the overall forecast. For planning, it helps users quickly identify whether the business model is viable. For budgeting, it highlights the relationship between revenue growth and cost structure. For funding discussions, it provides a clear summary that investors, lenders, partners, and advisors can understand without needing to inspect every formula in the model.
Low, Base, and High Scenario Analysis
The low, base, and high scenario analysis component helps users evaluate how the charcoal production business could perform under different market and operating conditions. The base scenario can represent the most likely plan, while the low scenario may reflect slower sales, lower production utilization, higher raw wood costs, weaker pricing, or delayed customer acquisition. The high scenario may reflect stronger wholesale demand, improved kiln efficiency, higher selling prices, faster distribution growth, or better cost control. Inputs in this section can include sales volume, production output, price per bag or pallet, raw material cost, packaging cost, marketing spend, labor cost, and other operating assumptions. The outputs help show how revenue, gross margin, EBITDA, net income, cash flow, and investor returns change when the assumptions shift. This is useful because a charcoal business can be affected by seasonality, fuel demand, restaurant purchasing patterns, supplier availability, equipment downtime, and price competition. Scenario planning gives founders and analysts a practical way to stress-test the plan before making commitments. It also helps prepare contingency strategies, support lender conversations, and show investors that the business plan considers both upside potential and downside risk.
Professional Charts
The professional charts component converts the financial forecast into visual reports that are easier to interpret and present. Charcoal production models can involve detailed monthly and annual calculations, but stakeholders often need a clear visual summary of revenue growth, expense trends, profit movement, cash flow, margins, and investment returns. This section may use the forecasted income statement, cash flow statement, balance sheet, revenue breakdown, and KPI calculations as source data, then present the results in clean charts suitable for business plans, pitch decks, funding meetings, and internal reviews. Typical outputs may include revenue by year, EBITDA growth, cash balance movement, expense categories, gross margin trends, and profitability over time. This component is useful because many investors, lenders, and operating partners make faster decisions when they can see the financial story visually. For the business owner, charts help identify trends that may be less obvious in rows of numbers, such as rising overhead, improving margins, cash troughs, or the point at which scaling production creates stronger profitability. For presentations, the charts help make the model look more polished and professional while supporting a clearer explanation of the charcoal production strategy.
ROE Components and DuPont Analysis
The ROE components and DuPont analysis section helps users understand what is driving return on equity in the charcoal production business. Instead of looking only at a single return percentage, this component breaks performance into the drivers that influence shareholder returns, such as profitability, asset efficiency, and financial leverage. Inputs may come from the income statement, balance sheet, capital investment schedule, debt assumptions, and equity funding structure. Outputs can include return on equity, profit margin, asset turnover, leverage indicators, and related ratios that explain whether returns are being generated through strong operating profit, efficient use of assets, or reliance on financing. This is valuable for a capital-intensive business because charcoal production may require kiln systems, wood processing equipment, packaging automation, trucks, facility improvements, and compliance-related investments. DuPont analysis helps users determine whether the operation is using these assets productively and whether the forecasted profit justifies the equity invested. For investors, it gives a more analytical view of financial performance. For owners, it supports better decisions about expansion, asset purchases, debt structure, and operational efficiency. For consultants and analysts, it adds a professional layer of financial interpretation beyond basic revenue and profit projections.
Revenue Inputs
The revenue inputs section is where users define the commercial assumptions that drive the charcoal production forecast. It may include different product categories such as lump charcoal bags, briquette bags, restaurant bulk bags, wholesale pallet mixes, and other charcoal or biomass-related products. Users can adjust unit sales, selling prices, annual price growth, product mix, sales channel assumptions, production capacity, and ramp-up timing to reflect their own market plan. The model then uses these inputs to calculate monthly and annual revenue projections over the forecast period. This component is especially important because charcoal production revenue depends not only on total output, but also on the mix of retail and wholesale sales, the size of packaging formats, the pricing power of the brand, and the ability to secure recurring customers such as restaurants, distributors, retailers, or fuel suppliers. By making the assumptions editable, the template allows users to model a local small-scale operation, a larger industrial plant, or a growing business expanding into multiple sales channels. For business planning, this section clarifies what level of volume and pricing is required to support the cost structure. For funding, it provides a transparent foundation for the sales forecast that stakeholders can review and challenge.
Bank-Ready Reports
The bank-ready reports component organizes the financial outputs in a format that can support loan applications, lender reviews, and formal funding discussions. A charcoal production plant often requires meaningful upfront capital for equipment, setup, vehicles, working capital, and facility preparation, so lenders typically want to see structured financial statements rather than informal estimates. This section may include projected profit and loss statements, cash flow statements, balance sheets, debt repayment schedules, profitability summaries, and key financial ratios. Inputs such as startup costs, revenue assumptions, operating expenses, payroll, loan amounts, interest rates, repayment terms, and working capital needs flow into the reports automatically. The outputs help demonstrate whether the business can generate enough cash to cover operating costs, debt service, and future growth needs. This is useful because banks and lenders need to evaluate repayment capacity, liquidity, profitability, and the reasonableness of the assumptions. For the business owner, bank-ready reports reduce the time required to prepare financial documents and help create a more credible funding package. For consultants and analysts, they provide a professional structure that can be adapted to different lender requirements while keeping the forecast consistent across all statements.
Revenue Breakdown
The revenue breakdown component gives users a detailed view of how total revenue is generated across product lines, customer channels, or packaging formats. In a charcoal production business, revenue may come from several distinct sources, including small retail bags, larger retail packs, restaurant bulk bags, briquettes, wholesale pallets, private label products, or specialty charcoal products. Each stream can have different unit economics, customer demand patterns, pricing, cost of goods sold, and margin contribution. This section may use inputs such as units sold, average selling price, sales mix, annual growth, and channel distribution to generate outputs showing revenue by product, revenue share, and growth by category. This is useful because a high total revenue number is less informative unless the owner understands which products are driving it. A detailed breakdown helps users identify the highest-value streams, assess dependence on wholesale buyers, evaluate whether retail expansion is worth the marketing effort, and decide where production capacity should be allocated. It also supports pricing decisions by showing how changes in one product category affect overall revenue. For investor or lender presentations, the revenue breakdown demonstrates that the forecast is built from specific, measurable business drivers rather than a single top-down sales estimate.
KPI Dashboard
The KPI dashboard helps users monitor performance metrics that are important for evaluating the financial health and operating efficiency of a charcoal production business. While financial statements show the overall results, key performance indicators help explain whether the business is improving, underperforming, or moving toward its targets. Metrics may include gross margin, EBITDA margin, net profit margin, cash balance, revenue growth, cost of goods sold as a percentage of sales, operating expense ratio, return on investment, return on equity, payback period, break-even timing, liquidity ratios, and solvency indicators. The component may also include benchmarks or target ranges so users can compare projected performance against expectations for manufacturing, biomass, or fuel-related businesses. This is useful for decision-making because charcoal production requires ongoing control over raw material cost, labor productivity, equipment utilization, packaging cost, logistics expense, and overhead. A KPI dashboard allows owners and managers to track the metrics that matter most without getting lost in detailed worksheets. For funding, it gives investors and lenders a quick way to understand financial quality and risk. For internal management, it helps prioritize operational improvements, monitor profitability, and evaluate whether the business is ready for expansion.
Break-Even Analysis
The break-even analysis component helps users identify when the charcoal production business can cover its fixed and variable costs and begin generating profit. Inputs may include selling prices, production volumes, raw wood or biomass costs, packaging costs, direct labor, utilities, freight, facility rent, insurance, salaries, maintenance, marketing, and other operating expenses. The model uses these assumptions to estimate the sales volume or revenue level required to break even, as well as the month or year when the business is expected to reach that point. This is especially useful for a charcoal manufacturing operation because the business may have significant fixed costs from equipment, facility operations, staffing, and compliance, while variable costs may change with output and product mix. Break-even analysis helps users understand whether the planned sales ramp is realistic, whether pricing is strong enough, and whether cost control is sufficient to support profitability. It also helps founders explain the path to profitability in a business plan or investor presentation. For lenders, a clear break-even view supports risk assessment by showing how quickly the business may become self-sustaining. For owners, it provides a practical target that can guide pricing, customer acquisition, production scheduling, and expense management.
Startup Cost and Capital Expenditure Planning
The startup cost and capital expenditure planning component helps users estimate the initial investment required to launch or expand a charcoal production facility. This may include kiln system installation, wood processing equipment, drying and storage areas, packaging line automation, delivery vehicles, facility improvements, environmental compliance upgrades, permits, licenses, office setup, safety equipment, initial inventory, deposits, professional fees, launch marketing, and working capital reserves. Inputs are typically entered as one-time costs, timing assumptions, useful life assumptions, and funding sources, while outputs may include total startup capital required, capital expenditure schedules, depreciation impacts, cash outflows, and funding gaps. This component is useful because charcoal production is not just a sales-driven business; it requires physical assets and operational readiness before revenue can scale. Underestimating startup costs can create cash shortages, delayed production, or unexpected financing needs. A structured startup budget helps users determine how much capital is needed before operations begin, how much should be financed through debt or equity, and which investments are essential versus optional.
Similar ProductsOther customers were also interested in...

 HenrySheykin
Solar Panel Manufacturing Plant Business Plan Fina...
The Solar Panel Manufacturing Financial Model helps users turn a solar factory concept into a struct... Read more

Coal Mining Financial Model Excel Template
The Coal Mining Financial Model helps users turn a mining project concept, expansion plan, or invest... Read more

Metal Mining Business Financial Model Excel Templa...
The Metal Mining Financial Model Financial Model Template helps users turn a mining project concept ... Read more
Food Production Financial Model Excel Template
The Food Manufacturing Financial Model helps entrepreneurs, founders, consultants, analysts, and bus... Read more
Clothing Line Business Financial Model Excel Templ...
The Clothing Line Financial Model helps founders, apparel entrepreneurs, consultants, analysts, and ... Read more
T-Shirt Printing Business Financial Model Excel Te...
The T-Shirt Printing Financial Model helps entrepreneurs, founders, business owners, consultants, an... Read more

Palm Oil Business Plan Financial Model Excel Templ...
The Palm Oil Production Financial Model helps users turn a palm oil processing, refining, or product... Read more

Gold Mining Business Financial Model Excel Templat...
The Gold Mining Financial Model Financial Model Template helps users turn a gold mining project into... Read more
Biodiesel Manufacturing Business Financial Model E...
The Biodiesel Manufacturing Financial Model helps entrepreneurs, founders, business owners, consulta... Read more
You must log in to submit a review.