Tracking Compounded Investment Returns
See how different investment books look like with a database like approach that feeds into 10 year summaries. Report individually or consolidated.

| All Industries, Financial Services, General Excel Financial Models, Investment, Real Estate |
| CFO, Excel, Hedge Fund, Investors |
1. Goes out 10 years.
2. Track up to 20 members.
3. Up to 500 total investors across 20 members.
4. User enters transactions by date into the database rows, and those are then tracked on 10-year daily summaries that also track $ return based on input and compound the $ return annually. Summaries pull from the member/investor entries, so make sure they match what you have in the assumptions.
5. You have a consolidated summary that toggles between monthly/annual.
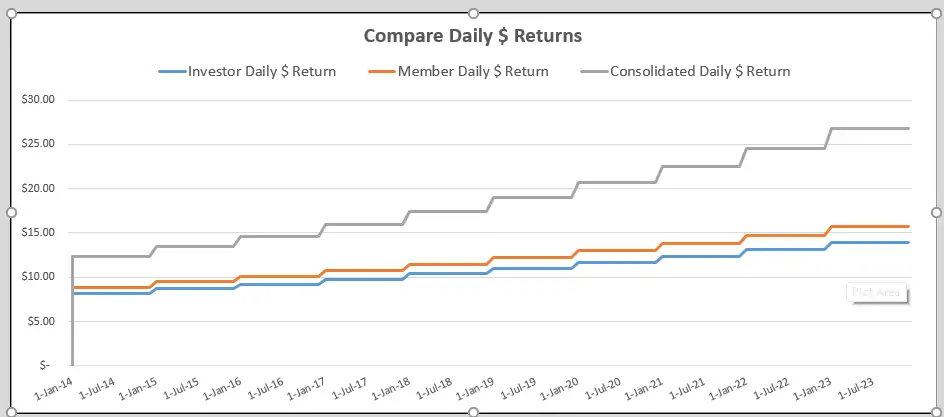
6. Visual that displays interest by day for 10 years for consolidated, member, and investor.
Layout and Flow
There are 3 main tabs. The first is the investor tab, where you pick which investor you want to report on. Their relevant deposits/withdrawals/$ returns will then populate the sheet. The second tab is for members. It tracks their activity based on individual member IDs. The third is consolidated. This tracks all transactions across the book.
You can apply different rate of returns for individual investors, members, and the consolidated book.
Also, each tab has a query function where you can enter any two dates, and the total $ return will calculate per accruals during that date.
A running balance by day applies to the summaries.
Similar Products
Other customers were also interested in...
Investment Fund Preferred Return Tracker: Up to 30...
Track preferred returns for investors in a fund with this template. Premium joint venture tracking t... Read more
Joint Venture and Fund Cash Flow Waterfall Templat...
Here are all the spreadsheets I've built that involve cash flow distributions between GP/LP. Include... Read more
Real Estate Brokerage Economic Analysis
Create up to a 10 year financial forecast for a real estate brokerage operator. Includes three way m... Read more
Private Equity Fund Model (Investor Cashflows)
Private Equity Financial Model to analyze fund cashflows and returns available to Limited Partners (... Read more
Public-Private Partnership (PPP) Financial Model
Financial Model presenting development and operating scenarios of various projects under a Public-Pr... Read more
Leveraged Buyout (LBO) Financial Projection Model
User-friendly financial model to project and analyse the financial outcomes (IRR, projected financia... Read more
Investment Holding Company 3 Statement Financial P...
3 statement 5 or 8 year rolling financial projection Excel model for an investment holding company h... Read more
Quantity Surveyor / Architect – Project Fina...
This Project Feasibility Model is purpose-built to assist Quantity Surveyors, Architects, Developers... Read more
Amortization Schedules Template (Loans, Mortgages,...
User friendly template including Amortization Schedules for Loans, Mortgages, Operating and Finance ... Read more
Mergers and Acquisition (M&A) Financial Projec...
User-friendly financial model to project and analyze the financial outcomes and feasibility of an Me... Read more
You must log in to submit a review.


