
0 ITEMS

Musical Instruments Marketplace Financial Model Excel Template
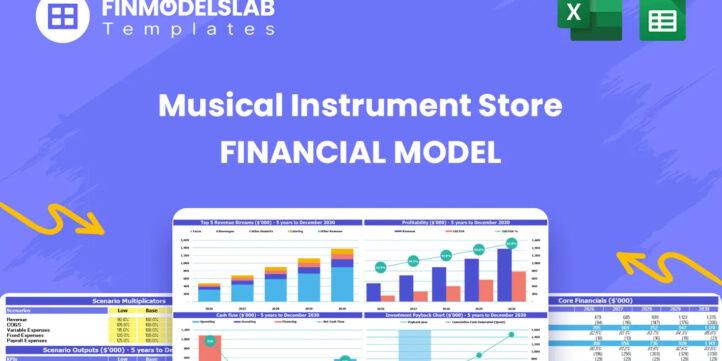
The Musical Instrument Store Financial Model helps users turn a music retail concept into a structured financial forecast that can be used for planning, budgeting, funding preparation, and internal decision-making. Instead of starting from a blank spreadsheet, entrepreneurs and planners can work from a ready-to-use financial model template designed around the realities of selling instruments, accessories, special orders, and related retail products. It helps organize revenue assumptions, startup costs, operating expenses, payroll, inventory requirements, cash flow, and profitability into one connected planning tool. This template is built for founders, business owners, consultants, analysts, and anyone preparing a business plan or investor presentation for a musical instrument store. It supports both new store launches and existing retail businesses evaluating expansion, new product lines, improved merchandising, or funding needs. Users can adjust the assumptions to reflect their own expected foot traffic, conversion rates, repeat customers, average order values, product mix, supplier costs, staffing levels, rent, marketing, and other operating realities. The model is fully editable, allowing each buyer to adapt the forecast to a boutique guitar shop, full-line instrument store, keyboard and audio retailer, or a broader music retail concept. The Musical Instrument Store Financial Model brings together the financial planning questions that matter most before committing capital. It helps estimate how much investment may be required, when the store could become profitable, whether cash reserves are sufficient, how sales growth affects margins, and how changes in pricing or customer volume influence the overall outlook. With built-in projections, scenario tools, visual outputs, profitability analysis, and break-even analysis, the model gives users a practical way to compare assumptions and identify the financial levers that drive performance. For funding documents and stakeholder conversations, the template helps present the business in a more professional and investor-ready format. It connects operating assumptions with financial statements, cash flow forecasts, performance metrics, and decision-focused outputs so users can explain the numbers with confidence. Whether the goal is to secure financing, evaluate feasibility, manage budgets, or make better growth decisions, this financial model template provides a time-saving structure for building a clear and realistic plan for a musical instrument store.


![Excel sheet titled 'Startup Costs (CAPEX)' showing cost categories, dates, and spending with a yellow highlighted cost table and total row.]','CAPEX startup costs in an Excel workbook: categories like Leasehold Improvements and POS Hardware, with launch/end dates and spending amounts in a highlighted table.','Informational image of a CAPEX budget: an Excel table listing startup cost categories, dates, and amounts, with a blue total row.','Spreadsheet image conveying startup costs (CAPEX) data: cost categories, timing, and spend, in a highlighted cost matrix.','CAPEX cost table in Excel: startup categories, launch/end dates, spending, and amortizable status in a colored worksheet area.](https://www.efinancialmodels.com/wp-content/uploads/edd/2026/05/musical-instrument-store-financial-model-capex-financialmodelslab_6fcb2061-2f97-4da5-ade9-88c3ba72f322-scaled.jpg "musical-instrument-store-financial-model-capex-financialmodelslab_6fcb2061-2f97-4da5-ade9-88c3ba72f322 | eFinancialModels")


Financial Model Overview
The Musical Instrument Store Financial Model is a ready-to-use financial model template designed to help entrepreneurs, store owners, consultants, analysts, and business plan writers evaluate the financial feasibility of a music retail business. A musical instrument store depends on more than simply placing guitars, keyboards, drums, accessories, and special-order items on shelves. It requires a clear view of foot traffic, buyer conversion, inventory costs, supplier margins, staffing, rent, marketing, working capital, cash flow, and the timing of profitability.
This template brings those moving parts into one structured model so users can replace guesswork with a practical planning framework. It is useful for launching a new store, preparing funding documents, testing expansion plans, reviewing operational performance, or presenting the business case to lenders and investors. The model is fully editable and built to support up to five years of financial projections, giving users a flexible way to customize assumptions, forecast revenue, analyze costs, review cash flow, and understand whether the store can achieve sustainable profitability.
All-in-One Dashboard
The all-in-one dashboard gives users a central view of the core inputs and core outputs that drive the Musical Instrument Store Financial Model. This component is useful because a retail business can quickly become difficult to understand when revenue assumptions, inventory costs, expenses, payroll, financing, and profitability metrics are spread across different tabs or disconnected calculations. The dashboard consolidates the most important planning information so users can see how their assumptions translate into financial results. Inputs may include customer traffic, conversion rates, average transaction values, accessory sales mix, gross margins, payroll levels, rent, marketing expenses, working capital needs, and funding assumptions. Outputs may include revenue, gross profit, EBITDA, net income, cash balance, break-even timing, payback period, and other key indicators.
For founders and business owners, the dashboard provides a quick way to review the health of the plan before going deeper into detailed schedules. For consultants and analysts, it creates a clean starting point for reviewing assumptions with clients or stakeholders. For investors and lenders, it helps communicate the overall financial story in a format that is easier to follow than a raw spreadsheet full of formulas. The dashboard is especially valuable during decision-making because it allows users to see the combined effect of changes across the model, such as what happens when foot traffic improves, supplier costs increase, payroll expands, or marketing spend is adjusted.
Low Base High Scenario Analysis
The Low Base High scenario analysis component helps users evaluate how the musical instrument store may perform under different operating conditions. Retail forecasts are never certain, and a music store can be affected by local demand, seasonality, supplier availability, competition, discretionary spending, music education trends, and the effectiveness of in-store events or promotions.
This section allows users to compare a conservative case, a realistic base case, and an optimistic growth case using adjustable assumptions. Inputs may include daily visitor counts, visitor-to-buyer conversion rates, repeat purchase behavior, average selling prices, product margins, accessory attachment rates, operating expense growth, staffing levels, and inventory purchasing requirements. Outputs may show how revenue, gross margin, EBITDA, cash flow, profitability, funding needs, and break-even timing change across the three scenarios.
This is useful for planning because it helps users avoid relying on a single forecast that may be too optimistic or too cautious. A low scenario can help identify how much cash cushion may be required if the store grows more slowly than expected. A base scenario can support budgeting, hiring, and funding discussions. A high scenario can help plan reinvestment, additional inventory purchases, expanded store hours, or a second location. For lenders and investors, scenario analysis also shows that the business plan has been stress-tested and that management understands the key risks and upside drivers behind the forecast.
Professional Charts
The professional charts component translates the financial projections into presentation-ready visuals that help users communicate the store’s performance more clearly. A financial model can contain many rows of numbers, but charts make it easier for stakeholders to understand trends, relationships, and key decision points. This component may visualize revenue growth, gross profit, EBITDA, net income, cash balance, operating expenses, margin development, revenue stream mix, and year-over-year performance. Inputs flow from the model’s underlying assumptions and financial statements, allowing the charts to update as users adjust pricing, traffic, product mix, payroll, rent, marketing, inventory costs, or scenario assumptions. Outputs may include line charts, bar charts, margin visuals, trend summaries, and other graphics suitable for business plans, pitch decks, lender packages, and internal reviews.
For a musical instrument store, professional charts are particularly helpful because the business has multiple moving parts, including direct instrument sales, high-margin accessories, special orders, repeat customers, and working capital tied up in inventory. Visual reporting can show whether revenue growth is being supported by healthy gross margins, whether expenses are scaling appropriately, and whether the cash position remains stable as the store grows. This component saves time for users who need investor-ready materials because they do not have to build visuals manually. It also supports better decision-making by making trends easier to spot before they become operational problems.
ROE Components and DuPont Analysis
The ROE components and DuPont analysis section helps users understand the drivers behind return on equity rather than viewing profitability as a single final number. Return on equity is important for investors and owners because it shows how effectively the business uses invested capital to generate returns. The DuPont framework breaks ROE into underlying components, commonly including profitability, asset efficiency, and financial leverage. In the context of a musical instrument store, this section may use inputs such as net income, revenue, total assets, inventory investment, equity funding, debt financing, and balance sheet assumptions. Outputs can help show whether returns are being driven by healthy profit margins, efficient use of assets, or leverage.
This matters because a music retail business may require meaningful upfront investment in leasehold improvements, display fixtures, point-of-sale systems, delivery capability, and inventory. If the store carries too much slow-moving inventory or relies heavily on expensive financing, returns can weaken even when sales are growing. By reviewing ROE components, users can identify whether they need to improve margins, increase inventory turnover, manage fixed assets more carefully, or adjust the capital structure. For funding preparation, this component helps demonstrate a more sophisticated understanding of financial performance. For business owners, it supports practical decisions about inventory purchasing, supplier negotiations, reinvestment, debt usage, and long-term growth planning.
Revenue Inputs
The revenue inputs component is where users define the core assumptions that drive sales in the Musical Instrument Store Financial Model. Revenue in a music retail business is shaped by customer traffic, conversion rates, average transaction values, product categories, repeat purchases, and the mix of instruments, accessories, and special orders.
This section may include inputs for daily visitors, weekend traffic patterns, percentage of visitors who become buyers, growth in conversion over time, average selling price by product type, accessory attachment rates, repeat customer behavior, special-order frequency, and sales seasonality. It may also allow users to adjust assumptions for guitars, keyboards, accessories, high-ticket custom orders, and other relevant revenue streams. Outputs from this section feed the revenue forecast, gross profit calculations, cash flow projections, and profitability analysis.
This component is useful because small changes in conversion rate or average order value can have a major impact on revenue. For example, improving staff training, product displays, local marketing, or in-store events may increase the percentage of visitors who purchase. Promoting accessories alongside instruments can improve margin quality, while special orders can increase average transaction size. By documenting revenue assumptions clearly, users can build a forecast that is easier to explain and defend. This is especially important for business plans, investor conversations, and internal goal-setting because it connects the sales forecast to measurable commercial drivers rather than unsupported estimates.
Bank-Ready Reports
The bank-ready reports component organizes the financial outputs into a format suitable for lenders, investors, partners, and other stakeholders who need to review the business case. A musical instrument store may require outside funding for leasehold improvements, opening inventory, fixtures, equipment, a point-of-sale system, working capital, marketing, or early-stage operating losses. Lenders typically want to understand whether the business can generate enough cash flow to cover expenses, repay debt, and maintain sufficient liquidity.
This section may include projected income statements, cash flow statements, balance sheets, debt schedules, profitability summaries, funding requirements, and key performance metrics. Inputs come from the model’s assumptions for revenue, cost of goods sold, operating expenses, payroll, capital expenditures, working capital, and financing terms. Outputs are structured to help users present a complete financial picture rather than isolated revenue estimates.
This component is useful for preparing loan applications, investor packages, grant submissions, or internal board materials. It helps show how the store expects to generate sales, manage costs, reach profitability, maintain cash reserves, and repay financing if debt is used. For users without a finance background, bank-ready reports reduce the burden of designing financial statements from scratch. For consultants and analysts, they provide a professional structure that can be customized for client presentations and stakeholder reviews.
Revenue Breakdown
The revenue breakdown component gives users a more detailed view of how total sales are generated across the store’s revenue streams. A musical instrument store rarely depends on one product category alone. Sales may come from direct instrument purchases, guitars, keyboards, drums, used instruments, accessories, strings, cables, cases, amplifiers, sheet music, special orders, repairs, rentals, lessons, or other add-on services depending on the store concept.
This component helps users separate revenue sources so they can understand which categories contribute the most sales, which carry the strongest margins, and which may support repeat customer behavior. Inputs may include units sold, average selling price, growth rates, category mix, margin assumptions, customer purchase frequency, and seasonal demand patterns. Outputs may show revenue by stream, percentage contribution to total sales, category-level gross profit, and changes in mix over time.
This is useful for planning because two stores with the same total revenue can have very different profitability depending on product mix. High-ticket instruments may produce strong revenue but require significant inventory investment and may have lower turnover, while accessories may produce smaller transactions but often carry attractive margins and repeat purchase potential. By reviewing the revenue breakdown, users can make better decisions about merchandising, supplier relationships, promotional campaigns, staff training, inventory purchasing, and pricing strategy. It also helps users explain the business model more clearly to investors and lenders by showing where the money is expected to come from.
KPI Dashboard
The KPI dashboard component provides a focused view of the performance metrics that matter most for managing a musical instrument store. While financial statements show the overall results, key performance indicators help users understand the operational drivers behind those results. This section may track metrics such as revenue growth, gross margin, EBITDA margin, net profit margin, cash balance, inventory turnover, average transaction value, visitor conversion rate, repeat customer share, accessory sales mix, payroll as a percentage of revenue, rent burden, and return metrics. Inputs are drawn from the model’s revenue assumptions, cost structure, payroll planning, working capital schedules, and financial statement outputs.
The dashboard may also compare selected metrics against industry benchmarks or target levels, helping users judge whether the forecast is realistic and where performance may need improvement. This component is valuable for business owners because it turns the model into an ongoing management tool rather than a one-time funding document. A declining gross margin may indicate supplier cost pressure or discounting. A weak conversion rate may point to merchandising, pricing, or sales training issues. A high payroll ratio may suggest staffing schedules need to be adjusted. A low inventory turnover rate may show that too much cash is tied up in slow-moving products. By monitoring KPIs, users can make faster and more informed decisions about operations, marketing, staffing, purchasing, and growth.
Startup Cost and CAPEX Planning
The startup cost and CAPEX planning component helps users estimate the initial investment required to open or expand a musical instrument store. Before revenue begins, the business may need to spend on leasehold improvements, store buildout, display fixtures, shelving, signage, point-of-sale hardware, computer systems, security equipment, initial marketing, professional fees, deposits, licenses, insurance, delivery capability, and opening working capital. It may also require a significant initial inventory investment to stock instruments, accessories, and special-order capability. This section allows users to input one-time setup costs, capital expenditures, pre-opening expenses, and timing assumptions so the model can calculate how much funding may be needed before the store becomes self-sustaining.
Similar ProductsOther customers were also interested in...


 HenrySheykin
Online Services Marketplace Financial Model Excel ...
The Online Services Marketplace Financial Model helps founders, entrepreneurs, consultants, analysts... Read more
Fashion Marketplace Financial Model Excel Template
The Fashion Retail Financial Model helps entrepreneurs, founders, business owners, consultants, and ... Read more

General Marketplace Financial Model Excel Template
The General Marketplace Financial Model Financial Model Template helps users plan, evaluate, and pre... Read more
Etsy & Ebay Store Financial Model Excel Templa...
The Etsy and eBay Store Financial Model helps marketplace sellers, founders, consultants, and busine... Read more

Toys Marketplace Financial Model Excel Template
The Toy Marketplace Financial Model Template helps founders, entrepreneurs, consultants, analysts, a... Read more
Information Marketplace Financial Model Excel Temp...
The Digital Products Marketplace Financial Model helps founders, entrepreneurs, consultants, analyst... Read more

Books Marketplace Financial Model Excel Template
The Bookstore Financial Model helps entrepreneurs, bookstore owners, consultants, analysts, and busi... Read more
Online Coaching Marketplace Financial Model Excel ...
The Online Coaching Platform Financial Model helps founders, entrepreneurs, consultants, analysts, a... Read more

Kickstarter Marketplace Financial Model Excel Temp...
The Crowdfunding Marketplace Financial Model helps founders, entrepreneurs, analysts, consultants, a... Read more

Airbnb Marketplace Financial Model Excel Template
The Airbnb Business Financial Model helps users turn a short-term rental or vacation rental concept ... Read more
You must log in to submit a review.