
0 ITEMS

Grocery Marketplace Financial Model Excel Template
The Online Grocery Store Financial Model helps entrepreneurs, founders, business owners, consultants, and analysts turn an e-grocery concept into a structured financial forecast. Instead of starting from a blank spreadsheet, users can work from a ready-to-use model designed around the realities of an online grocery business, including customer acquisition, repeat ordering behavior, product pricing, delivery operations, warehouse needs, inventory handling, and the costs required to launch and scale. It provides a practical framework for estimating revenue, startup costs, operating expenses, payroll, cash flow, profitability, and funding needs over a multi-year planning period. This financial model template is especially useful for anyone preparing a business plan, investor presentation, lender package, internal budget, or expansion analysis for an online supermarket, grocery delivery service, or digital food retail operation. It connects the commercial side of the business with the financial side, helping users understand how marketing spend, customer acquisition cost, average order value, order frequency, product margins, staffing levels, fulfillment costs, and delivery expenses affect the overall performance of the company. All assumptions are editable, so the model can be tailored to a local delivery operation, regional e-grocery platform, specialty food delivery business, or larger online grocery concept. The template supports financial planning by organizing key inputs and automatically translating them into financial outputs that are easier to review, explain, and share. Users can test revenue assumptions, estimate initial capital requirements, evaluate operating expenses, model payroll, review projected profit and loss, monitor cash flow, and assess when the business may reach break-even. This makes it easier to identify whether the business has enough working capital, whether margins are strong enough to support delivery and fulfillment costs, and whether growth targets are realistic under different operating conditions. For decision-making, the Online Grocery Store Financial Model provides a clear way to compare scenarios, review investor-oriented metrics, and present financial results in a polished format. It is built to save time while still giving users control over the underlying numbers. Whether the goal is to raise funding, secure a loan, validate a startup idea, plan a launch budget, or improve an existing online grocery operation, this model helps replace guesswork with a structured financial planning process.
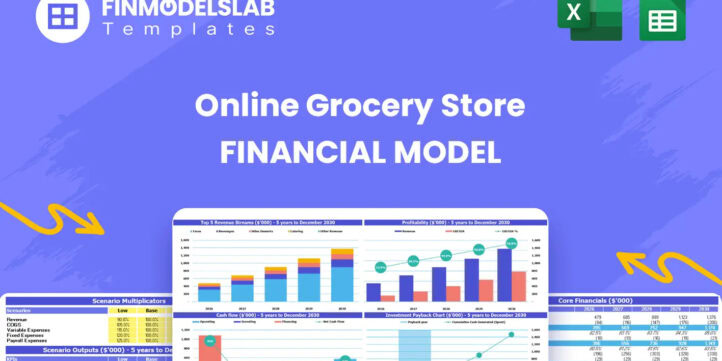


Financial Model Overview
The Online Grocery Store Financial Model is a ready-to-use financial model template built for entrepreneurs, founders, business owners, consultants, and analysts planning an online grocery store, e-grocery platform, grocery delivery service, or digital supermarket. It gives users a structured way to forecast the financial performance of a business that depends on customer acquisition, repeat purchasing, inventory availability, delivery logistics, product margins, warehouse operations, and working capital discipline.
Rather than building a financial forecast from scratch, users can start with a model that already reflects the major drivers of an online grocery business, then adjust the assumptions to match their market, pricing strategy, fulfillment model, supplier terms, staffing plan, and growth goals. The template helps estimate revenue, startup investment, operating expenses, payroll, cost of goods sold, cash flow, profitability, and funding requirements over a multi-year planning period. It is useful for preparing business plans, investor decks, lender discussions, internal budgets, feasibility reviews, and expansion decisions because it turns operational assumptions into clear financial outputs that can be reviewed, tested, and presented professionally.
All-in-one Dashboard
The all-in-one dashboard gives users a centralized view of the core inputs and core outputs of the Online Grocery Store Financial Model. This component is designed to make the model easier to navigate by bringing the most important assumptions and results into one place, helping users understand the financial story without reviewing every supporting worksheet. Inputs may include customer growth assumptions, marketing spend, customer acquisition cost, repeat purchase rate, order frequency, average order value, product margin, staffing levels, delivery costs, startup investment, and operating expenses. Outputs may include revenue, gross profit, EBITDA, net income, cash balance, funding needs, margin percentages, return metrics, and other high-level indicators.
For an online grocery store, this is especially valuable because performance depends on many connected drivers, from grocery pricing and product mix to logistics capacity and customer retention. The dashboard helps users quickly identify whether the business is scaling profitably, whether cash reserves are sufficient, and whether the assumptions behind the plan are producing a realistic financial outcome. It also supports decision-making by giving founders, advisors, investors, and lenders a concise view of the business model before they look deeper into the detailed schedules and financial statements.
Low, Base, and High Scenario Analysis
The low, base, and high scenario analysis component helps users test how the online grocery store may perform under different business conditions. Instead of relying on a single forecast, the model can be used to compare a conservative case, expected case, and upside case across the major financial drivers. Inputs may include changes in marketing efficiency, customer acquisition cost, conversion rates, repeat customer percentages, order frequency, average basket size, grocery margins, delivery costs, labor costs, supplier pricing, and capital needs. The outputs show how these assumptions affect revenue, profitability, cash flow, break-even timing, funding requirements, and investor returns.
This is important for an online grocery business because small changes in customer retention, order density, product margins, or delivery efficiency can create major differences in the financial outcome. A low scenario can help users estimate downside cash needs and prepare contingency plans, while a high scenario can show the potential impact of stronger demand, better retention, or improved operating leverage. This component is useful for business planning, fundraising, and internal decision-making because it helps users understand both risk and opportunity before committing capital, signing leases, purchasing delivery vehicles, hiring staff, or expanding into new service areas.
Professional Charts
The professional charts component turns the financial forecast into clear visual reports that can be used for review, planning, and stakeholder presentations. Instead of forcing users to interpret rows of numbers, this section presents key trends in a more accessible format, such as revenue growth, gross profit, EBITDA, net income, cash balance, customer growth, order volume, margin development, and major cost categories. Inputs come from the underlying assumptions and financial statements, while outputs are automatically reflected in visual summaries that help users communicate the business plan more effectively.
For an online grocery store, charts are particularly useful because the model often includes multiple moving parts, including acquisition spending, repeat orders, product categories, fulfillment costs, payroll, warehouse costs, delivery expenses, and inventory-related assumptions. Visual reports make it easier to spot whether revenue is growing faster than costs, whether margins improve as volume increases, and whether the business has enough cash to support its growth plan. These charts can be useful in investor meetings, lender presentations, board discussions, internal planning sessions, and business plan documents. They help make the forecast more understandable, more polished, and easier to defend when users need to explain how the online grocery business can move from launch to profitability.
ROE Components and DuPont Analysis
The ROE components section uses DuPont analysis to help users understand the drivers behind return on equity, rather than simply presenting a single return figure. This component breaks return performance into more detailed factors that may include profitability, asset efficiency, and financial leverage, helping users see why investor returns improve or decline over time. Inputs may come from the projected income statement, balance sheet, capital structure, net income, total assets, equity investment, debt assumptions, and operating performance. Outputs may include return on equity, profit margin, asset turnover, leverage effects, and related investor-oriented indicators.
For an online grocery store, this type of analysis is useful because the business can be capital intensive, especially when it includes warehouse fit-out, delivery vehicles, cold storage, technology systems, and inventory investment. A business may generate strong revenue growth but still underperform on investor returns if assets are underused, margins are thin, or capital requirements are too high. DuPont analysis helps users evaluate whether the business model is using capital efficiently and whether growth is translating into attractive returns. This component is valuable for founders preparing funding materials, investors assessing the opportunity, and management teams trying to improve profitability, asset utilization, and long-term financial performance.
Revenue Inputs
The revenue inputs component allows users to define the assumptions that drive sales for the online grocery store. This section may include marketing budget, customer acquisition cost, new customers, repeat customer rate, order frequency, average number of items per order, pricing by product category, average order value, subscription revenue, delivery fees, promotional discounts, and growth rates over time. These inputs are the foundation of the revenue forecast because they translate the business strategy into measurable financial assumptions.
For example, users can model how much revenue is generated from new customers acquired through marketing campaigns, how many of those customers become repeat buyers, how often they place orders, and how product pricing affects the value of each basket. The component is useful because online grocery revenue depends not only on attracting customers but also on increasing retention, improving order frequency, and building a reliable purchasing habit. By adjusting revenue inputs, users can test whether planned marketing spend produces enough customer volume, whether the average order value supports delivery economics, and whether repeat orders create a scalable revenue base. This section supports business planning and decision-making by making the connection between customer behavior, pricing, marketing efficiency, and projected sales performance clear and editable.
Bank-Ready Reports
The bank-ready reports component provides lender-friendly financial outputs that help users present the online grocery business in a structured and professional format. This section may include projected profit and loss statements, cash flow statements, balance sheets, debt service assumptions, funding needs, repayment capacity, margins, working capital requirements, and summary metrics that lenders commonly review. Inputs come from the operating forecast, startup costs, financing assumptions, revenue projections, payroll plan, cost of goods sold, and expense schedules. Outputs help users explain how the business will generate income, manage costs, maintain liquidity, and support any requested financing.
This is particularly important for an online grocery store because lenders may want to understand how inventory, delivery assets, warehouse costs, technology investments, and payroll affect cash flow. A bank-ready reporting structure helps users show when the business expects to become cash flow positive, how much capital is required before launch, and whether projected earnings can support debt obligations. This component is useful for loan applications, lender meetings, small business financing, equipment financing, working capital requests, and internal financial reviews. It helps users move beyond a general business idea and present a more credible, numbers-based financial case.
Revenue Breakdown
The revenue breakdown component provides a detailed view of the revenue streams inside the Online Grocery Store Financial Model. Instead of showing only total sales, this section helps users understand where revenue comes from and how each stream contributes to the overall forecast. Inputs may include product category pricing, number of units sold per order, average basket size, delivery fees, subscriptions, repeat purchases, new customer orders, promotional activity, and growth assumptions by period. Outputs may show revenue by customer type, product category, order source, delivery service, subscription plan, or other segments relevant to the business model.
This is useful because an online grocery store often earns revenue from more than one source, and each source may have different margins, customer behavior, and operational requirements. For example, fresh produce, packaged goods, private label products, delivery fees, and membership plans may all contribute differently to profitability. A detailed revenue breakdown helps users identify the strongest sales drivers, assess dependency on specific categories, and evaluate opportunities to improve margins through product mix or pricing changes. It also supports investor and management discussions by making the revenue model easier to explain and by showing whether growth is diversified, repeatable, and aligned with the company’s operating capacity.
KPI Dashboard
The KPI dashboard component tracks performance metrics and benchmarks that are especially relevant for an online grocery store. This section may include customer acquisition cost, repeat purchase rate, order frequency, average order value, gross margin, contribution margin, delivery cost per order, revenue per customer, customer growth, EBITDA margin, cash runway, and other financial or operational indicators. Inputs come from revenue assumptions, marketing spend, customer behavior, pricing, cost of goods sold, operating expenses, payroll, and fulfillment cost assumptions. Outputs provide a concise view of whether the business is performing efficiently and whether the plan is aligned with industry expectations or internal targets.
For an e-grocery business, KPIs matter because growth alone does not guarantee profitability. A store may acquire many customers but still struggle if the cost to acquire them is too high, orders are too small, delivery routes are inefficient, spoilage is excessive, or repeat purchasing is weak. The KPI dashboard helps users monitor the health of the business model and identify which areas need improvement. It is useful for monthly management reviews, investor reporting, strategic planning, and operational decision-making because it links financial results to the practical drivers of grocery delivery performance.
Startup Cost and Capital Investment Plan
The startup cost and capital investment plan helps users estimate the funding required before the online grocery store begins operating and generating revenue. This component may include initial expenses such as warehouse fit-out, delivery vehicle fleet, cold storage units, e-commerce platform development, inventory management software, website setup, licenses, permits, insurance deposits, initial marketing, launch inventory, office equipment, packing materials, hiring costs, and working capital reserves.
Inputs can be customized to reflect the user’s actual launch model, whether the business is starting with a small local delivery area, operating from a warehouse, using a dark store format, partnering with suppliers, or building a broader regional delivery network. Outputs may include total startup investment, capital expenditure by category, pre-opening expense totals, working capital needs, and funding required to reach the first month of operations.
This section is valuable because underestimating startup costs can create cash pressure early in the business, especially in a sector that may require technology, logistics assets, refrigerated storage, and inventory before revenue is earned. For founders and business planners, the startup cost plan creates a more realistic view of the initial investment needed. For lenders and investors, it helps explain exactly how funds will be used and why each category is necessary for launch.
Break-Even and Cash Flow Forecast
The break-even and cash flow forecast component helps users understand when the online grocery store may become profitable and whether the business has enough liquidity to operate through the launch and growth phases. Inputs may include revenue growth, gross margin, cost of goods sold, delivery costs, payroll, rent, warehouse expenses, software subscriptions, marketing spend, debt repayments, capital expenditures, inventory timing, supplier payment terms, and customer payment timing. Outputs may include monthly cash flow, ending cash balance, cash runway, operating profit, EBITDA, net income, break-even month, minimum cash balance, and potential funding gaps.
Similar ProductsOther customers were also interested in...


 HenrySheykin
Online Services Marketplace Financial Model Excel ...
The Online Services Marketplace Financial Model helps founders, entrepreneurs, consultants, analysts... Read more
Fashion Marketplace Financial Model Excel Template
The Fashion Retail Financial Model helps entrepreneurs, founders, business owners, consultants, and ... Read more

General Marketplace Financial Model Excel Template
The General Marketplace Financial Model Financial Model Template helps users plan, evaluate, and pre... Read more
Etsy & Ebay Store Financial Model Excel Templa...
The Etsy and eBay Store Financial Model helps marketplace sellers, founders, consultants, and busine... Read more

Toys Marketplace Financial Model Excel Template
The Toy Marketplace Financial Model Template helps founders, entrepreneurs, consultants, analysts, a... Read more
Information Marketplace Financial Model Excel Temp...
The Digital Products Marketplace Financial Model helps founders, entrepreneurs, consultants, analyst... Read more

Books Marketplace Financial Model Excel Template
The Bookstore Financial Model helps entrepreneurs, bookstore owners, consultants, analysts, and busi... Read more
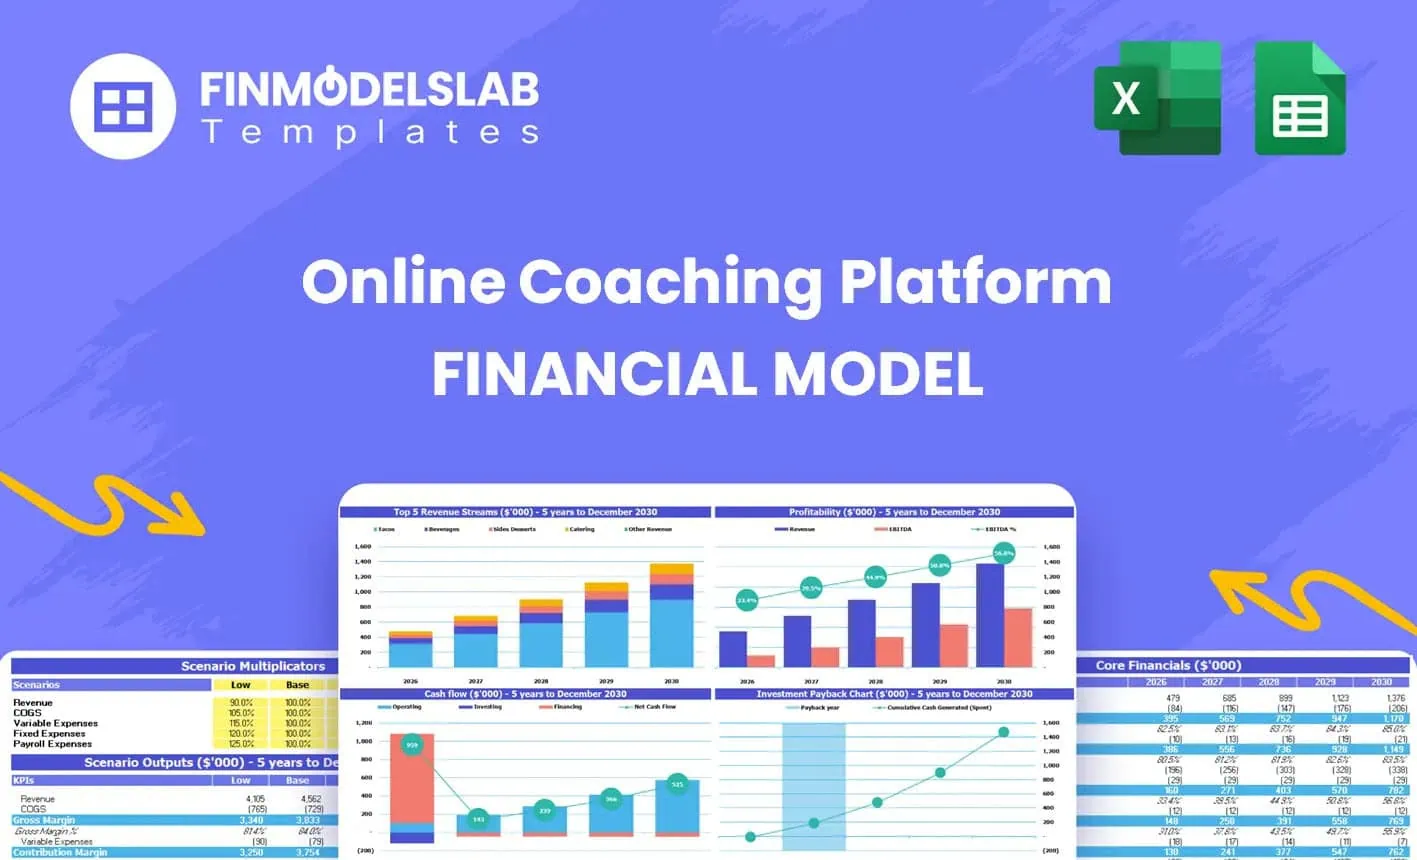
Online Coaching Marketplace Financial Model Excel ...
The Online Coaching Platform Financial Model helps founders, entrepreneurs, consultants, analysts, a... Read more

Kickstarter Marketplace Financial Model Excel Temp...
The Crowdfunding Marketplace Financial Model helps founders, entrepreneurs, analysts, consultants, a... Read more

Airbnb Marketplace Financial Model Excel Template
The Airbnb Business Financial Model helps users turn a short-term rental or vacation rental concept ... Read more
You must log in to submit a review.