0 ITEMS

M&A Valuation Guide: How to Value a Company Before You Buy

A buyer values a company by adjusting its earnings, running discounted cash flow, comparable company, precedent transaction and leveraged buyout analyses, and paying no more than stand-alone value plus net synergies, with part of them left to the seller. This guide applies each method to one hypothetical target, with a worked Excel example shown sheet by sheet and sourced benchmarks.
Key Takeaways
- Adjusted EBITDA, earnings before interest, tax, depreciation and amortisation, is the base of every method, so buyers adjust for owner pay and one-offs.
- Discounted cash flow values the target’s plan, comparables and precedents show market prices, and a leveraged buyout shows what a sponsor can afford.
- In the worked example, the weighted stand-alone enterprise value is USD 129.02 million and the walk-away price is USD 146.66 million.
- US-listed firms with positive EBITDA traded near 19.7x EBITDA in January 2026; lower middle market private deals averaged about 7.5x in the third quarter of 2025.
- Net synergies set the walk-away price, and the offer shares part of them with the seller: 40% in the example, assuming full delivery.
Four methods give a buyer four views of value
No single method sets the price, so a buyer combines four and weights them by trust. Enterprise value (EV) is the value of the operating business before net debt, and equity value is enterprise value less net debt. A leveraged buyout is an acquisition financed largely with debt. Earnings before interest, tax, depreciation and amortisation (EBITDA) is the profit measure that multiples are applied to. Free cash flow is the cash the operating business generates after tax on operating profit, capital expenditure and investment in working capital (the cash tied up in inventory and receivables), and before payments to lenders. The discount rate is the annual return used to convert future cash into today’s value, and the weighted average cost of capital (WACC) is that rate when it blends what shareholders and lenders each require.
- Discounted cash flow (DCF) is the method that sets enterprise value equal to forecast free cash flow discounted at the WACC, plus a terminal value, which is the value of all cash flows after the forecast period.
- Trading comparables set enterprise value equal to adjusted EBITDA times the multiple of listed peers, reduced by a private-company discount.
- Precedent transactions set enterprise value equal to adjusted EBITDA times the multiple paid in past acquisitions, which already includes a control premium.
- Leveraged buyout analysis sets the highest enterprise value equal to senior debt plus the sponsor equity that still earns the target return, divided by one plus the fee rate.
Templates for each method are listed in the eFinancialModels valuation and mergers and acquisitions model collections.
Adjust EBITDA before applying any multiple
Adjusted EBITDA is reported EBITDA after removing items that will not recur under new ownership and resetting related-party terms to market, so every multiple is applied to earnings the buyer can expect to keep.
In the worked example, reported EBITDA of USD 12.0 million rises to USD 14.5 million after four illustrative adjustments: owner pay above market (+1.5), a one-off legal settlement (+0.9), related-party rent reset to market (-0.6) and closed-site losses (+0.7).
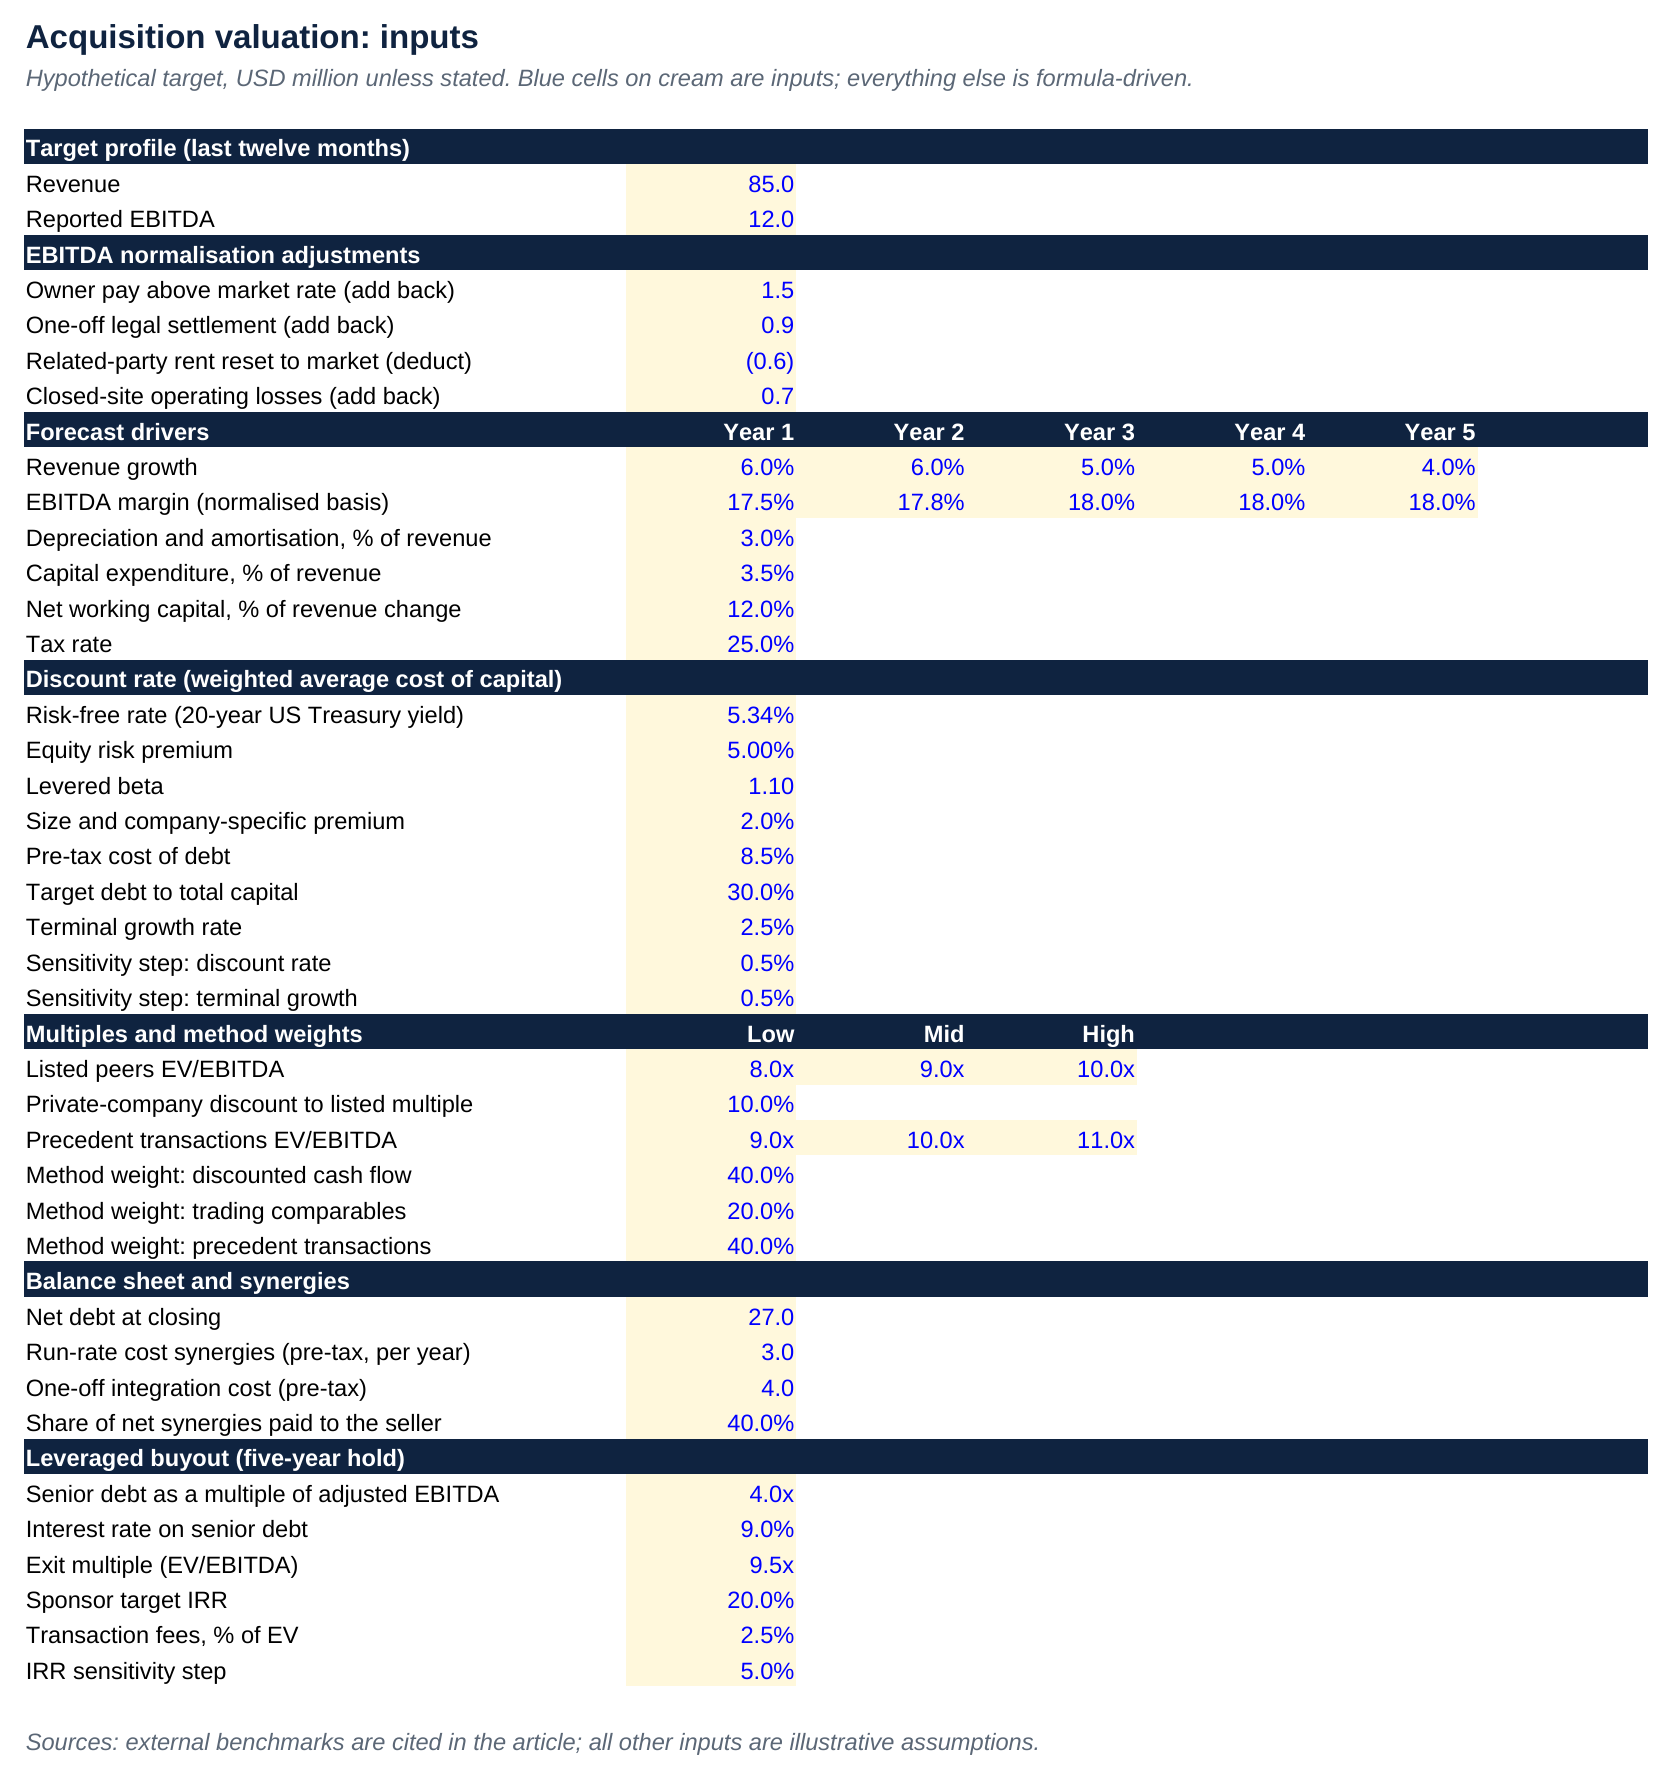
The inputs sheet holds every assumption of the worked example, and each blue cell can be changed. Source: eFinancialModels Analysis
DCF values the target’s own forecast
The WACC blends the cost of equity (the return shareholders require) and the cost of debt (the interest rate lenders charge, reduced by the tax shield). The cost of equity equals the risk-free rate (the return on a government bond with no default risk), plus beta (the sensitivity of the stock to market moves) times the equity risk premium (the extra return investors demand for holding equities), plus any size premium.
Kroll reaffirmed its recommended US equity risk premium at 5.0% in January 2026, to be paired with the higher of a 3.5% risk-free rate floor or the spot 20-year Treasury yield (Kroll, January 2026).
The 20-year US Treasury par yield was 5.34% on 30 October 2026, above that floor, so the spot yield governs (US Treasury, October 2026).
The terminal value equals final-year cash flow times one plus growth, divided by the discount rate less growth, so the growth rate must stay below long-run economic growth. The Congressional Budget Office projects real gross domestic product (GDP) growth averaging 1.8% a year over the rest of the decade (Congressional Budget Office, 2026), and inflation reaching 2.0% in 2030 (Congressional Budget Office, 2026).
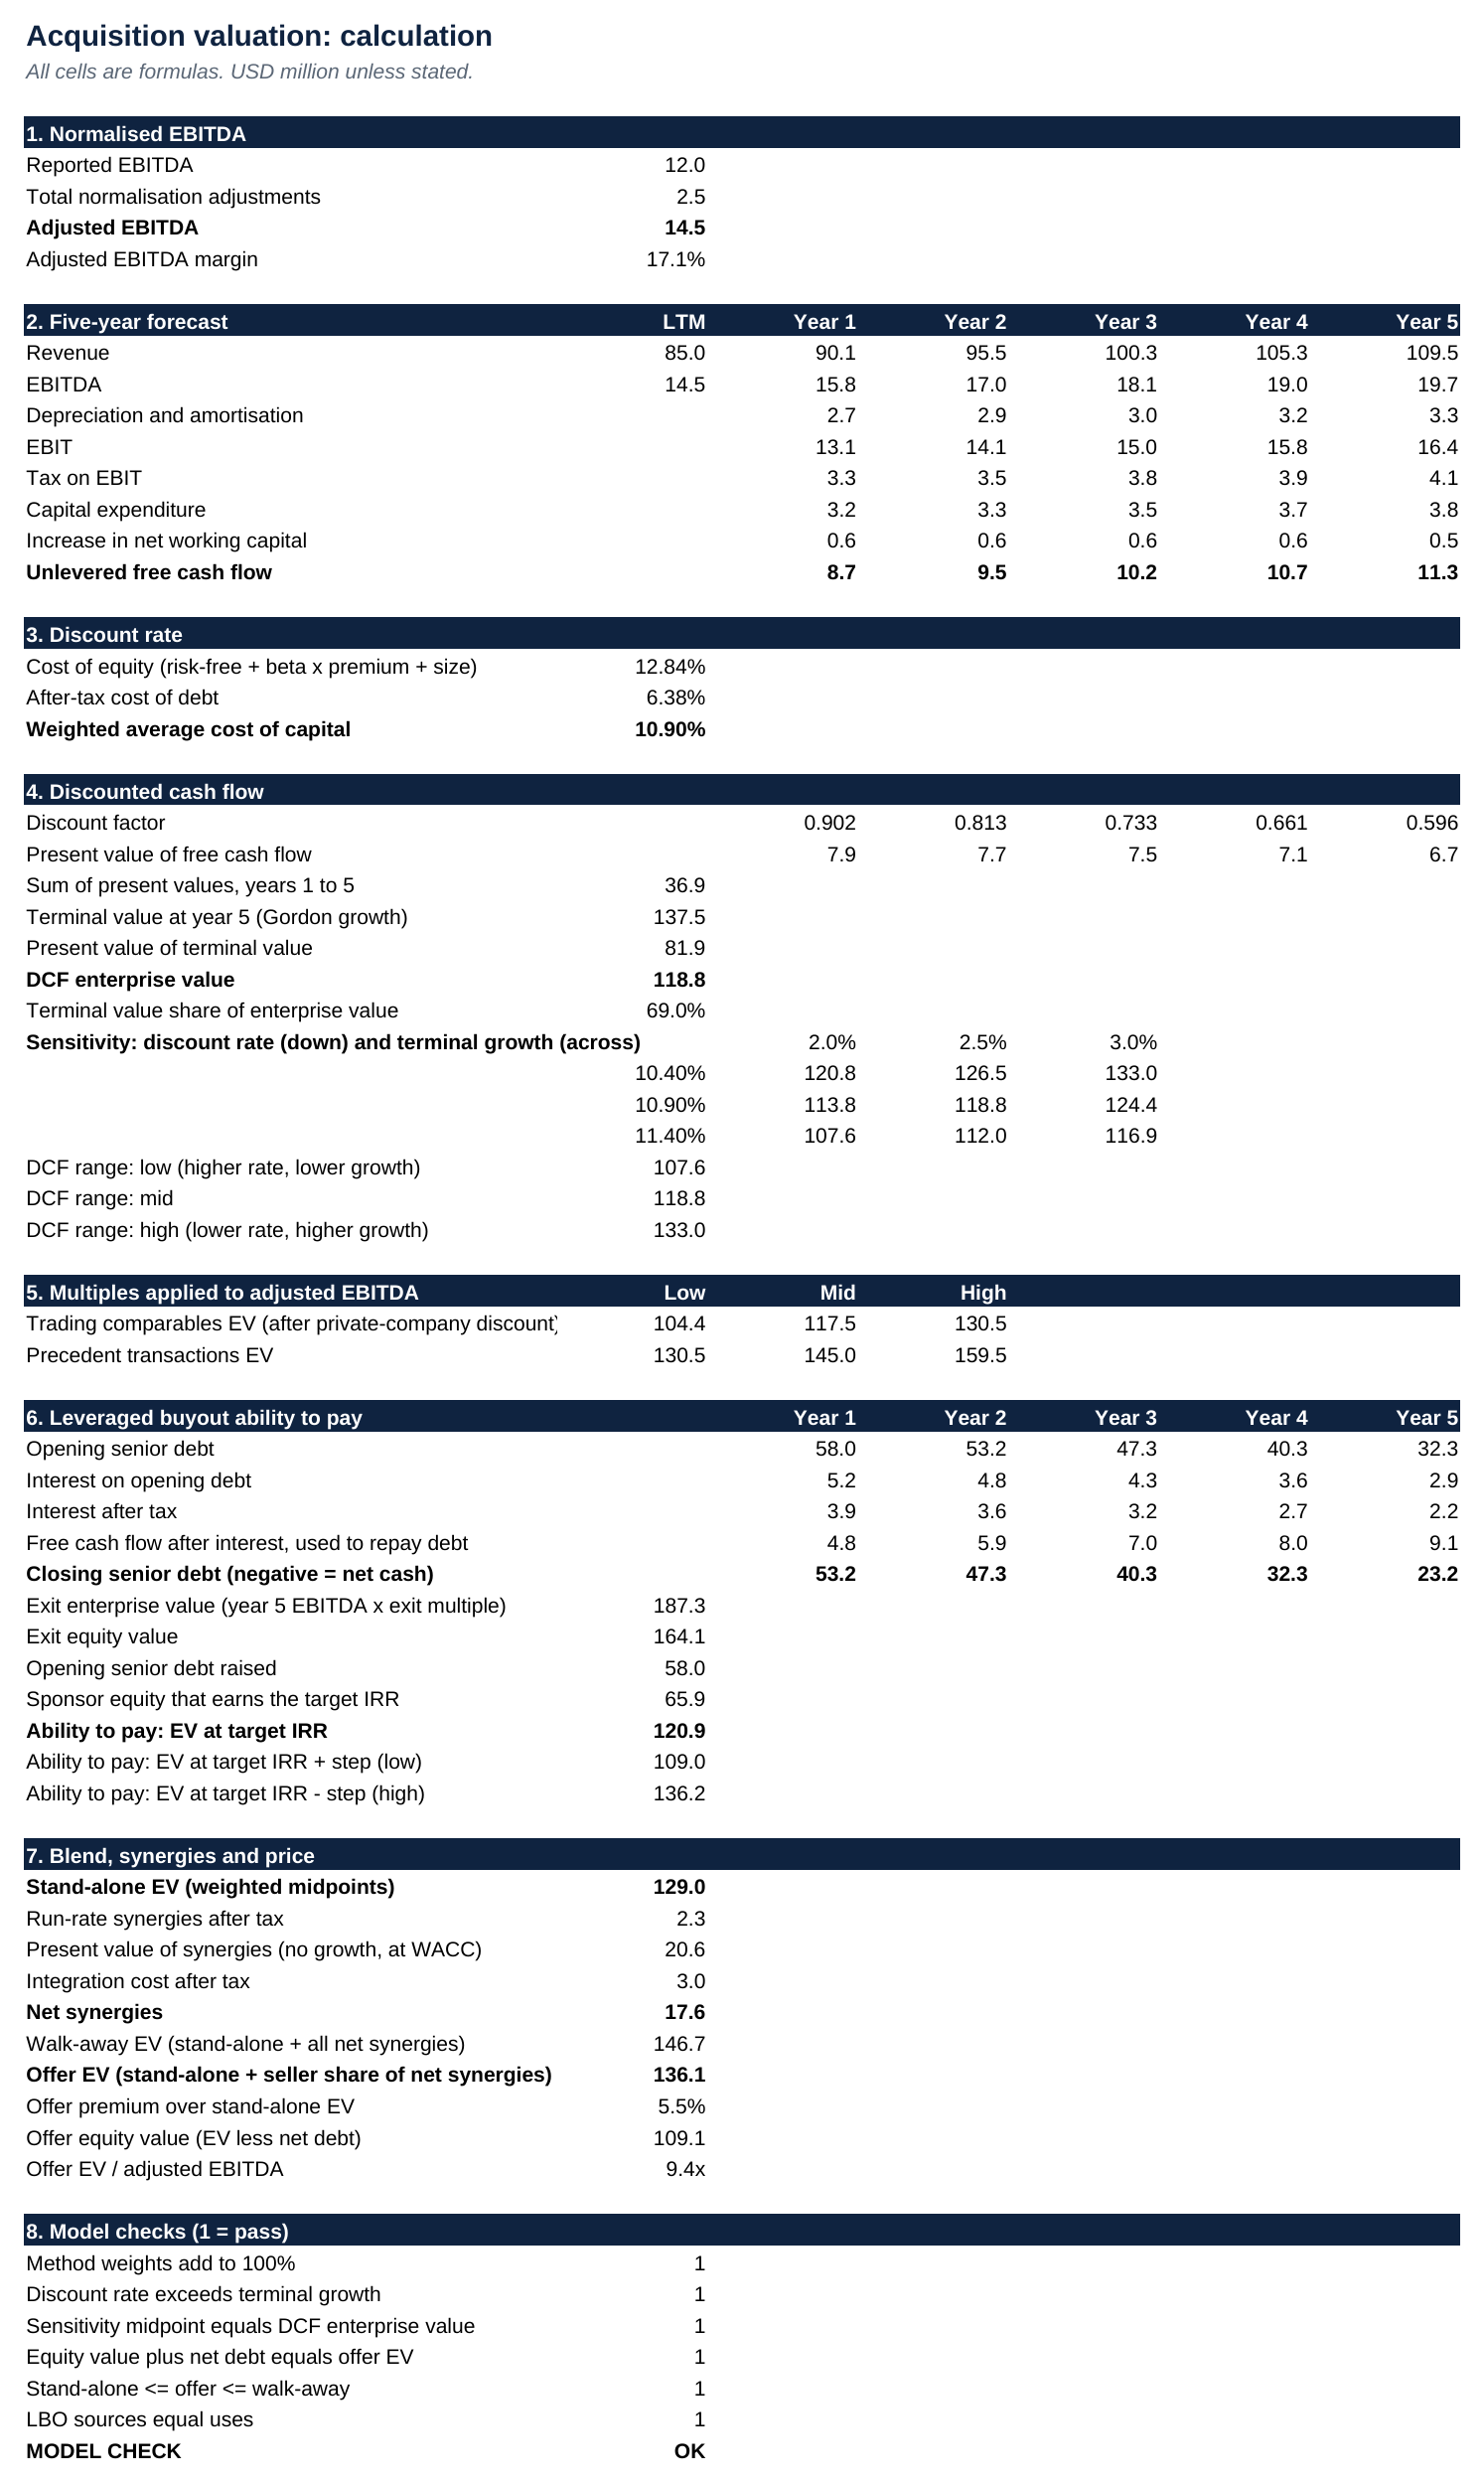
The calculation sheet runs EBITDA adjustments, DCF, multiples, the buyout test and the synergy price walk in one flow. Source: eFinancialModels Analysis
Comparables and precedents price the target against the market
Trading comparables apply the multiples of listed peers, which reflect minority stakes in liquid shares, while precedent transactions apply multiples paid for whole companies, which include a control premium.
US-listed firms with positive EBITDA traded at 19.73 times EBITDA in Damodaran’s January 2026 data (Damodaran, January 2026).
Private lower middle market transactions averaged about 7.5 times EBITDA in the third quarter of 2025, with roughly 6.5 times for deals of USD 10 million to USD 50 million and 9 to 11 times for deals of USD 100 million to USD 500 million (Mercer Capital, Q4 2025).
Public multiples therefore do not transfer to a private target of this size. The example applies two illustrative assumptions: a listed-peer range of 8.0 to 10.0 times, and a 10% private-company discount, a size and liquidity adjustment to the multiple that lowers it because small private companies trade at lower multiples than large listed peers.
A leveraged buyout sets the price a financial buyer can afford
A leveraged buyout analysis starts from the return a financial buyer needs and works backwards to the price. Internal rate of return (IRR) is the annual return that makes the present value of the sponsor’s cash flows equal its investment, and the target IRR fixes how much equity can be paid in.
Debt is the other input. The example assumes illustrative senior debt of 4.0 times adjusted EBITDA at 9.0% interest, a 9.5 times exit multiple, 2.5% transaction fees and a five-year hold.
Search-funders, individual buyers who raise capital to acquire one company, buy smaller targets: the median purchase price was USD 16 million for 2024 and 2025, and aggregate IRR for US and Canadian search funds was 33.9% at the end of 2025 (Stanford Graduate School of Business, 2026).
Most loans under the Small Business Administration 7(a) programme are capped at USD 5 million (Small Business Administration, 2026). For a purchase near the USD 16 million median, the same formulas apply with smaller multiples and a thinner debt layer: a seller note and investor equity fill the gap, and the buyout test should be rerun on that structure.
Synergies decide how much value the seller receives
Synergies are the extra cash flow a buyer expects from combining the two businesses. Their present value is after-tax run-rate savings divided by the discount rate, less after-tax integration cost.
A Bain global survey of more than 300 mergers and acquisitions executives found that 75% of frequent acquirers meet or exceed their synergy targets (Bain, 2026).
The walk-away price is stand-alone value plus all net synergies, and the offer sits below it because the seller expects a share.
Worked example: from USD 14.5 million of EBITDA to an offer
The hypothetical target has USD 85.0 million of revenue, USD 14.5 million of adjusted EBITDA and USD 27.0 million of net debt. The discount rate inputs are a 5.34% risk-free rate, a 5.00% equity risk premium and three illustrative assumptions: a beta of 1.10, a 2.0% size premium and an 8.5% pre-tax cost of debt. With 30% debt at a 6.38% after-tax cost, the WACC is 10.90%. Terminal growth of 2.5% is nominal, so it compares with real growth of 1.8% plus inflation of 2.0%, roughly 3.8% in total. Illustrative forecast growth runs from 6% to 4% a year, and precedent multiples of 9.0 to 11.0 times follow the Mercer Capital range for larger deals.
| Method | Low | Mid | High |
|---|---|---|---|
| Discounted cash flow | 107.6 | 118.8 | 133.0 |
| Trading comparables | 104.4 | 117.5 | 130.5 |
| Precedent transactions | 130.5 | 145.0 | 159.5 |
| Leveraged buyout ability to pay | 109.0 | 120.9 | 136.2 |
Enterprise value, USD million, rounded. DCF moves the discount rate and growth by 0.5 points each; the leveraged buyout range moves the target IRR by 5 points around 20%.
The method weights are 40% DCF, 20% comparables and 40% precedents; the buyout analysis is a ceiling check and carries no weight. Comparables carry the least weight because listed peers reflect minority stakes; the DCF reflects the target’s plan and precedents reflect control. The weighted stand-alone value is USD 129.02 million (0.40 x 118.82 + 0.20 x 117.45 + 0.40 x 145.00 = 129.018, shown rounded).
After-tax run-rate savings are USD 2.25 million a year (USD 3.0 million at 25% tax), worth USD 20.64 million when capitalised at the 10.90% WACC. Subtracting USD 3.00 million of after-tax integration cost leaves net synergies of USD 17.64 million, so the walk-away value is USD 146.66 million (129.02 + 17.64). Sharing 40% of net synergies (USD 7.06 million) gives an offer of USD 136.07 million. That is a 5.5% premium to stand-alone value and 9.4 times adjusted EBITDA, and after USD 27.00 million of net debt the equity value is USD 109.07 million.
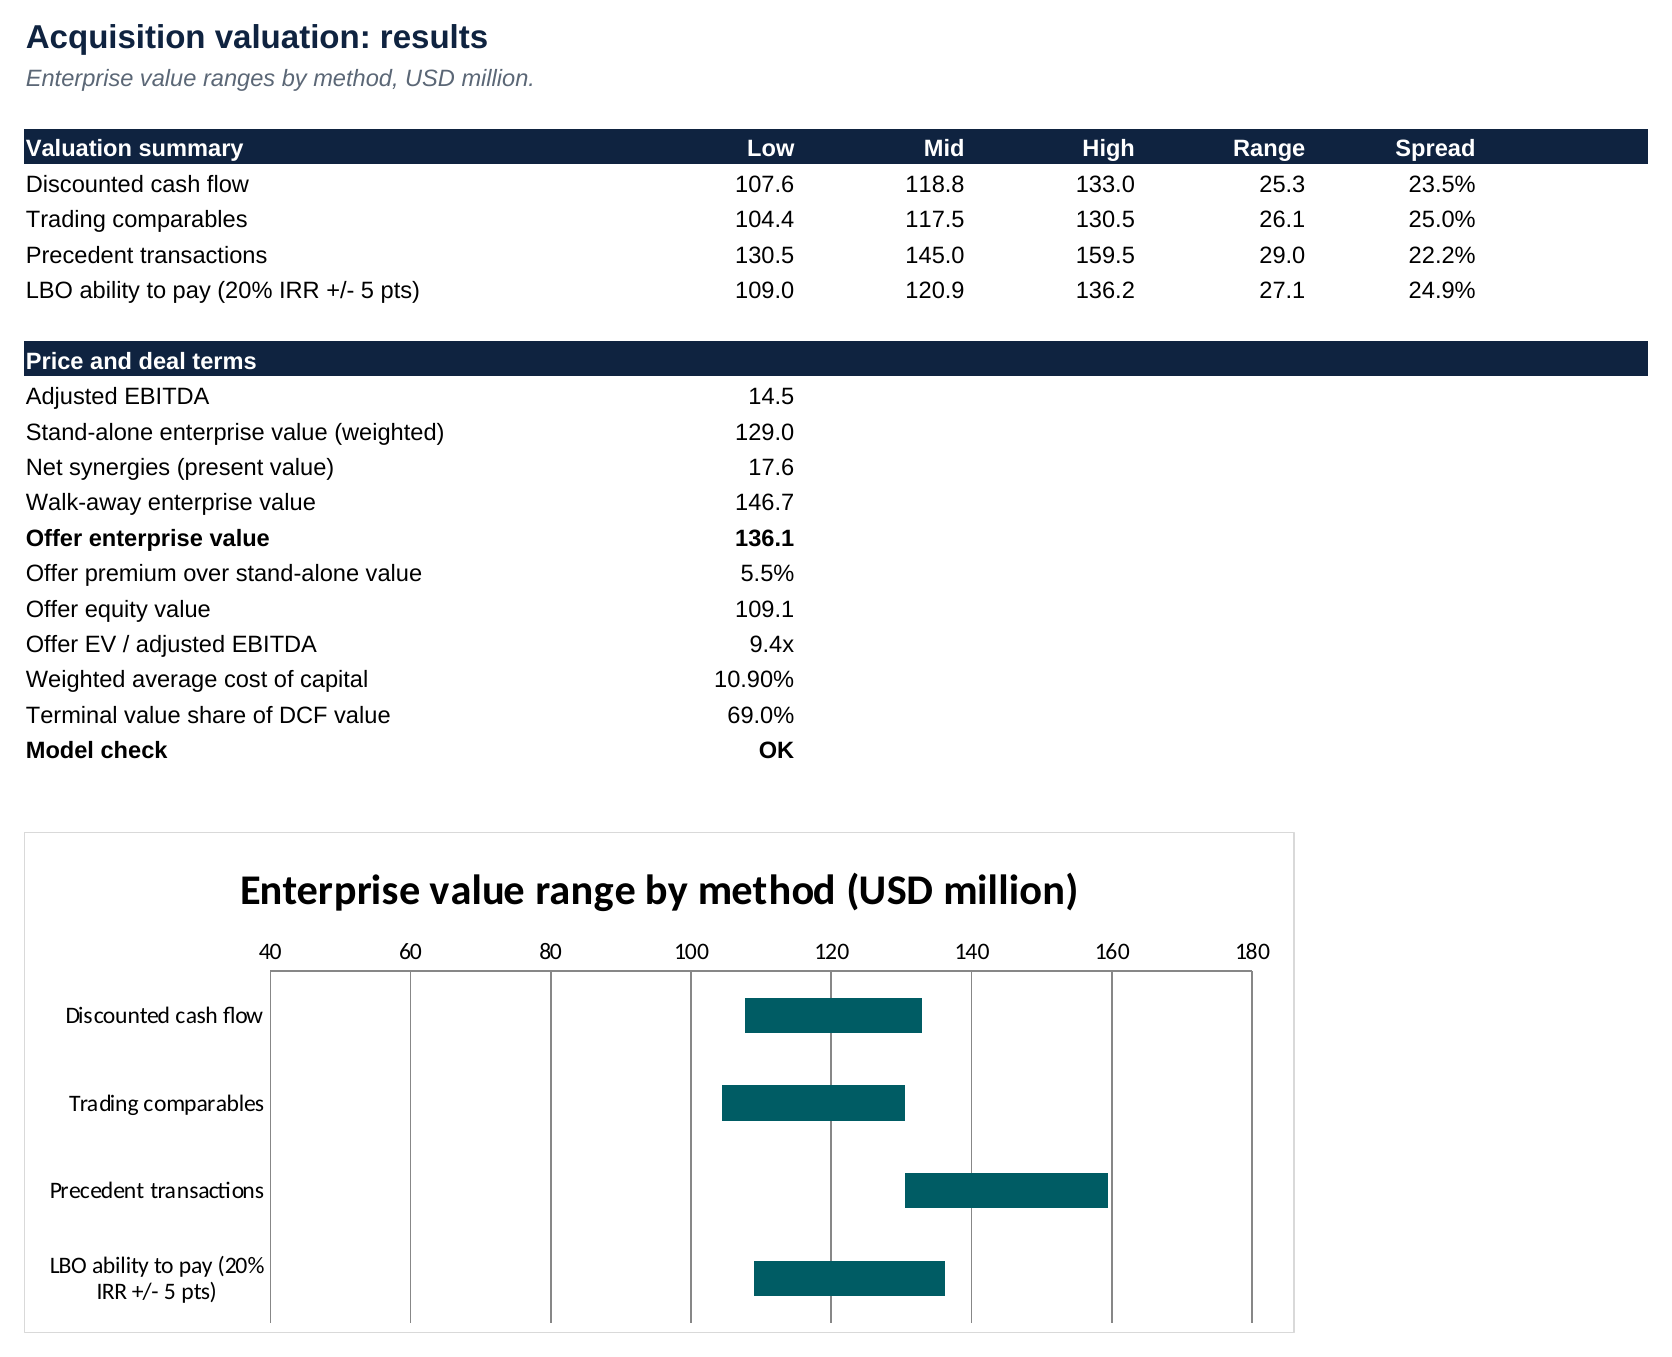
The results sheet summarises ranges by method, the offer and walk-away prices, and the model check. Source: eFinancialModels Analysis
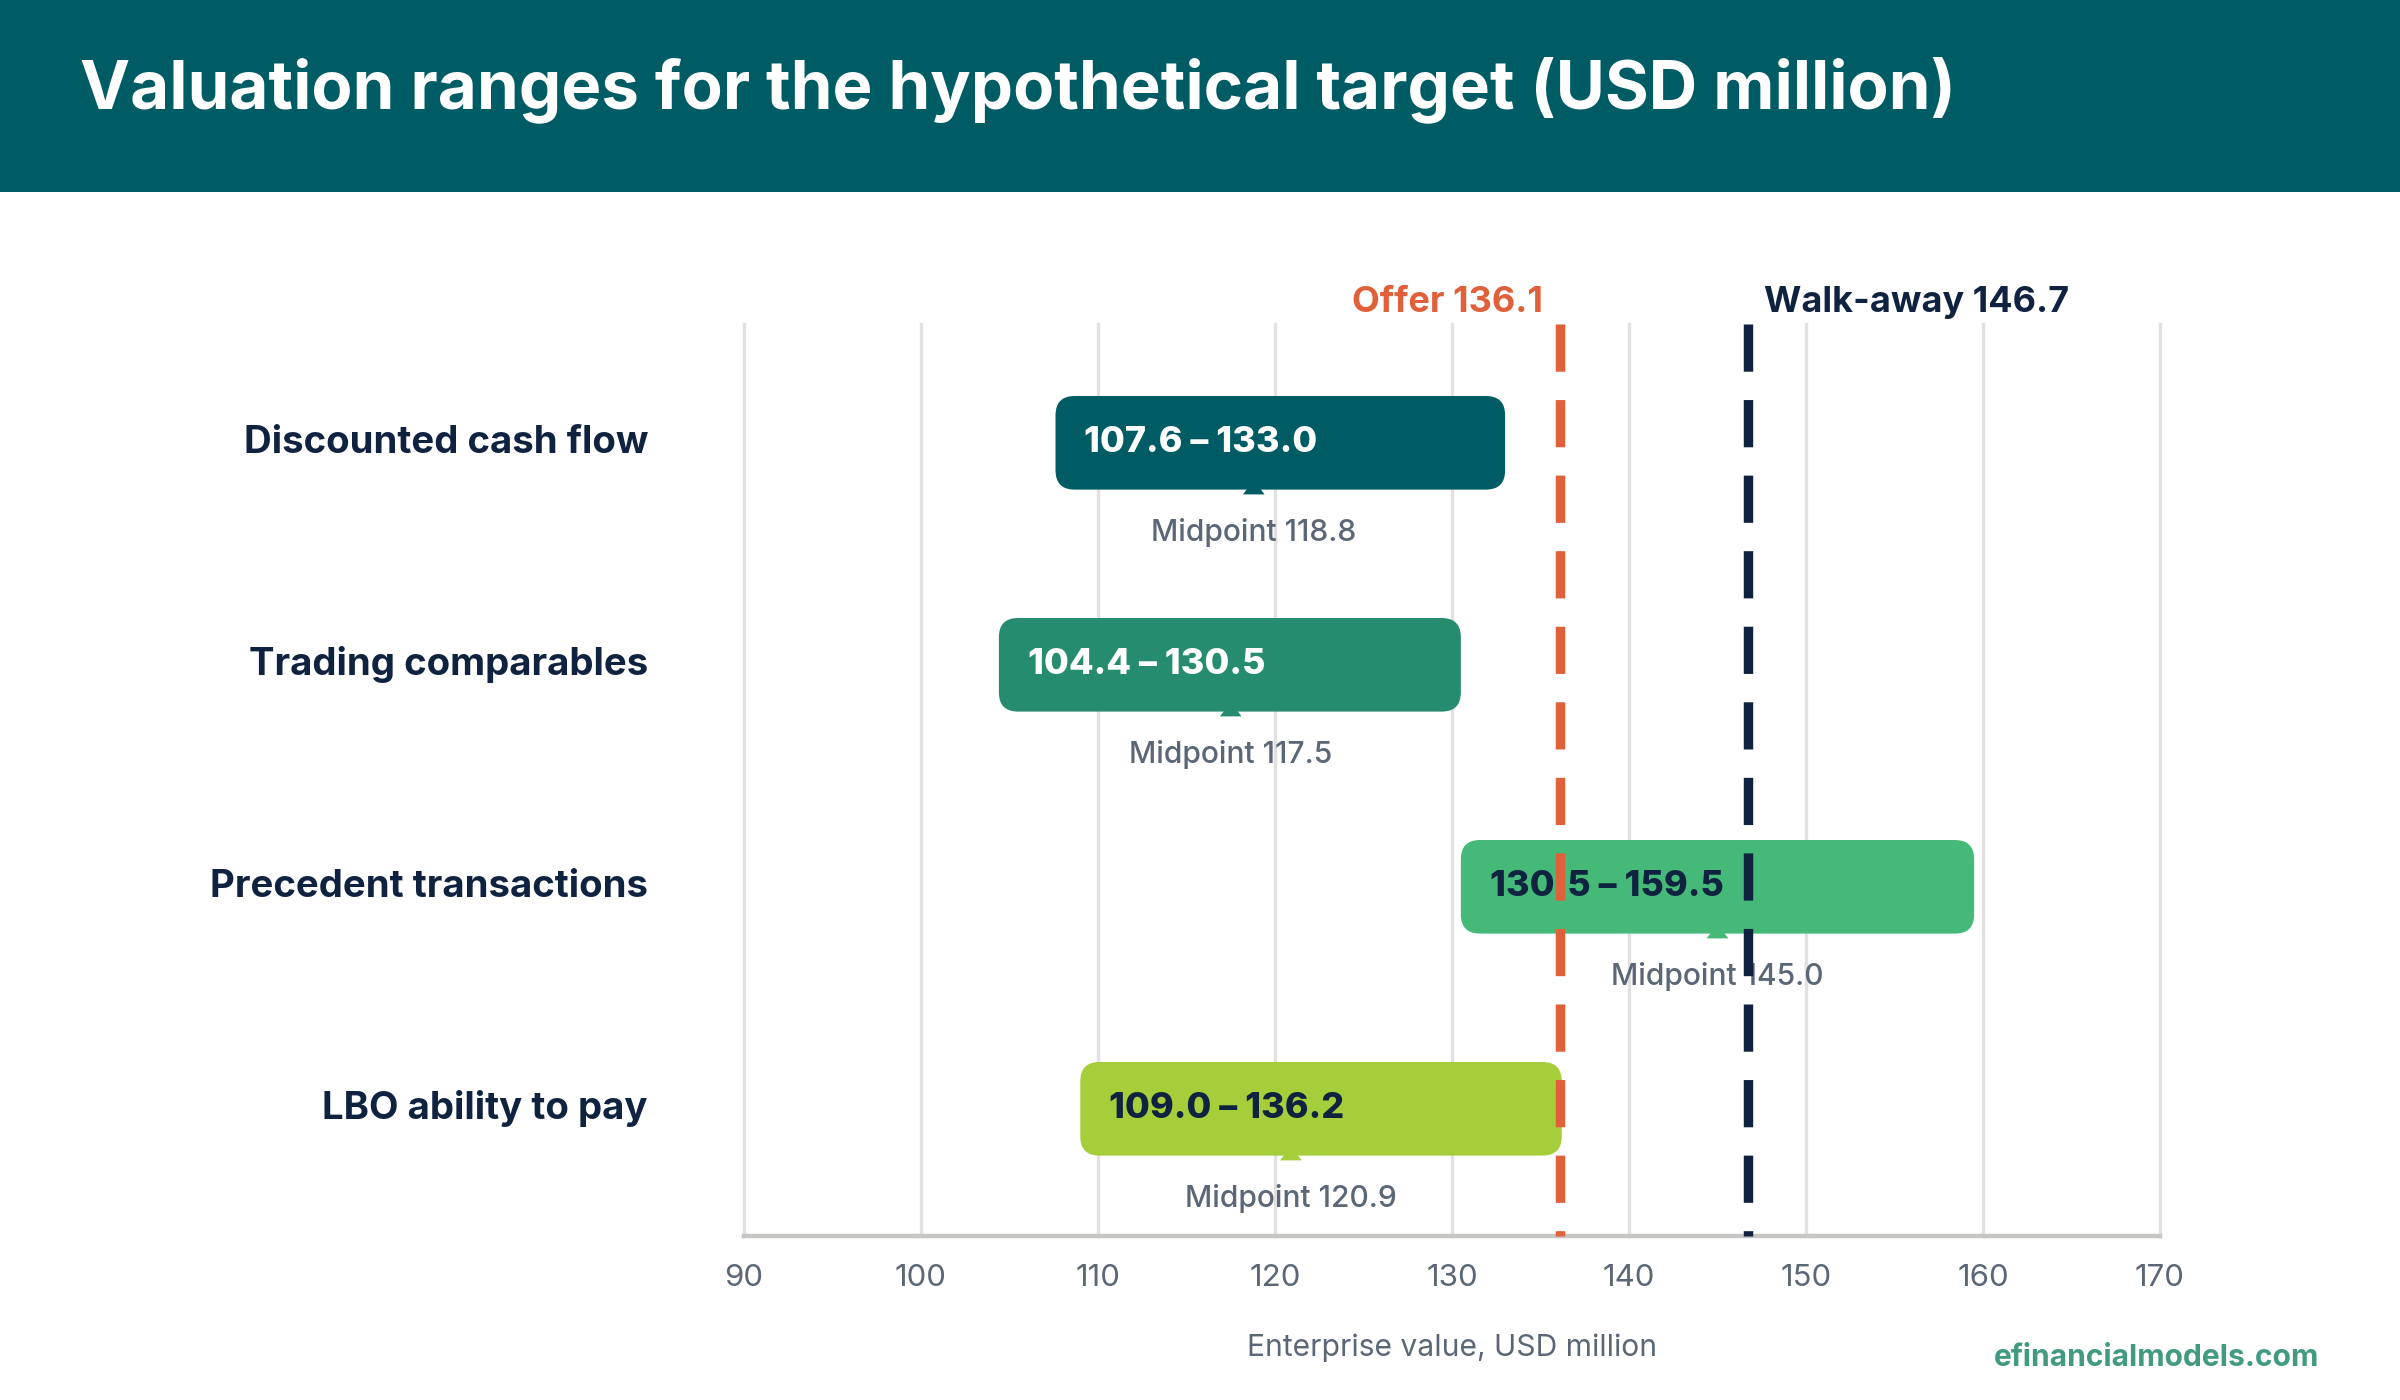
Football field of enterprise value ranges in USD million, drawn from the worked example results. Source: eFinancialModels Analysis
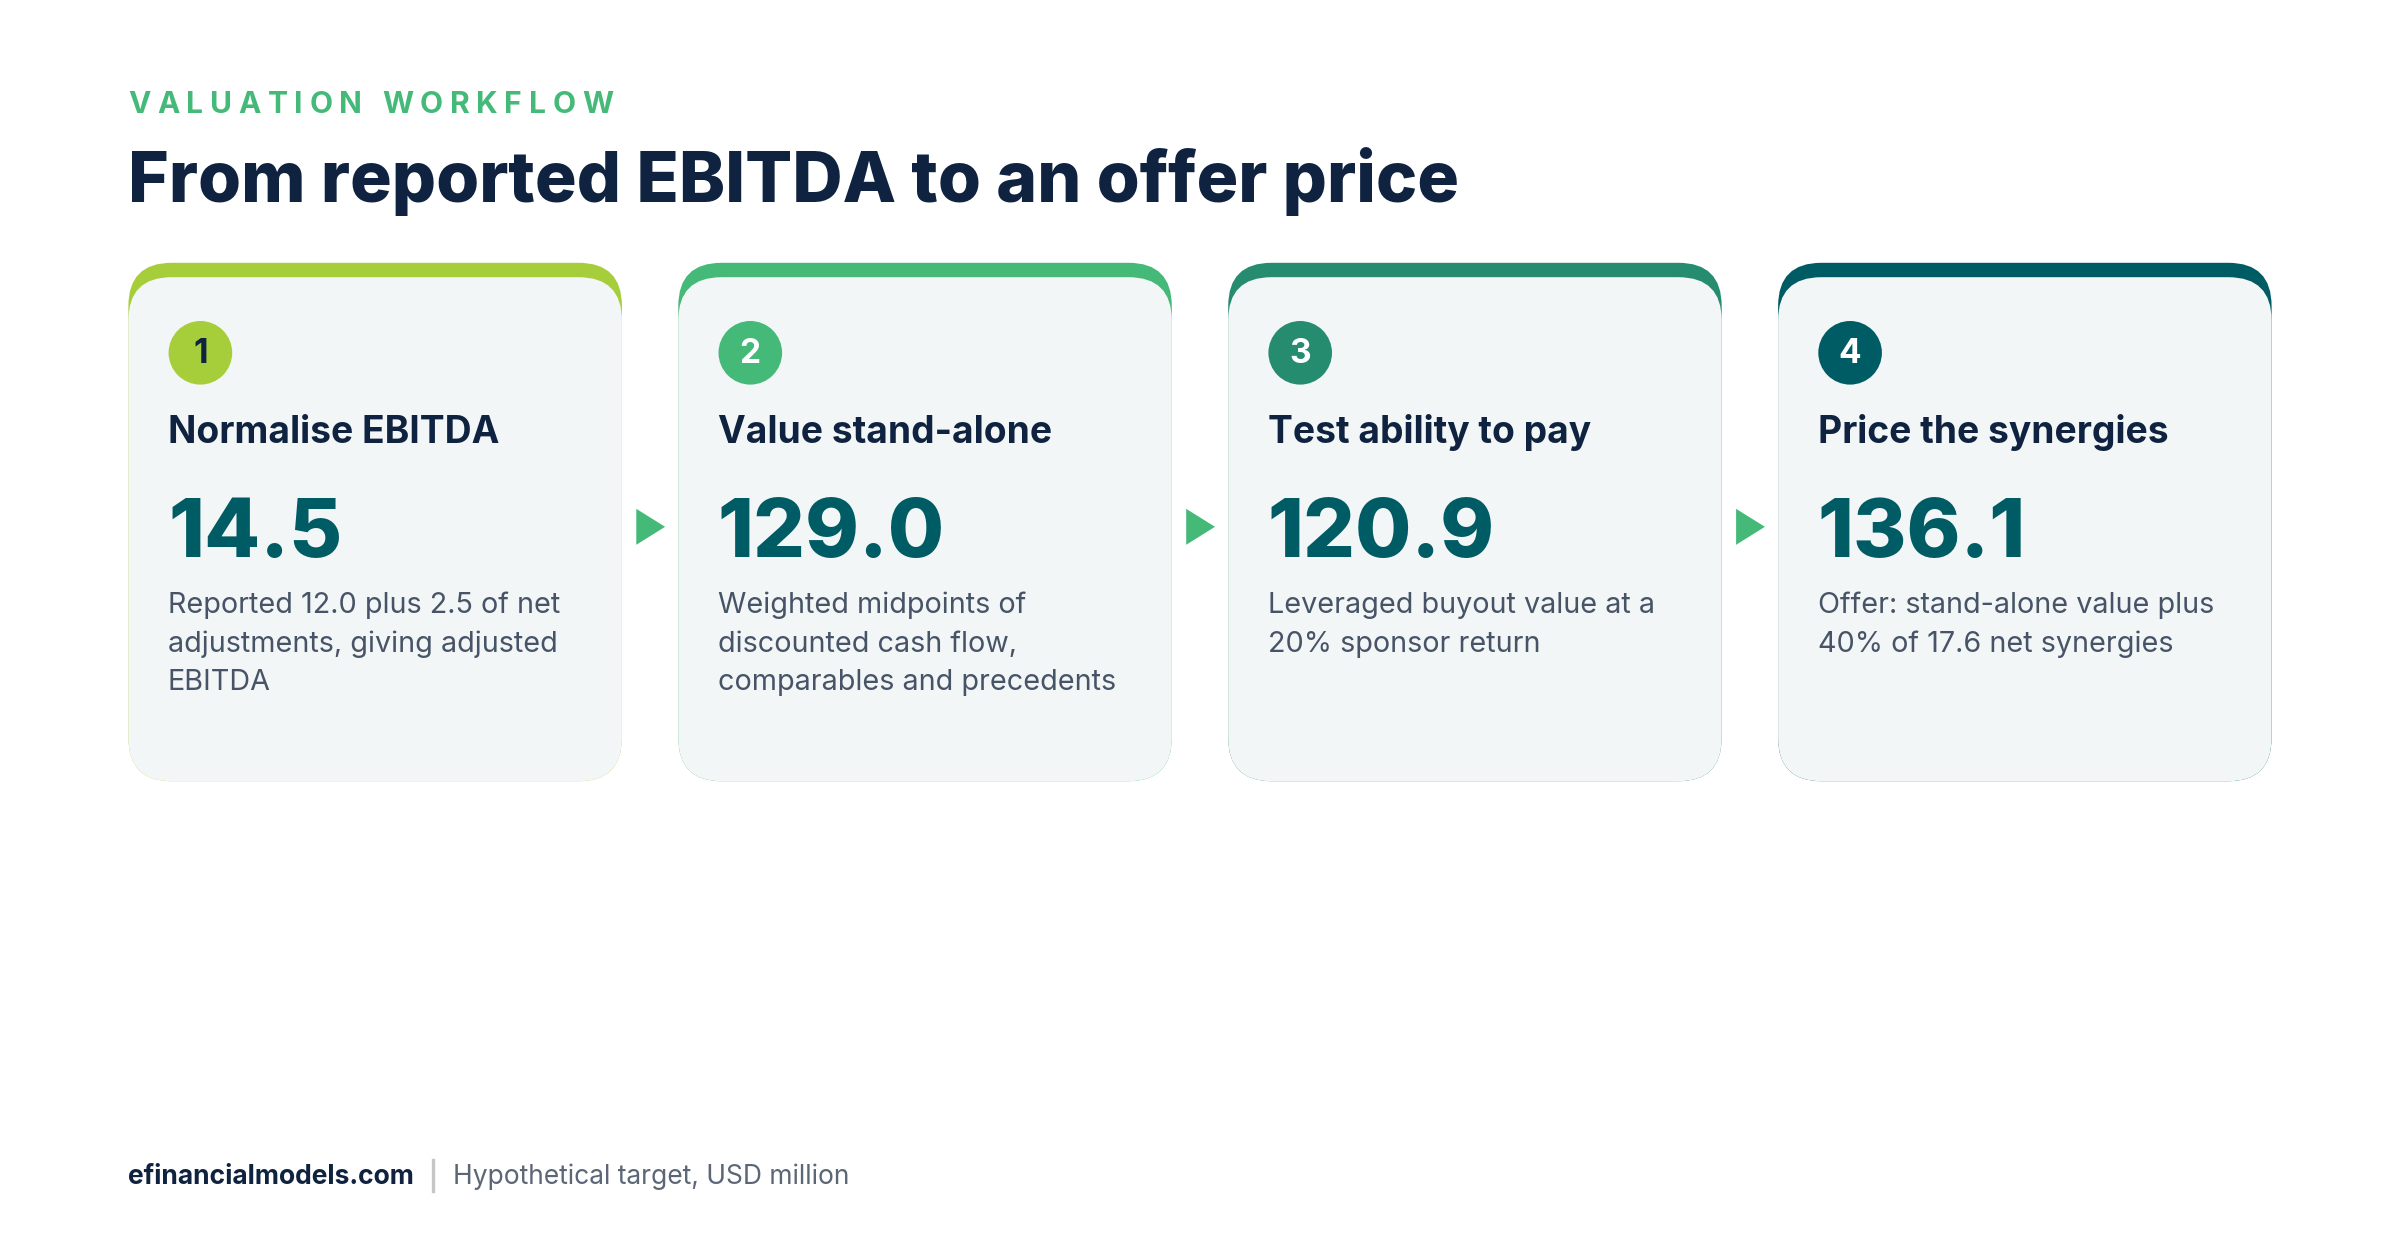
The worked example as a four-step workflow, in USD million. Source: eFinancialModels Analysis
Decide whether to pursue the deal
The decision rule: pursue the acquisition when the offer is at or below the walk-away price, sits inside the precedent range and can be financed. An offer above the DCF and comparables ranges is justified only by synergies the buyer can deliver. Here the offer of USD 136.07 million is above the DCF high (133.0) and the comparables high (130.5), inside the precedent range, and at the top of the leveraged buyout range, where a sponsor would earn roughly 15% instead of 20%. The deal suits a strategic buyer who can deliver the USD 3.0 million of savings; without them, stand-alone value of USD 129.02 million is the ceiling.
Fairness between buyer and seller turns on how the synergy gain is split, so the buyer should document the split before bidding. Tax value differs from price, and the payment structure changes risk. A tax adviser should confirm the structure, a lawyer the contract terms and an independent valuer any fairness opinion.
Frequently Asked Questions
Which valuation method is most reliable for a private company?
No single method wins, which is why buyers triangulate. Discounted cash flow depends on forecast quality, comparables on finding truly similar peers, and precedents on the deal data available. For small private targets, precedent multiples from similar-sized deals and a conservative forecast usually carry the most weight, with the buyout test acting as a ceiling check. Triangulation also exposes outliers: a method far from the others usually points to a flawed input.
How can a buyer pressure-test a valuation before bidding?
A buyer changes one input at a time and watches the output. The most informative tests are the discount rate, terminal growth, the exit multiple and the share of synergies paid away. If a small change in terminal growth swings the answer by more than the gap between offer and walk-away, the price rests on assumptions, and more diligence is needed first.
How should an earn-out or seller note affect the offer price?
An earn-out and a seller note are payments that are deferred or conditional on future performance, so their headline amount overstates what the buyer pays today. A buyer should discount each at a rate that reflects its risk, keep the contingent part separate from the cash paid at closing, and compare the combined present value with the ceiling the analysis supports. A deferred payment also shifts risk to the seller, which can justify a higher headline price for the same value.
Conclusion
A defensible price comes from adjusted EBITDA, four valuation views, an explicit synergy split and a walk-away number set before negotiating. Buyers who want to build the leveraged buyout step in a ready structure can start from the eFinancialModels Private Equity – Leveraged Buyout Model, which includes ten-year projections and IRR analysis.