0 ITEMS

Financial Model Template Checklist: Your First 10 Minutes

Start with the assumptions, enter the drivers next and read the outputs last, because that order turns a blank financial model template into a working model in ten minutes. The eight steps below give the cursor moves for each stage, so a first-time founder or the operator of a physical or service business always knows what to fill in first.
Key Takeaways
- Enter general assumptions first, drivers second and read outputs last, because results mean nothing until every input cell holds a real number.
- Eight steps fit in ten minutes: two minutes each for revenue and cost drivers, and one minute for every other step.
- Ctrl+Home, F5 (Go To) and Ctrl+Arrow, all Excel on Windows shortcuts, jump the cursor to the start, a chosen cell or the edge of the data.
- A check cell, Trace Precedents and one flexed driver confirm the model works before any result is trusted.
- In illustrative month 1, with no tax, interest, equipment or inventory, operating profit is $5,000 for the service business and $3,000 for the physical business.
Fill In Assumptions First, Drivers Second, Outputs Last
The right order is assumptions, then drivers, then outputs. An assumption is a fixed setting, such as the currency or the start month. A driver is an input that moves the results, such as a price or the number of units sold. An output is a result the template calculates, such as revenue or operating profit, which is revenue minus operating costs before interest and tax.
The Financial Modelling Code from the Institute of Chartered Accountants in England and Wales (ICAEW), dated August 2024, tells modellers to segregate inputs, calculations and outputs, and says logic should flow from inputs to calculations to outputs. Outputs recalculate after every entry, so reading them early shows zeros and error messages that look like bugs but are only blank inputs.
A founder with only an idea can still follow the sequence. Enter rough numbers, mark each one as an estimate and replace them as quotes and real sales arrive.
The 10-Minute Plan: Eight Steps in One View
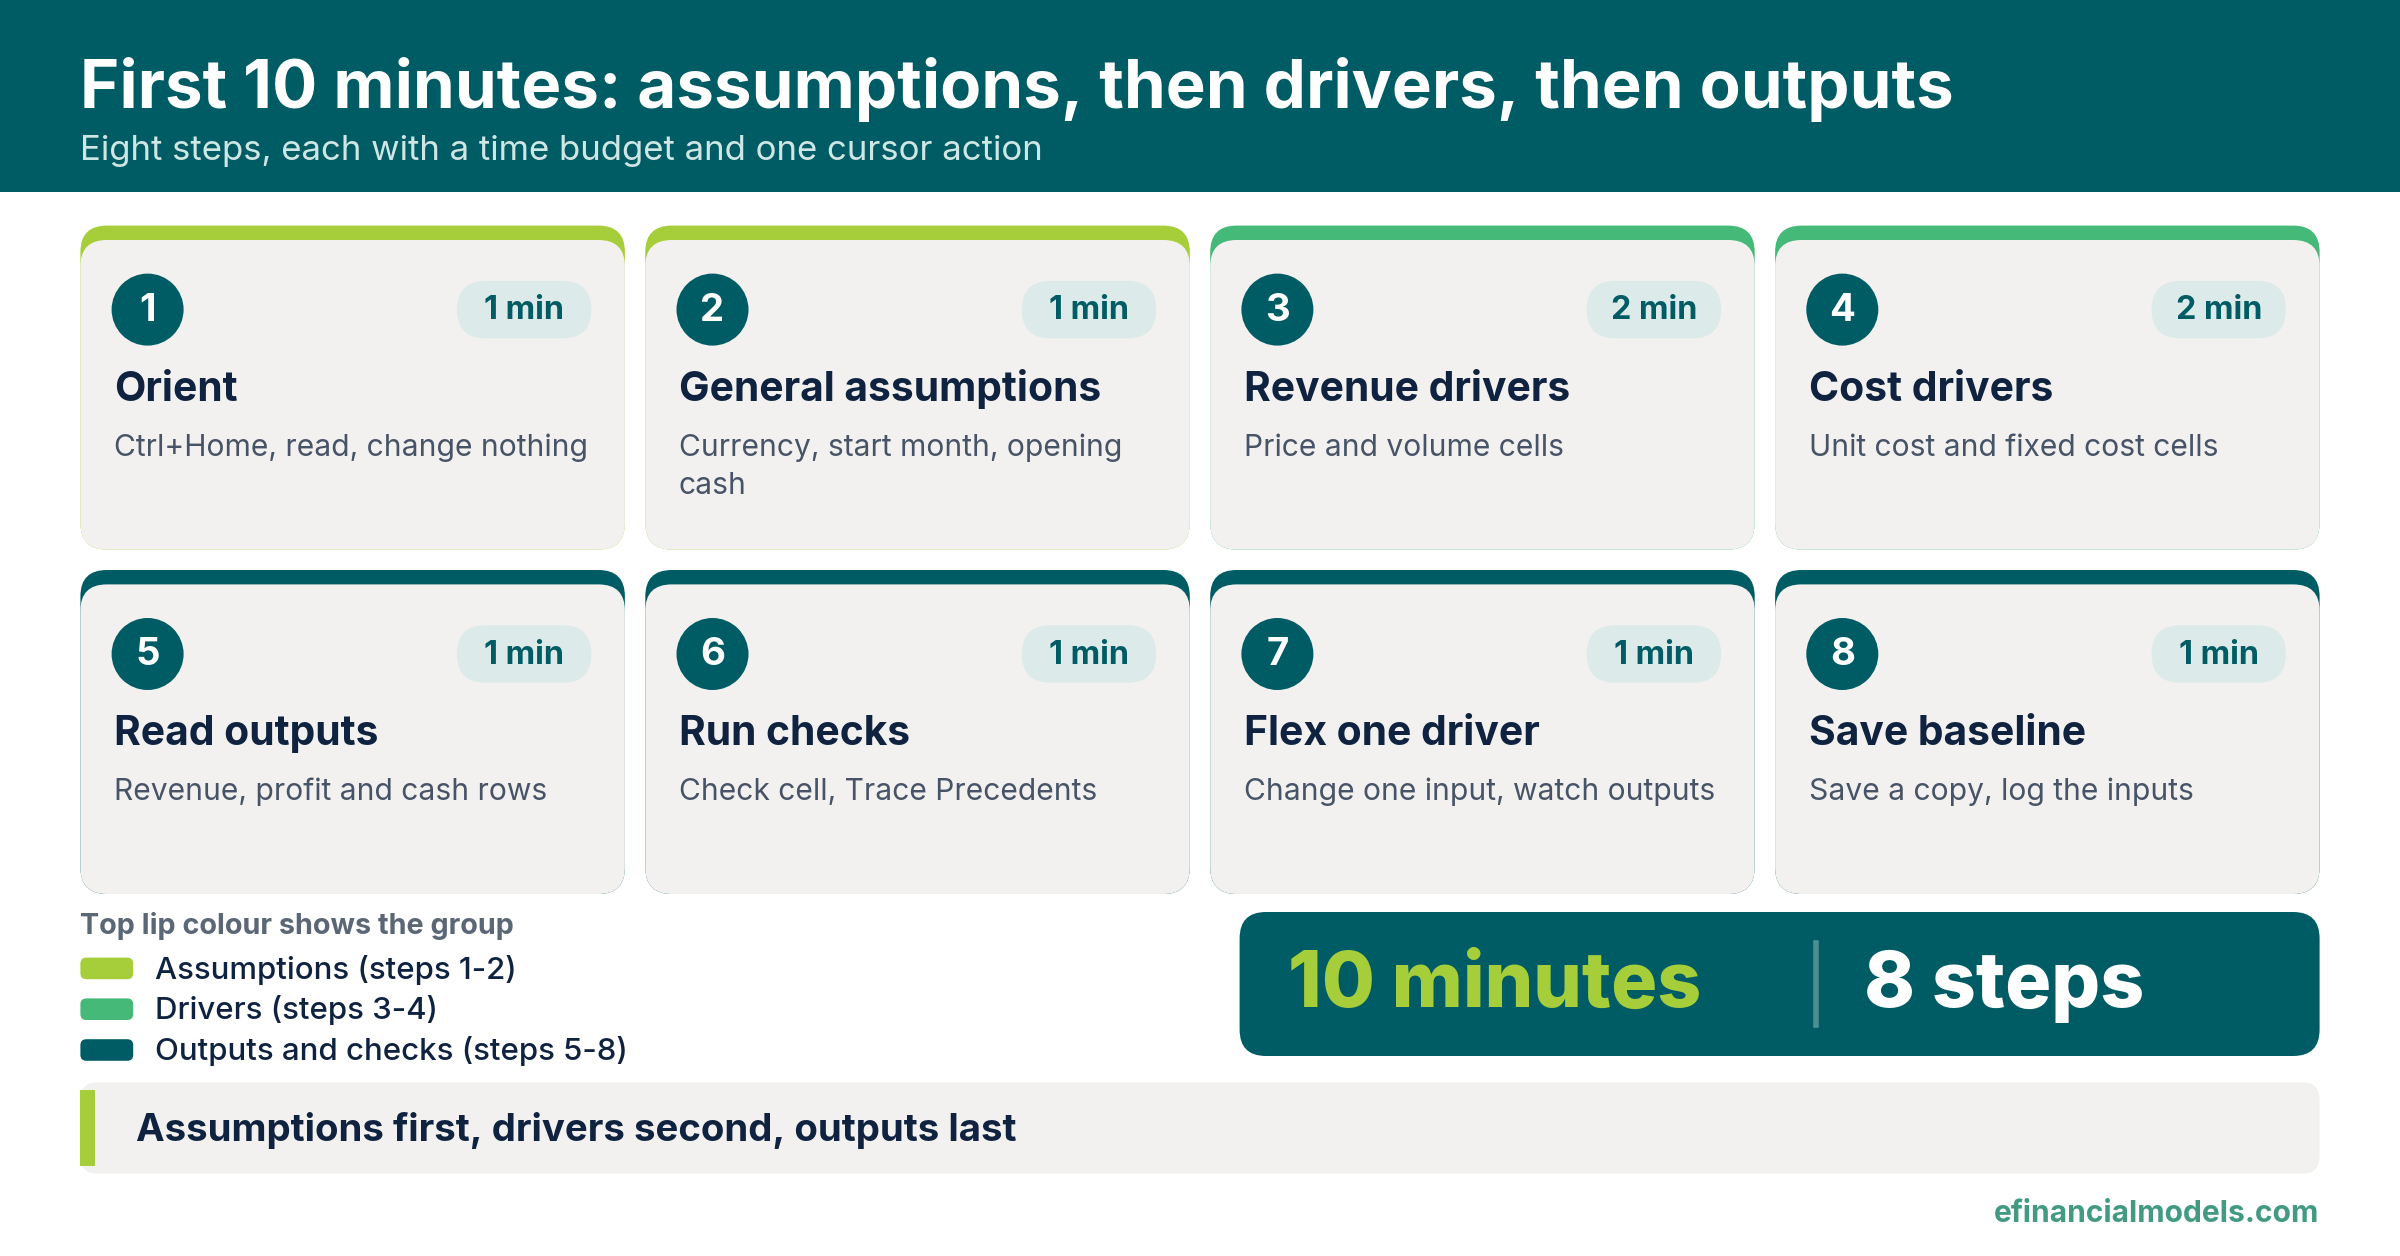
The eight steps in order with the minutes each one takes, drawn by eFinancialModels for this checklist.
| Step | Minutes | Cursor goes to | Enter or check |
|---|---|---|---|
| 1. Orient | 1 | Cell A1 | Read the instructions, change nothing |
| 2. General assumptions | 1 | First settings cell | Currency, start month, forecast length, opening cash |
| 3. Revenue drivers | 2 | Price and volume cells | Selling price, units or hours |
| 4. Cost drivers | 2 | Cost input cells | Unit cost, payroll, fixed overhead |
| 5. Read outputs | 1 | Outputs sheet | Revenue, operating profit, closing cash |
| 6. Run checks | 1 | Check cell | Reads OK, then trace the inputs |
| 7. Flex one driver | 1 | One driver cell | Change it, watch the outputs |
| 8. Save baseline | 1 | Sheet tabs | Dated copy and input log |
Steps 1 to 8: The Cell-by-Cell Checklist
Cell addresses below are generic, so match them to the labels in the open template and look for its shaded input cells. The shortcuts shown are for Excel on Windows, and Mac users can find the equivalents on the same Microsoft shortcuts page.
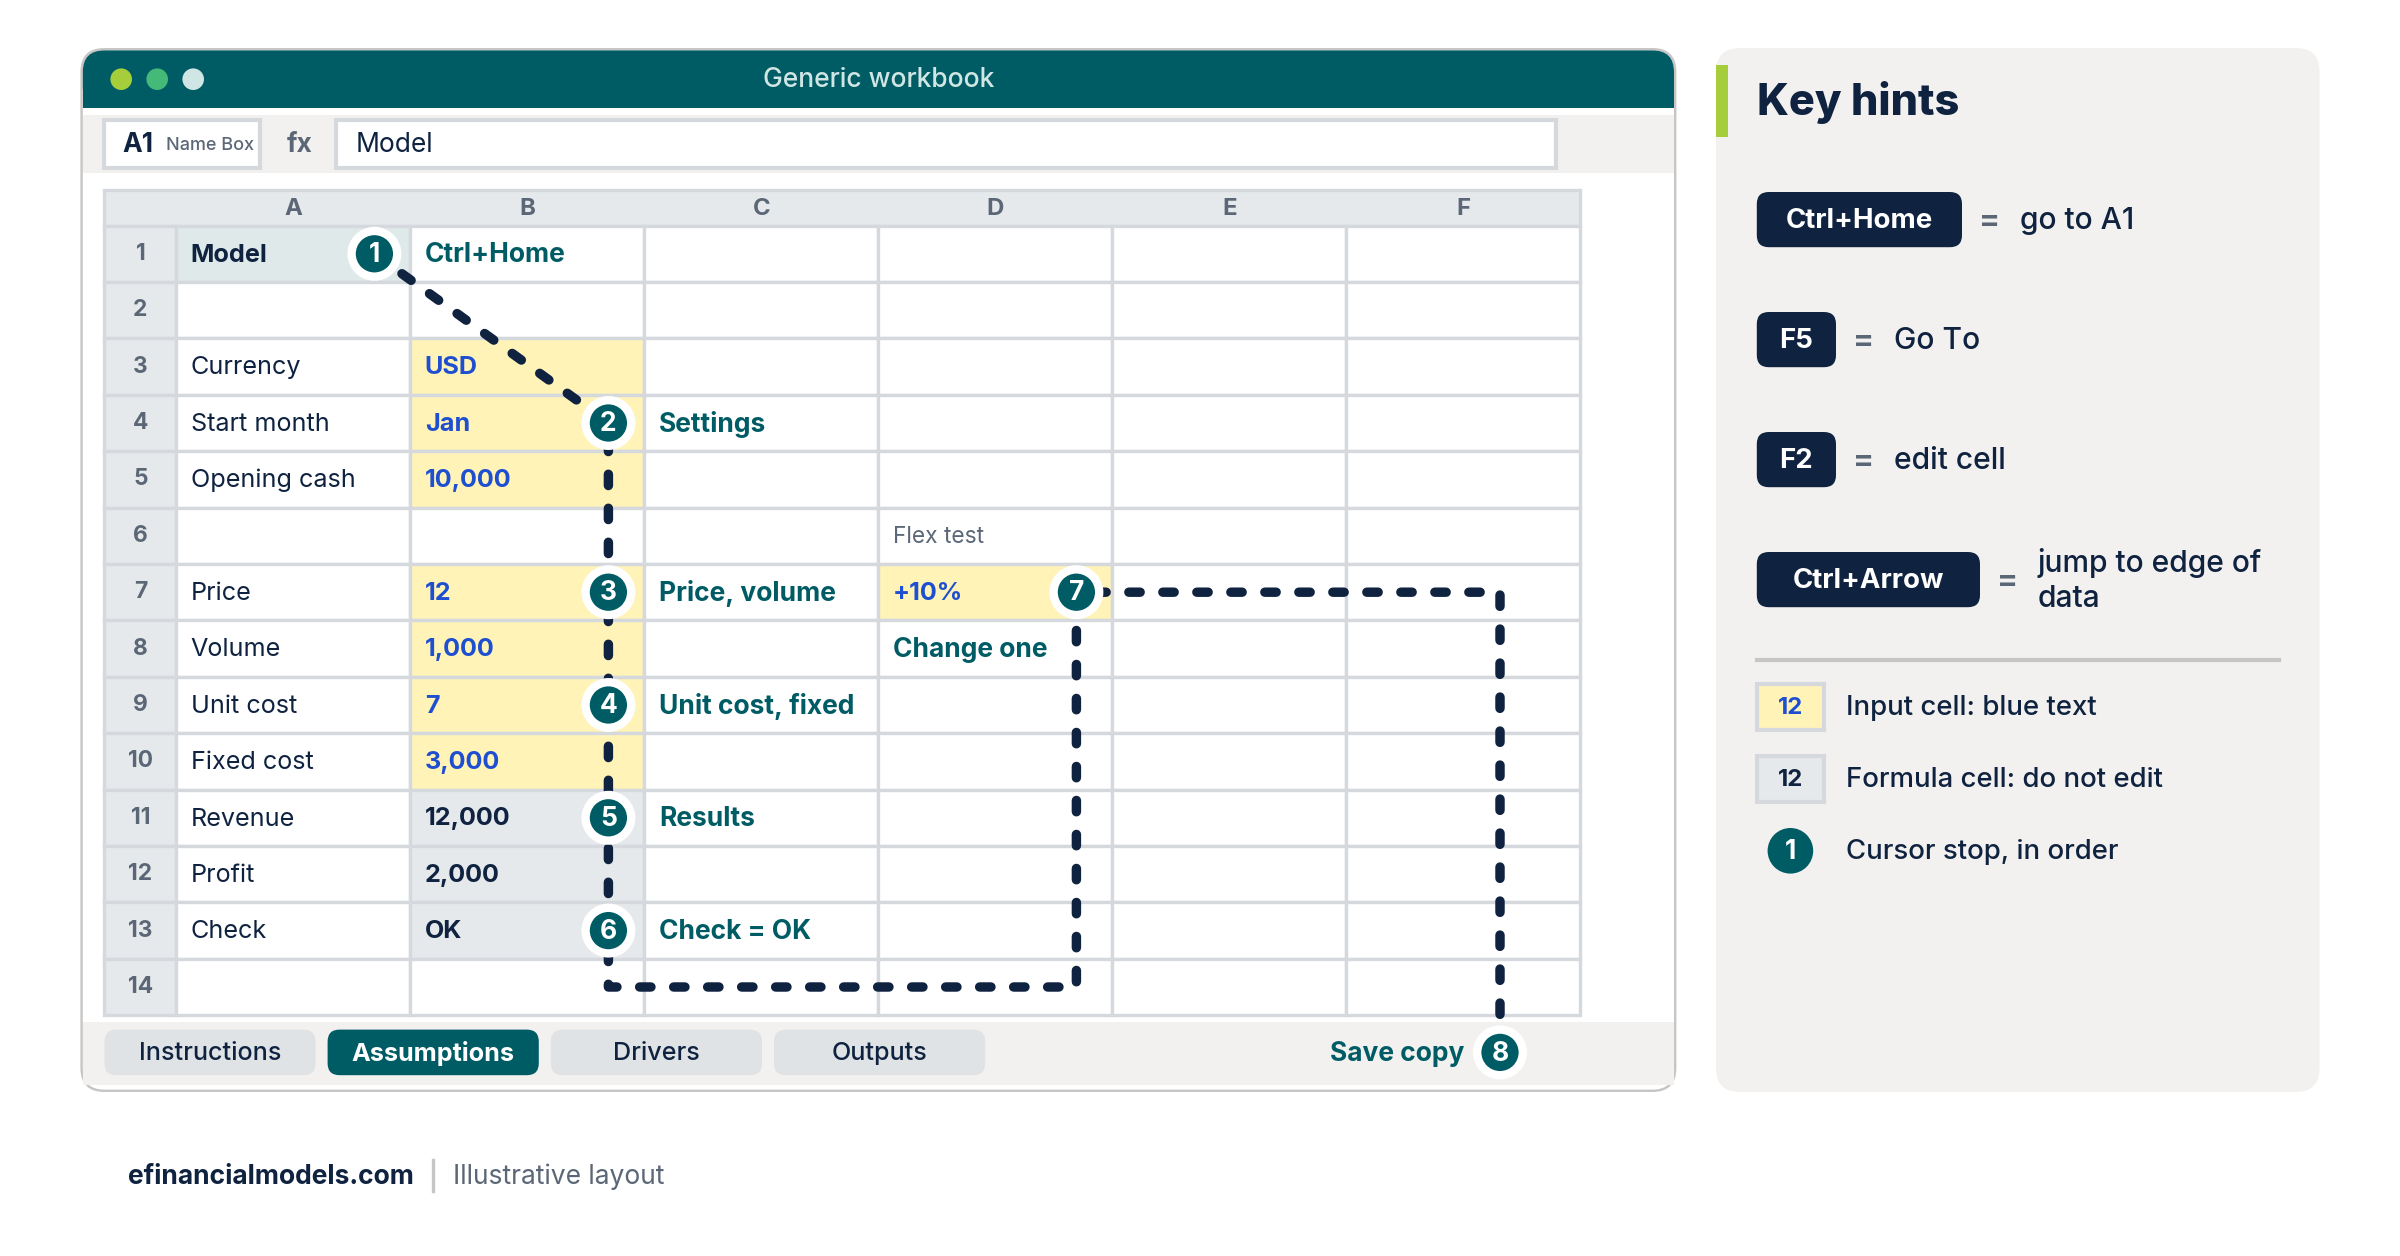
A generic layout, not a specific template: numbered markers follow the cursor from cell A1 to the sheet tabs, where the copy is saved.
Step 1: Orient (1 minute)
Press Ctrl+Home to jump to the beginning of the worksheet. Microsoft publishes the full list of keyboard shortcuts in Excel for every move used below. Read the instruction sheet and the colour legend. Type nothing yet.
Step 2: General assumptions (1 minute)
Press F5 to display the Go To dialog box, type the address of the first settings cell and press Enter. Enter the currency, the start month, the forecast length and the opening cash, which is the money in the bank on the start date. Press F2 to edit a cell that already holds a default value. Where a template applies data validation, a rule that limits what a cell accepts, a dropdown rejects a mistyped month.
Step 3: Revenue drivers (2 minutes)
Move down the price and volume cells one at a time. A service business enters the hourly rate, the billable hours per person and the number of people. A physical business enters the price per unit and the units sold per month. Ctrl+Arrow jumps to the edge of the current data region, which gets the cursor to the last driver in a block quickly.
Step 4: Cost drivers (2 minutes)
Enter the variable cost per unit, the payroll per person and the fixed overhead. Variable costs rise with volume, while fixed costs such as rent and software stay level each month. Where the template names its input cells, the Name Box beside the formula bar shows the name, and names make formulas easier to understand and maintain. Google Sheets also supports named ranges for the same purpose.
Step 5: Read outputs (1 minute)
Click the outputs tab and read three rows only: revenue, operating profit and closing cash. Multiply price by volume on paper, or hourly rate by billable hours by headcount for a service business, and compare the product with the revenue row.
Step 6: Run checks (1 minute)
Find the check cell, which should read OK. If it does not, return to the last input entered and look for a typo or a blank cell. Select one output cell and use Trace Precedents, found in the Formula Auditing group on the Formulas tab, which shows the cells that provide data to the active cell, to confirm the output draws on the drivers just entered.
Step 7: Flex one driver (1 minute)
Lower one driver, such as monthly volume, and watch which outputs move. Then restore the original value. An output that stays frozen after a driver changes signals a typed-over formula.
Step 8: Save baseline (1 minute)
Save a copy with the date in the file name. Record every input value and its source in a notes block, then press Ctrl+Home to return to the start.
Worked Example: The Same Sequence in Two Businesses
In this example, assume every sale is collected and every cost is paid in the same month, with no tax, interest, equipment or inventory build. Under that simplification, closing cash equals opening cash plus operating profit. Real cash flow also moves with payment timing, stock and financing.
Service business inputs and results
| Item | Calculation | Result |
|---|---|---|
| Revenue | 3 consultants × 100 billable hours × $80 per hour | $24,000 |
| Payroll | 3 consultants × $5,000 | $15,000 |
| Fixed overhead | Entered directly | $4,000 |
| Total costs | 15,000 + 4,000 | $19,000 |
| Operating profit | 24,000 − 19,000 | $5,000 |
| Closing cash | Opening cash of $20,000 + 5,000 | $25,000 |
Physical business inputs and results
| Item | Calculation | Result |
|---|---|---|
| Revenue | 500 units × $40 | $20,000 |
| Variable cost | 500 units × $22 | $11,000 |
| Payroll | 2 staff × $2,000 | $4,000 |
| Fixed overhead | Entered directly | $2,000 |
| Total costs | 11,000 + 4,000 + 2,000 | $17,000 |
| Operating profit | 20,000 − 17,000 | $3,000 |
| Closing cash | Opening cash of $15,000 + 3,000 | $18,000 |
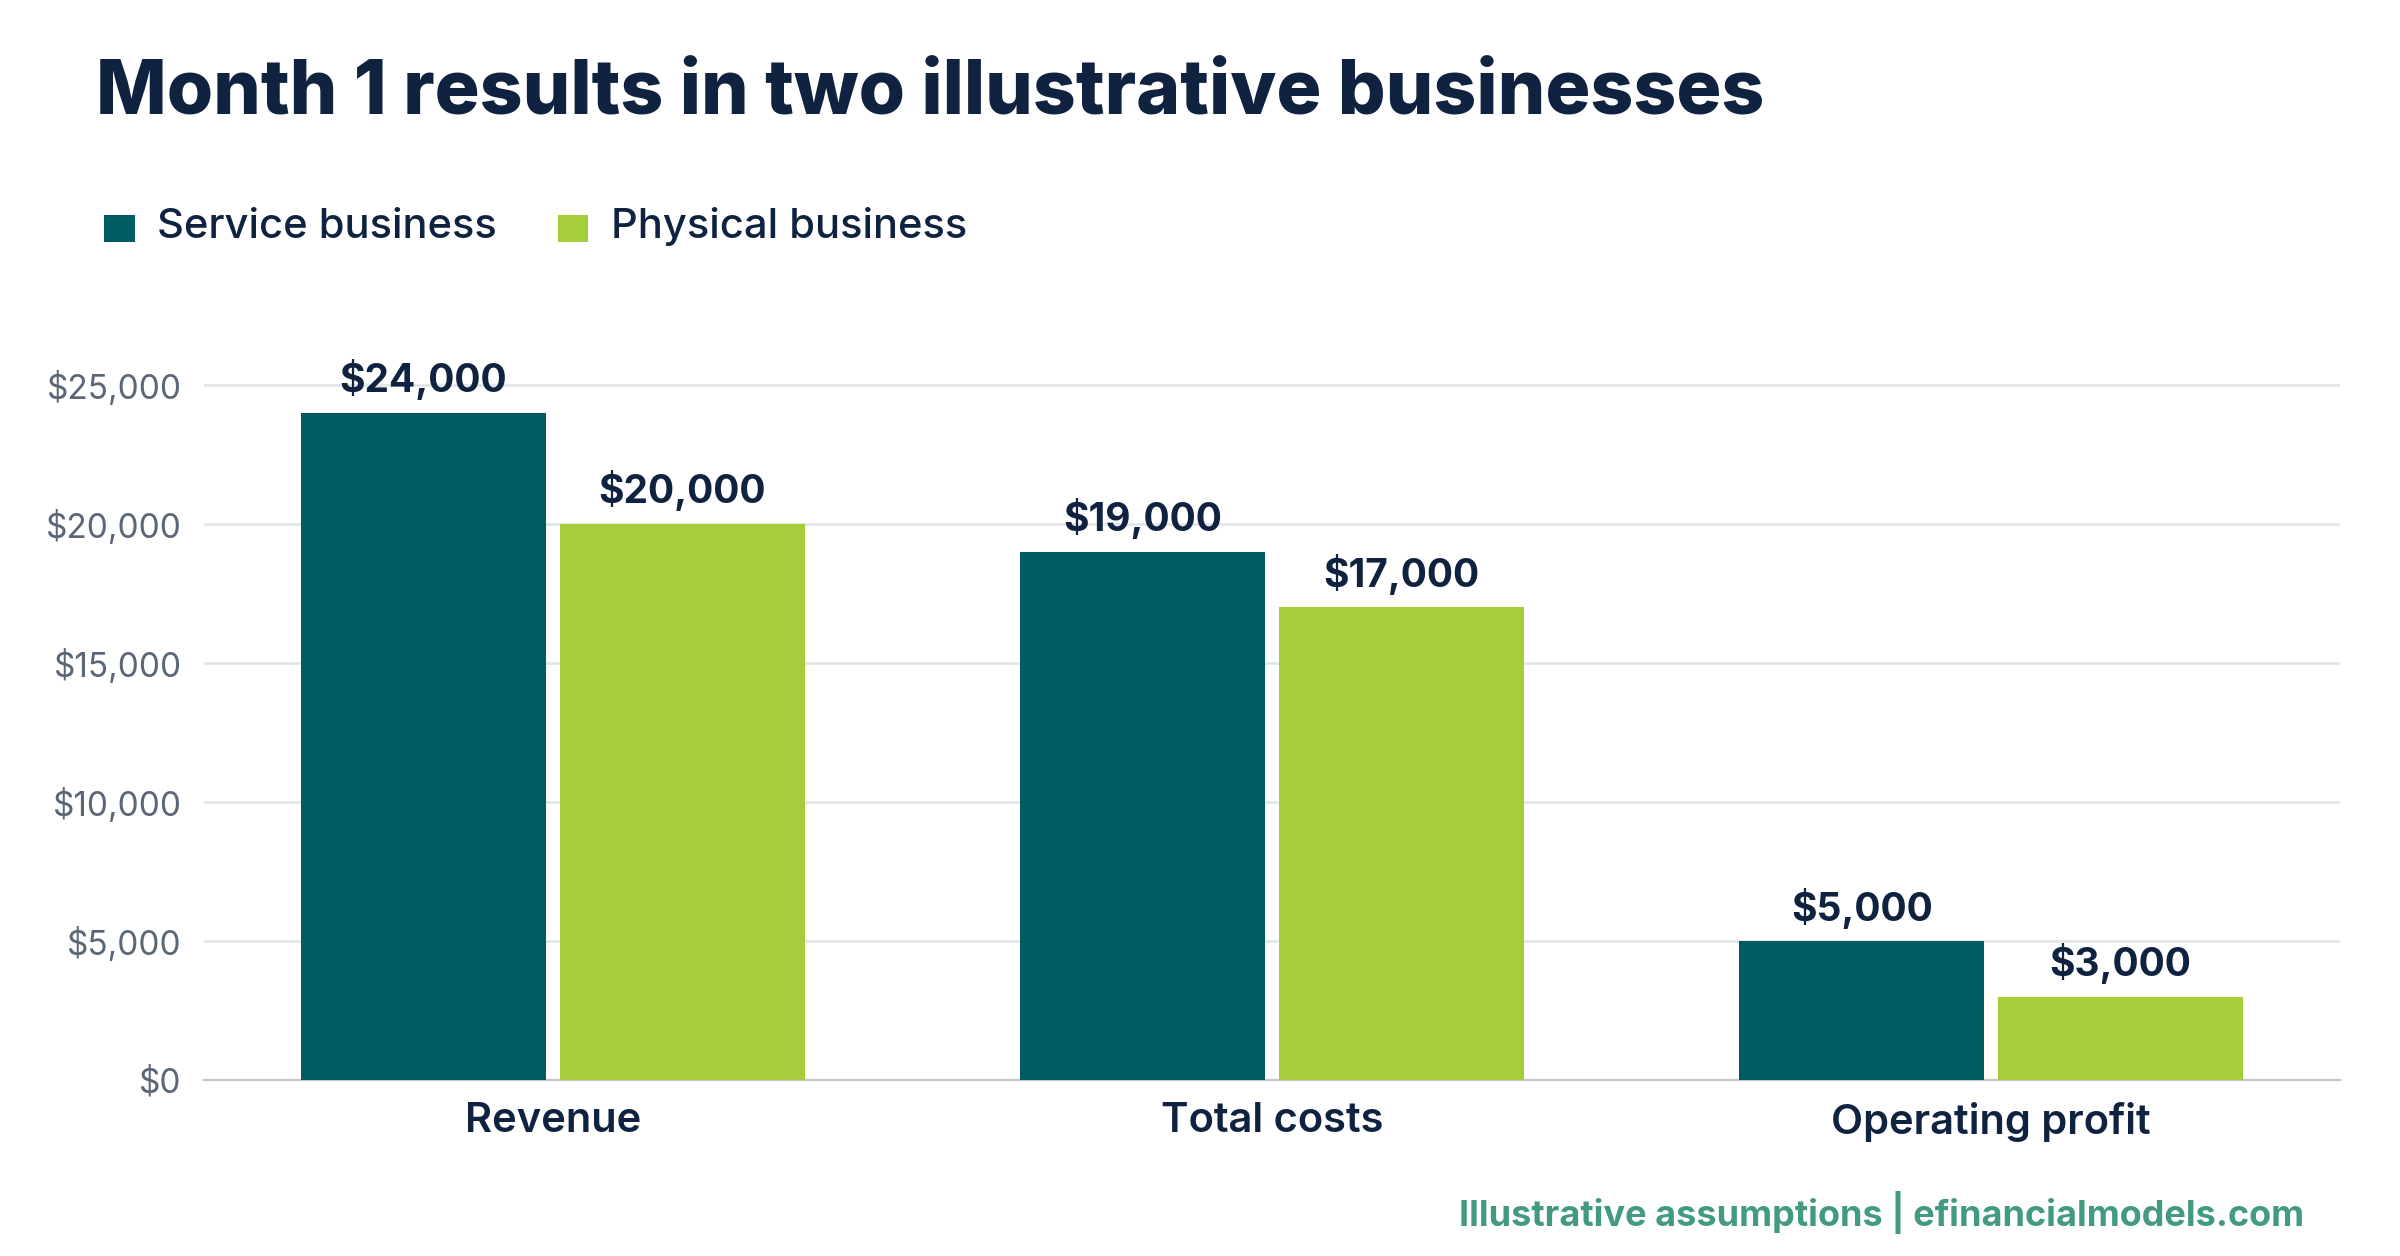
The physical business earns $3,000 of operating profit against $5,000 for the service business, using the same ten-minute sequence.
Step 7 applied to the physical business shows the effect of volume. In a flexed case that cuts volume from 500 to 450 units, revenue falls by 50 × $40 = $2,000 and variable cost falls by 50 × $22 = $1,100, so operating profit falls by 2,000 − 1,100 = $900 from the base case.
The same step applied to the service business cuts billable hours from 100 to 90 per consultant. Revenue falls by 3 × 10 × $80 = $2,400 while costs stay unchanged, so operating profit falls by $2,400 from the base case.
Why Cash Planning Comes First, and What Can Wait
Cash planning comes first because cash pressure is common. In the Federal Reserve Banks’ 2025 Small Business Credit Survey, a convenience sample of U.S. small employer firms, 56% cited paying operating expenses, and 51% cited uneven cash flows, as challenges. That is why opening cash and costs come early here.
The same 2025 Small Business Credit Survey reports that among firms applying for financing, 41% received all the financing they sought, 36% received some and 24% received none, which makes a clean baseline model useful before any application.
A founder without sales history can leave optional blocks, such as loans and equipment, at their defaults and return to them once the core drivers look sensible. Founders can browse startup financial models. Operators of a service business can start from service business templates, while retail and other physical businesses can start from retail templates.
Tax treatment, company valuation and lender or investor claims fall outside a first session. An accountant or financial adviser should review those before the numbers leave the building.
Frequently Asked Questions
Can an output cell be typed over to hit a target number?
No. Output cells hold formulas, and typing a number into one cuts its link to the drivers, so later changes stop flowing through. A target result is reached by changing a driver instead. Excel’s Goal Seek tool, found under What-If Analysis on the Data tab, adjusts one input until a chosen formula cell reaches the target value, and it leaves every formula intact.
What if the template has no check cell?
Build a simple one beside the outputs. Add the monthly revenue figures with a sum formula, compare the result with the annual revenue total, and display OK when the difference is zero. Any reconciliation of two figures that must agree works the same way. A check that never fails is still useful, because a later accidental edit will trip it immediately and point to the damage.
How many inputs should a first session cover?
Only the inputs the three output rows need. Optional sections such as loan schedules, equipment purchases and seasonal profiles can sit at their defaults until the core numbers look sensible. Adding sections gradually makes errors easy to locate, because each new block is the only recent change. A complete input log can grow over the first few weeks as better data arrives.
Does the sequence change in Google Sheets?
The sequence stays the same, because assumptions, drivers and outputs describe the model, not the software. Only the shortcuts and menus differ. Google Sheets handles named inputs through its Named ranges panel, and an arrow-key walk through the shaded cells replaces the Go To dialog. Keep the same dated baseline copy through the File menu so every later change has a fixed reference point.
When should an accountant review the model?
Review comes after the baseline copy exists and before any number reaches a lender, investor or tax filing. Hand over the input log with a source beside every value, because a reviewer can then challenge assumptions rather than reverse-engineer them. Treat the first session as a working draft that proves the template runs, not as advice on tax or company valuation.
Conclusion
A template becomes a model when assumptions go in first, drivers second, and outputs are read only after the checks pass. Founders and operators who want a workbook that already follows this order can open the eFinancialModels Monthly Budget Template (with Financial Statements), which is organised into Instructions, Assumptions, Budget and Summary sheets.