
0 ITEMS

Acquisition Modeling Playbook: Buy a Business Right
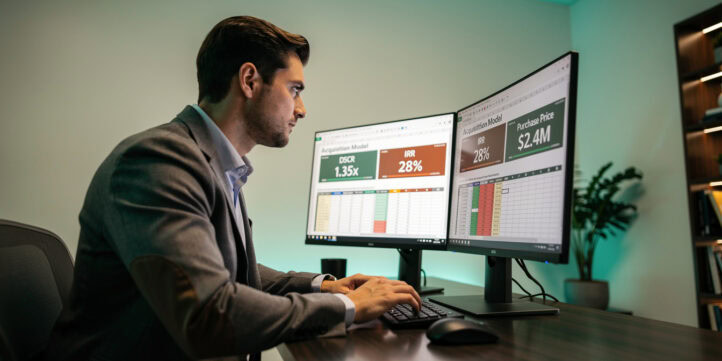
Buying an existing business is one of the fastest paths to ownership, but a bad model costs you the deal, the loan, or both.
Key Takeaways
- 99% of SBA 7(a) acquisition loans require a Debt Service Coverage Ratio (DSCR) of at least 1.25x before a lender will approve funding.
- A complete acquisition model has 7 distinct components: historical normalization, pro forma projections, purchase price allocation, debt schedule, DSCR, IRR, and sensitivity analysis.
- The SBA 7(a) program guaranteed $27.5 billion in loans in fiscal year 2023, making it the dominant financing vehicle for small business acquisitions according to the U.S. Small Business Administration.
- Buyers who skip seller add-back normalization routinely overpay by 15-30% because they model inflated EBITDA (earnings before interest, taxes, depreciation, and amortization).
- A 5-year hold with a 3.0x equity multiple translates to roughly a 25% IRR — a useful benchmark for evaluating whether a deal is worth pursuing.
- Sensitivity analysis on just two variables, revenue growth and gross margin, captures more than 80% of valuation risk in most small business acquisitions.
- Downloadable SBA underwriting templates cut model-build time from 20+ hours to under 4 hours for experienced analysts.
What Is an Acquisition Model and Why Does It Matter?
An acquisition model is a structured financial spreadsheet that combines a target company’s historical financials, normalized earnings, projected cash flows, and deal financing to answer one question: does this deal make economic sense? Without it, you’re negotiating blind.
Lenders, private equity sponsors, and independent buyers all use acquisition models, but the structure differs by buyer type. An SBA borrower needs a DSCR model. A strategic acquirer needs an accretion/dilution analysis. A search fund operator needs an IRR waterfall. This playbook covers all three, with the SBA path as the primary focus because it applies to the largest share of small business buyers.
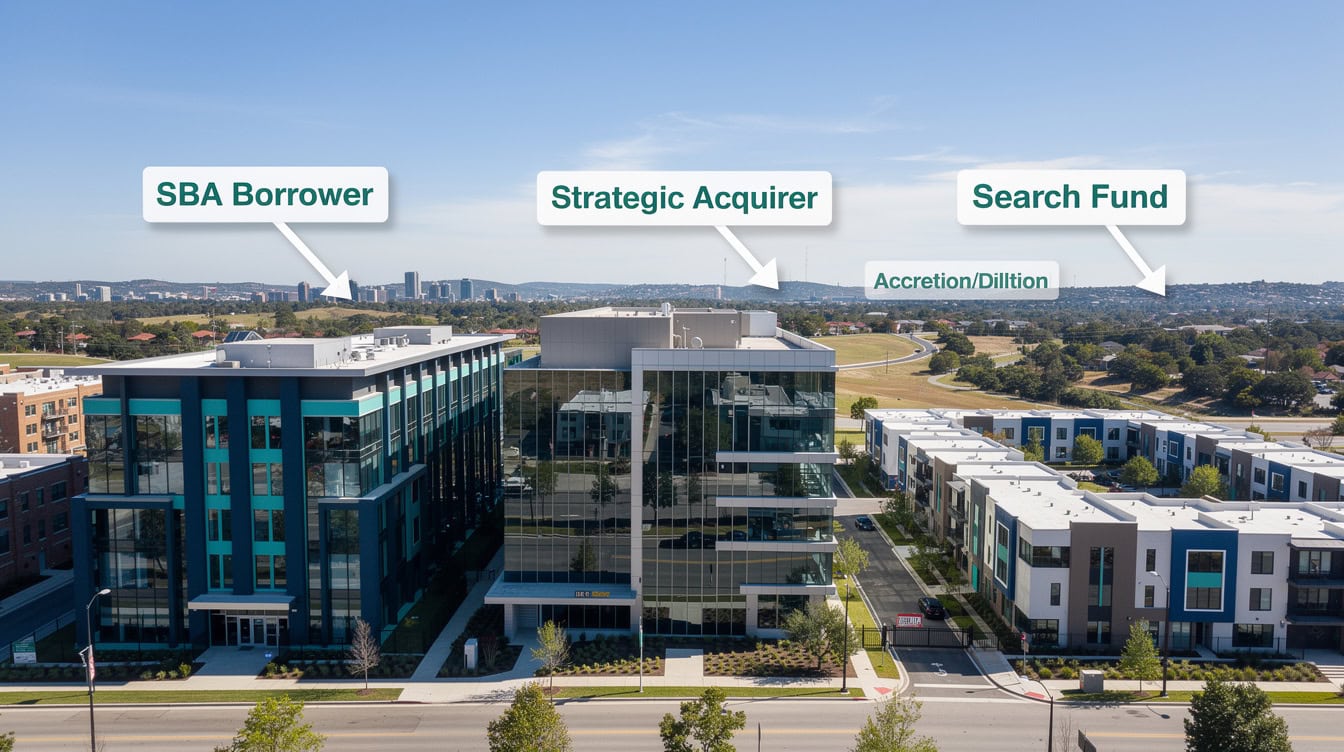
Different buyers optimize for different metrics — but all three models start with the same normalized EBITDA foundation.
Step 1: Normalize the Seller’s Historical Financials
Normalization means adjusting the seller’s reported income statement to reflect true, recurring business earnings — stripping out one-time items and owner-specific expenses. This is the single most important step in the entire acquisition modeling process.
Common add-backs include owner compensation above market rate, personal vehicle expenses, family payroll, one-time legal fees, and non-recurring repairs. For example, if the seller pays themselves $350,000 but a replacement manager costs $120,000, you add back $230,000 to EBITDA.
Here’s the math on a simple normalization:
- Reported net income: $180,000
- Add back: excess owner comp ($230,000)
- Add back: personal auto ($18,000)
- Add back: depreciation ($42,000)
- Adjusted EBITDA: $470,000
That $470,000 is your starting point for every downstream calculation. Getting it wrong by even 10% shifts your valuation by a full turn of EBITDA.

Normalization adds $290K to EBITDA in this example — a difference that shifts the valuation by over $1M at a 4x multiple.
Step 2: Build the Pro Forma Projections
Pro forma projections (forward-looking financial statements) translate normalized historical performance into expected future cash flows. Most SBA lenders want to see 3 years of projections; private equity buyers typically model 5 years.
Start with a revenue build: units sold or customers served, multiplied by average transaction value. Then layer in cost of goods sold (COGS), operating expenses, and capital expenditure (capex) requirements. Keep assumptions explicit and tied to industry benchmarks where possible.
The U.S. Bureau of Labor Statistics publishes industry-level wage data that anchors your labor cost assumptions to real market rates. For a retail pharmacy acquisition, pharmacist wages average $132,750 per year according to the Bureau of Labor Statistics, which directly affects your staffing cost line.
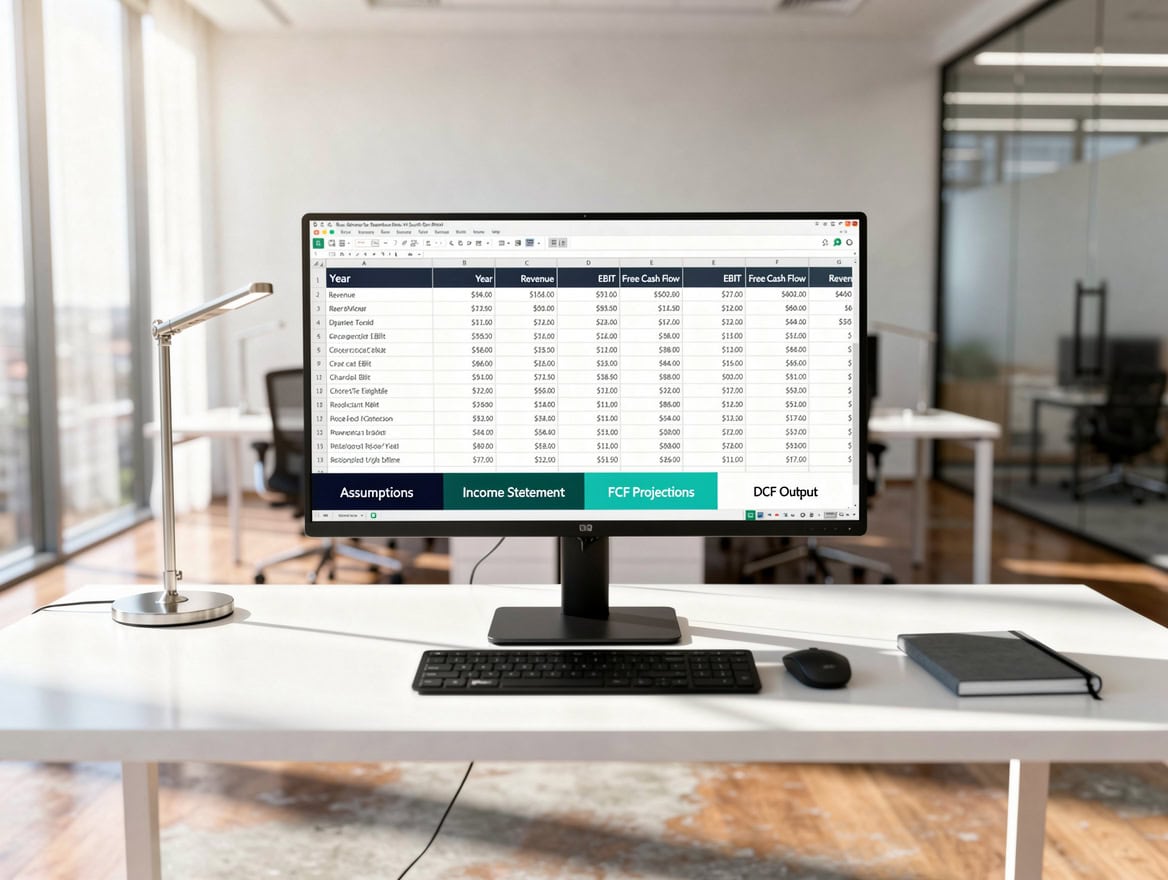
Anchoring labor cost assumptions to BLS wage data makes your pro forma defensible to lenders and investors.
Step 3: Structure the Purchase Price and Financing
The purchase price allocation (PPA) determines how the deal value is split between tangible assets, intangible assets (like customer lists and goodwill), and assumed liabilities. This matters for tax purposes and for the amortization schedule that flows into your income statement.
For SBA 7(a) deals, the standard structure is 10% buyer equity injection, up to 90% SBA-guaranteed debt. The SBA maximum loan amount is $5 million per the SBA’s standard 7(a) program guidelines. Deals above that threshold require conventional financing or seller notes to bridge the gap.
A typical small business acquisition financing stack looks like this:
| Component | % of Deal | Notes |
|---|---|---|
| SBA 7(a) Loan | 80-90% | 10-year term, prime + 2.75% |
| Seller Note | 5-10% | Often on standby for 24 months |
| Buyer Equity | 10% | Minimum SBA requirement |
| Total | 100% | Must sum to purchase price |

The SBA 7(a) program covers up to 90% of the purchase price, making it the most accessible financing vehicle for small business buyers.
Step 4: Build the Debt Schedule and Calculate DSCR
The debt schedule (a table tracking loan balance, interest, and principal payments over time) feeds directly into your DSCR calculation. DSCR is the ratio of annual net operating income to total annual debt service (principal plus interest). A DSCR below 1.0x means the business cannot cover its own loan payments.
Here’s a worked DSCR example:
- Adjusted EBITDA (Year 1): $470,000
- Less: taxes (25%): ($117,500)
- Less: capex: ($30,000)
- Net Operating Income: $322,500
- Annual debt service (SBA loan, $2M at 10.5%, 10 years): $328,000
- DSCR: $322,500 / $328,000 = 0.98x
This deal fails the 1.25x DSCR test. The buyer has three options: negotiate a lower purchase price, increase the equity injection to reduce debt service, or demonstrate a credible revenue growth case that lifts Year 2 DSCR above 1.25x.
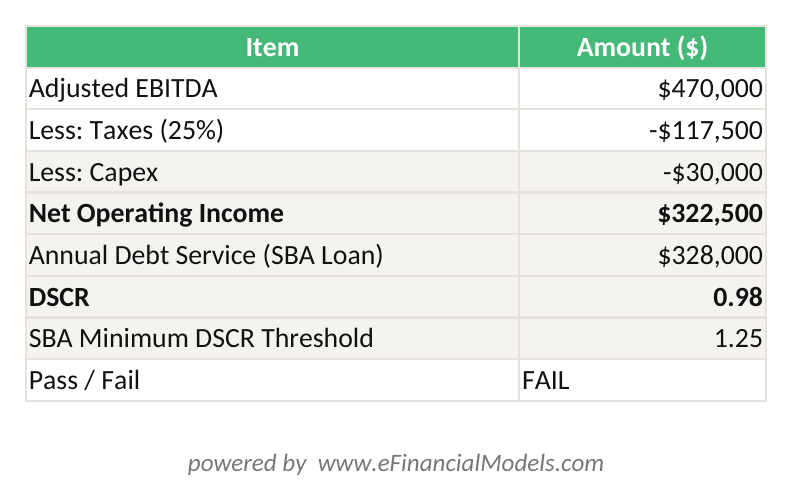
DSCR = Net Operating Income / Annual Debt Service. This example shows a failing DSCR of 0.98x that requires deal restructuring before SBA submission.

A DSCR of 0.98x fails the SBA’s 1.25x threshold — this deal needs a lower price, more equity, or a credible growth case.
Step 5: Calculate IRR and Equity Multiple
IRR (Internal Rate of Return) is the annualized return on your equity investment, accounting for the timing of cash flows. Equity multiple is simpler: total cash returned divided by cash invested. Both metrics matter because IRR can look great on a short hold even if the absolute dollar return is small.
For a worked IRR example, assume:
- Equity invested at close: $250,000 (10% of $2.5M purchase price)
- Annual cash distributions (Years 1-5): $60,000 per year
- Exit at Year 5 at 4.0x EBITDA: $1,880,000 (net of remaining debt)
- Total cash returned: $300,000 (distributions) + $1,880,000 (exit) = $2,180,000
- Equity multiple: $2,180,000 / $250,000 = 8.7x
- IRR (calculated via Excel’s IRR function on the cash flow series): approximately 47%
Excel’s IRR function accepts up to 29 cash flow values beyond the initial investment according to Microsoft’s documentation, which is more than sufficient for a standard 5-year acquisition hold model. You can explore multi-project IRR comparisons using the IRR modeling with multiple projects template to stress-test different hold periods and exit multiples side by side.
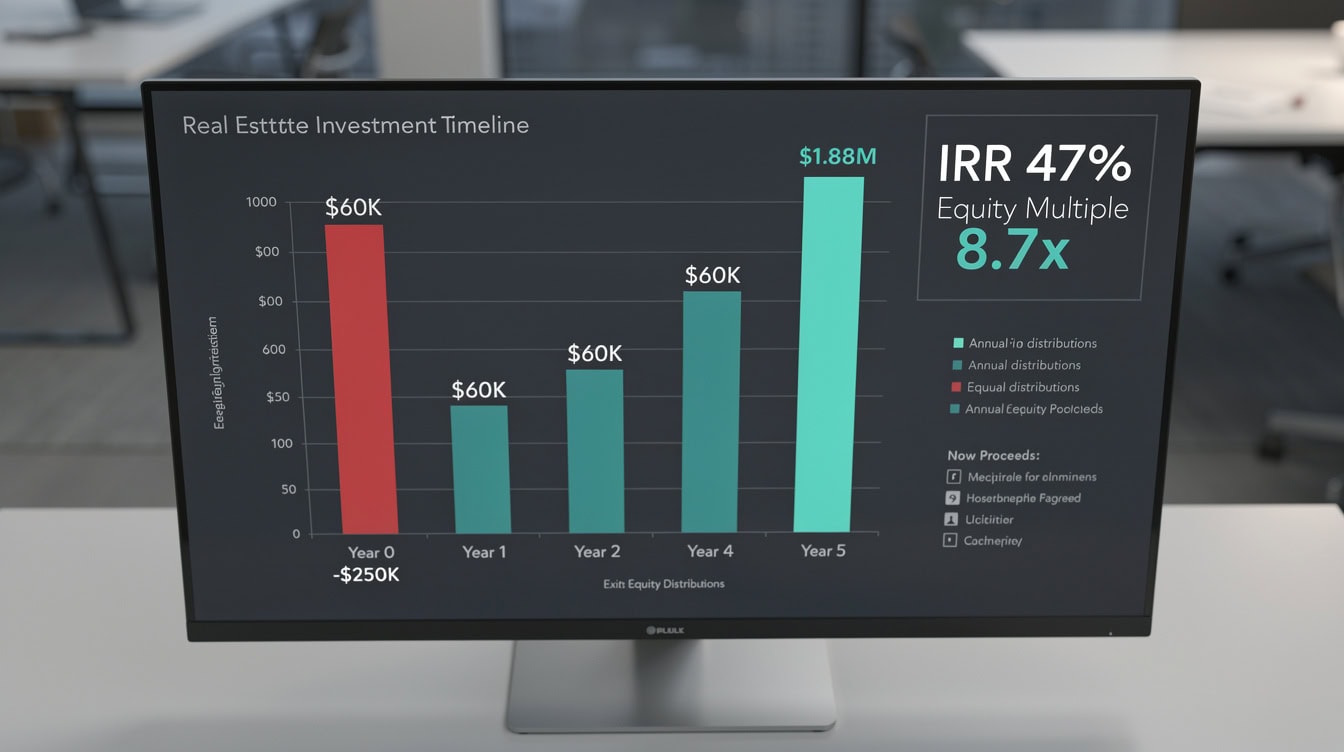
An 8.7x equity multiple over 5 years sounds exceptional — always cross-check with IRR to confirm the timing of returns justifies the risk.
Step 6: Run Sensitivity Analysis
Sensitivity analysis tests how your key outputs (DSCR, IRR, equity multiple) change when your assumptions shift. Build a two-variable data table in Excel: revenue growth on one axis, EBITDA margin on the other. This gives you a grid of DSCR outcomes across 25 scenarios in seconds. Excel’s data table feature supports up to 2 input variables in a single What-If Analysis according to Microsoft’s support documentation, making it the most efficient tool for building this kind of sensitivity grid.
For most small business acquisitions, the two variables that move the needle most are top-line revenue growth and gross margin. A 5-percentage-point drop in gross margin on a $2M revenue business wipes out $100,000 in EBITDA, which can flip a passing DSCR to a failing one.
| Revenue Growth | 30% Margin | 35% Margin | 40% Margin |
|---|---|---|---|
| 0% | 0.91x | 1.18x | 1.45x |
| 3% | 1.02x | 1.31x | 1.60x |
| 5% | 1.10x | 1.40x | 1.71x |
| 8% | 1.22x | 1.54x | 1.87x |
The green zone (DSCR above 1.25x) only appears at 35%+ margins or 5%+ growth. That’s your negotiating map.
Only 6 of 12 scenarios clear the 1.25x DSCR threshold — sensitivity analysis reveals exactly where the deal breaks.
Step 7: Stress-Test with a Downside Case
Every acquisition model needs a downside scenario, not just a base case. Model a 15-20% revenue decline in Year 1 (common during ownership transitions) and check whether the business still covers debt service. If it doesn’t survive a 15% revenue drop, the deal structure is too aggressive.
The Federal Reserve’s 2023 Small Business Credit Survey found that 43% of small businesses reported difficulty meeting financial obligations in the prior 12 months according to the Federal Reserve, underscoring how quickly cash flow can deteriorate post-acquisition. Build that fragility into your model before you sign the LOI (Letter of Intent).
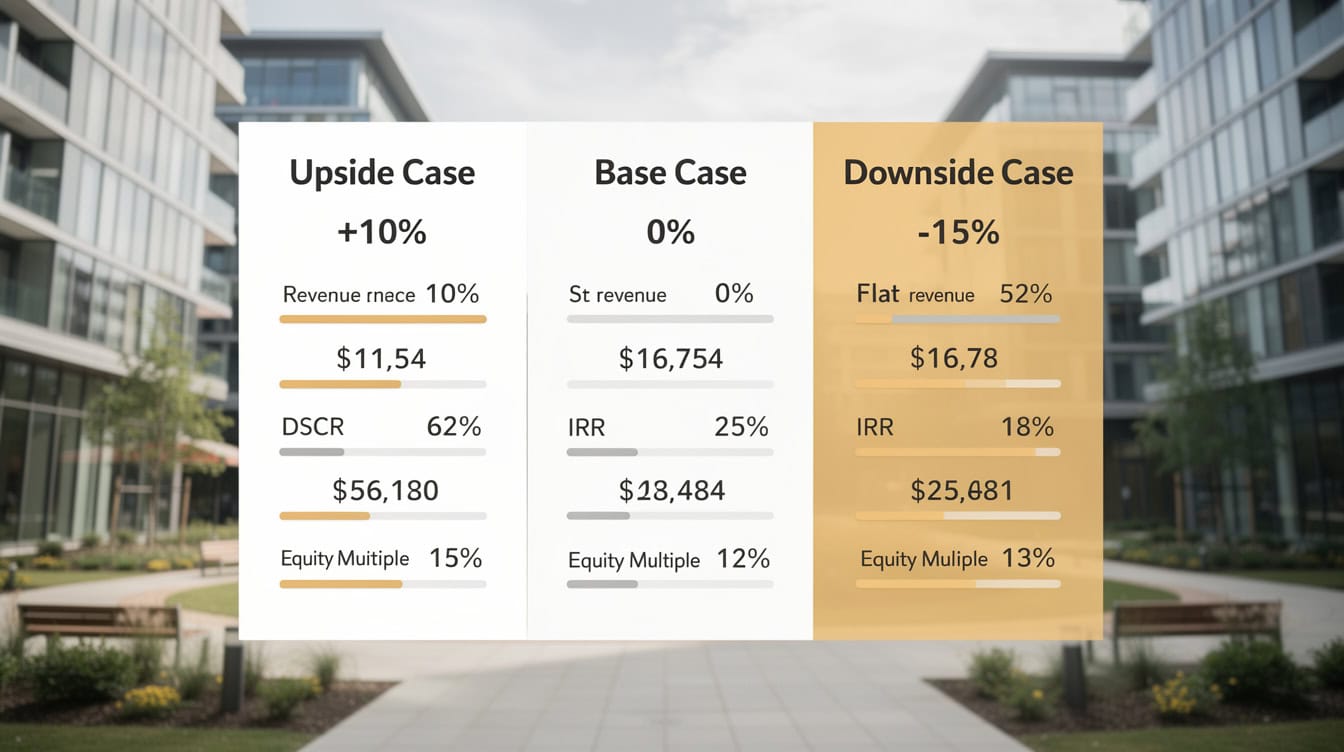
A deal that can’t survive a 15% revenue decline in Year 1 is too aggressively structured — the downside case is not optional.
Acquisition Model Templates: What to Use
Building an acquisition model from scratch takes 20-40 hours for an experienced analyst. Purpose-built templates cut that to under 4 hours and ensure you don’t miss critical components like purchase price allocation or the SBA standby note structure.
For industry-specific deals, sector templates are worth the investment:
- Retail pharmacy acquisitions: The Independent Retail Pharmacy Acquisition SBA Underwriting Financial Model includes pre-built Rx volume drivers, DIR fee adjustments, and DSCR outputs formatted for SBA lender submission.
- General business acquisitions: The 3 Statement Modeling + Valuation template links income statement, balance sheet, and cash flow statement with integrated DCF and comparable company valuation.
- M&A deals: The Mergers and Acquisition Financial Model handles accretion/dilution analysis, synergy modeling, and pro forma combined financials.
- Accounting or bookkeeping firm acquisitions: The Accounting/Bookkeeping/Tax Firm Acquisition SBA Underwriting Model is purpose-built for recurring-revenue professional services deals.

Purpose-built templates include pre-formatted SBA lender outputs and industry-specific drivers — cutting model build time from 40 hours to under 4.
Common Acquisition Modeling Mistakes
Even experienced buyers make these five errors. Each one can kill a deal or destroy returns.
Mistake 1: Using reported EBITDA without normalization. Sellers often run personal expenses through the business. Always recast the P&L before applying a valuation multiple.
Mistake 2: Ignoring working capital requirements. Buying a business with 60-day receivables and 30-day payables means you need to fund the gap from Day 1. Model the working capital cycle explicitly.
Mistake 3: Applying the wrong valuation multiple. A 4.0x EBITDA multiple is reasonable for a $500K EBITDA business but aggressive for a $150K EBITDA business with customer concentration risk. Check industry-specific multiple ranges from sources like the Pepperdine Private Capital Markets Report.
Mistake 4: Forgetting transition costs. Staff turnover, rebranding, system migrations, and customer attrition during ownership change are real costs. Budget 5-10% of Year 1 revenue as a transition reserve.
Mistake 5: Single-scenario modeling. One base case is not a model. You need base, upside, and downside. Lenders and investors will ask for all three.
Frequently Asked Questions
Is there a template for buying an existing business?
Yes. The most practical starting point for buying an existing business is an SBA underwriting template that includes normalized EBITDA calculation, a debt schedule, DSCR output, and a 3-to-5-year pro forma. The Independent Retail Pharmacy Acquisition SBA Underwriting Financial Model is a strong example for product-based businesses. For service businesses, the Accounting/Bookkeeping/Tax Firm Acquisition model covers recurring-revenue dynamics. Both include pre-formatted SBA lender outputs. A good template saves 15-20 hours of build time and reduces the risk of missing a critical underwriting component.
What DSCR do SBA lenders require for a business acquisition?
Most SBA 7(a) lenders require a minimum DSCR of 1.25x on a global basis, meaning they look at the borrower’s total debt obligations, not just the acquisition loan. Some lenders apply a 1.15x floor for strong deals with significant collateral, but 1.25x is the standard threshold. DSCR is calculated as net operating income divided by total annual debt service (principal plus interest). If your model shows 1.10x, you need to either reduce the loan amount, negotiate a lower purchase price, or demonstrate a credible growth case that lifts DSCR in Year 2. The SBA’s SOP 50 10 7 outlines the full underwriting criteria.
How do I value a small business I want to acquire?
The most common valuation method for small business acquisitions is the EBITDA multiple approach. You normalize the seller’s EBITDA (stripping out owner-specific expenses and one-time items), then multiply by an industry-appropriate multiple. For businesses generating $250K-$1M in EBITDA, multiples typically range from 2.5x to 5.0x depending on growth rate, customer concentration, and industry. A $400,000 normalized EBITDA business at a 3.5x multiple implies a $1.4M purchase price. You should cross-check this with a DCF (discounted cash flow) analysis using a discount rate that reflects the risk of the specific business, typically 15-25% for small private companies.
What is a seller note and how does it affect my acquisition model?
A seller note is a loan from the seller to the buyer, where the seller accepts deferred payment for part of the purchase price instead of receiving all cash at closing. In SBA deals, seller notes are common and often placed on standby for the first 24 months, meaning no payments are made during that period. This improves your early DSCR because the standby note doesn’t count as debt service during the standby period. In your model, you need to track when the standby period ends and ensure your Year 3+ DSCR still clears 1.25x once seller note payments begin. A $200,000 seller note at 6% over 5 years adds roughly $46,000 in annual debt service after the standby period.
How long does it take to build an acquisition model from scratch?
Building a complete acquisition model from scratch, covering historical normalization, pro forma projections, debt schedule, DSCR, IRR, and sensitivity analysis, takes an experienced financial analyst 20-40 hours. A first-time buyer without a finance background should budget 60-80 hours and expect multiple revision cycles. Purpose-built templates reduce this to 3-6 hours for experienced users and 10-15 hours for first-timers. The time savings are most significant in the debt schedule and sensitivity table sections, which require complex Excel formula structures that templates provide pre-built. For complex deals with multiple entities or real estate components, add 10-20 hours regardless of template use.
What is the difference between an SBA acquisition model and a private equity acquisition model?
The primary difference is the return metric each model optimizes for. An SBA acquisition model focuses on DSCR (can the business service its debt?) and is built to satisfy a lender. A private equity acquisition model focuses on IRR and equity multiple (what return does the investor earn?) and is built to satisfy an investment committee. SBA models use a 10-year loan amortization and test debt coverage annually. PE models use a 5-year hold period and build a full exit waterfall showing how proceeds are distributed between debt repayment, preferred equity, and common equity. Both models share the same foundation: normalized EBITDA, pro forma projections, and sensitivity analysis. The 3 Statement Modeling + Valuation template bridges both approaches by including both DSCR and DCF outputs.
What industries have the best acquisition multiples for buyers right now?
Industries with fragmented ownership, recurring revenue, and essential services tend to offer the most attractive acquisition multiples for buyers. Accounting and bookkeeping firms, residential services (landscaping, HVAC, plumbing), and independent pharmacies frequently trade at 2.5x-4.0x EBITDA, below the 5.0x-8.0x multiples common in tech-enabled businesses. The Pepperdine Private Capital Markets Report tracks private company transaction multiples by industry annually and is a reliable benchmark. Lower multiples mean more room for debt service coverage and better downside protection. Buyers should target industries where the business model is simple, customer relationships are sticky, and the seller’s personal relationships are not the primary revenue driver.
Conclusion
A rigorous acquisition model is not optional. It’s the difference between a deal that builds wealth and one that traps you in a business you overpaid for. The 7-step playbook above — normalization, pro forma, purchase price structure, debt schedule, DSCR, IRR, and sensitivity analysis — gives you a repeatable framework for every deal you evaluate.
I recommend starting with the Independent Retail Pharmacy Acquisition SBA Underwriting Financial Model if you’re buying a product-based business, or the Accounting/Bookkeeping/Tax Firm Acquisition model for a professional services deal. Both are pre-formatted for SBA lender submission and include every component covered in this playbook.























































