
0 ITEMS

Balance Sheet Explained: Assets, Liabilities & Equity
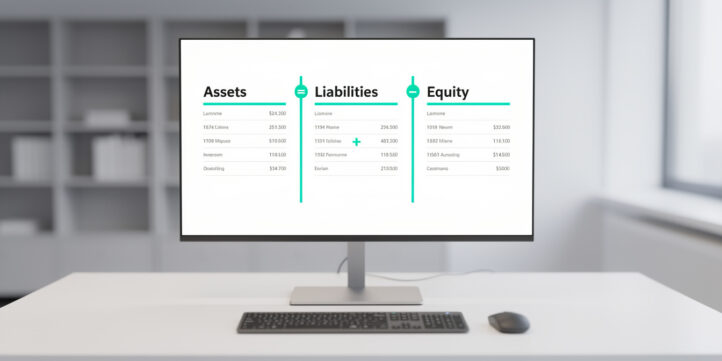
A balance sheet is a financial snapshot of everything your business owns, owes, and is worth at a single point in time — and once you understand its three sections, you can read any company’s financial health in minutes.
Key Takeaways
- The accounting equation Assets = Liabilities + Equity must always balance; every transaction changes at least two line items simultaneously.
- Current assets are resources convertible to cash within 12 months; non-current assets last longer and include property, equipment, and intangibles like patents.
- Current liabilities are obligations due within 12 months; long-term liabilities extend beyond one year and include bonds and mortgages.
- Shareholders’ equity equals contributed capital plus retained earnings, representing the owners’ residual claim after all debts are paid.
- A $500K bank loan increases both assets (cash) and liabilities (long-term debt) by $500K, keeping the equation balanced.
- A $200K equity raise increases both assets (cash) and equity (paid-in capital) by $200K — no liability is created.
- The current ratio (current assets divided by current liabilities) and debt-to-equity ratio are the two most actionable numbers you can pull directly from a balance sheet.
What Is a Balance Sheet? Definition and Purpose
A balance sheet (also called a statement of financial position) is one of the three core financial statements, alongside the income statement and the cash flow statement. It reports a company’s financial position on a specific date — not over a period — which is why you’ll always see a heading like “As of December 31, 2024” rather than “For the year ended.”
That snapshot quality is the balance sheet’s defining feature. A company’s revenue and expenses accumulate over time on the income statement, but the balance sheet freezes the picture at one moment. Lenders use it to assess collateral. Investors use it to judge solvency. Managers use it to spot cash shortfalls before they become crises.
Under U.S. Generally Accepted Accounting Principles (GAAP), the Financial Accounting Standards Board (FASB) requires public companies to present a classified balance sheet that separates current from non-current items. Source International Financial Reporting Standards (IFRS), issued by the IASB, use the same structure with minor presentation differences.
A balance sheet captures one moment in time; the income statement covers an entire period — understanding this distinction prevents common misreadings.
The Fundamental Accounting Equation: Assets = Liabilities + Equity
Every balance sheet rests on one equation: Assets = Liabilities + Equity. This equation never breaks — not for a startup with $10,000 in the bank, not for Apple with hundreds of billions on its books.
Here’s what each term means in plain English:
- Assets are resources the business controls that have future economic value (cash, equipment, patents).
- Liabilities are obligations the business owes to outside parties (bank loans, unpaid invoices, bonds).
- Equity is the owners’ residual interest — what’s left after subtracting liabilities from assets.
The equation balances because of double-entry bookkeeping (a 500-year-old system where every transaction affects at least two accounts). When you borrow $100K from a bank, cash (an asset) rises by $100K and the loan payable (a liability) rises by $100K. Both sides move together. When an owner invests $50K, cash rises and equity rises. The math always works out.
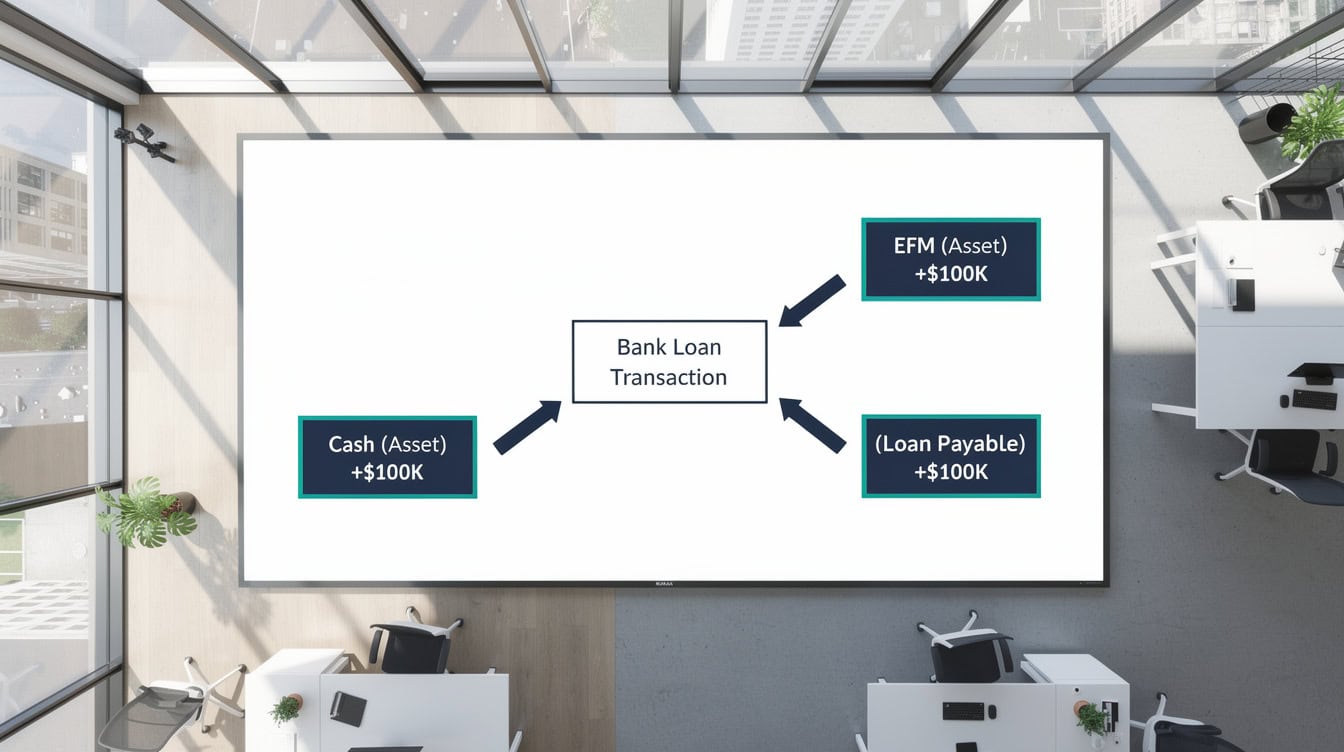
Every transaction touches at least two accounts — this is why the balance sheet always balances.
Assets: What Your Business Owns
Assets are listed on the left side (or top section) of a balance sheet, ordered from most liquid to least liquid. Liquidity means how quickly an asset converts to cash without losing significant value. Cash itself is perfectly liquid; a factory building is not.
GAAP and IFRS both require assets to be split into two categories: current and non-current.
Current Assets: Resources Convertible to Cash Within One Year
Current assets are resources your business expects to convert to cash, sell, or consume within 12 months. They fund day-to-day operations and are the primary measure of short-term financial health.
The main current asset categories:
- Cash and cash equivalents: Physical currency plus short-term investments maturing within 90 days (Treasury bills, money market funds). Source Apple reported $29.9 billion in cash and equivalents on its September 2023 balance sheet. Source
- Accounts receivable (AR): Money customers owe for goods or services already delivered but not yet paid. A net 30 payment term means customers have 30 days to pay; that outstanding amount sits here until collected.
- Inventory: Goods held for sale or raw materials used in production. Target Corporation carried $13.5 billion in inventory on its January 2024 balance sheet, Source reflecting its retail-heavy business model.
- Prepaid expenses: Payments made in advance for future benefits, such as a 12-month insurance premium paid upfront. Only the unused portion appears as an asset.
Current assets are listed from most to least liquid — cash first, prepaid expenses last.
Non-Current Assets: Long-Term Resources and Investments
Non-current assets (also called long-term assets) are resources the business expects to use for more than one year. They don’t convert to cash quickly, but they generate value over time.
- Property, Plant, and Equipment (PP&E): Physical assets like land, buildings, machinery, and vehicles. PP&E is recorded at cost and then reduced each period by depreciation (the systematic allocation of an asset’s cost over its useful life). A delivery truck bought for $80,000 with a 5-year life depreciates at $16,000 per year under straight-line depreciation.
- Intangible assets: Non-physical assets with economic value, including patents, trademarks, customer lists, and software. Microsoft’s 2023 annual report showed $69.4 billion in goodwill alone, Source reflecting decades of acquisitions.
- Goodwill: A specific intangible that arises when a company acquires another for more than the fair value of its net assets. It represents brand reputation, customer relationships, and synergies.
- Long-term investments: Stakes in other companies or securities held for more than one year.
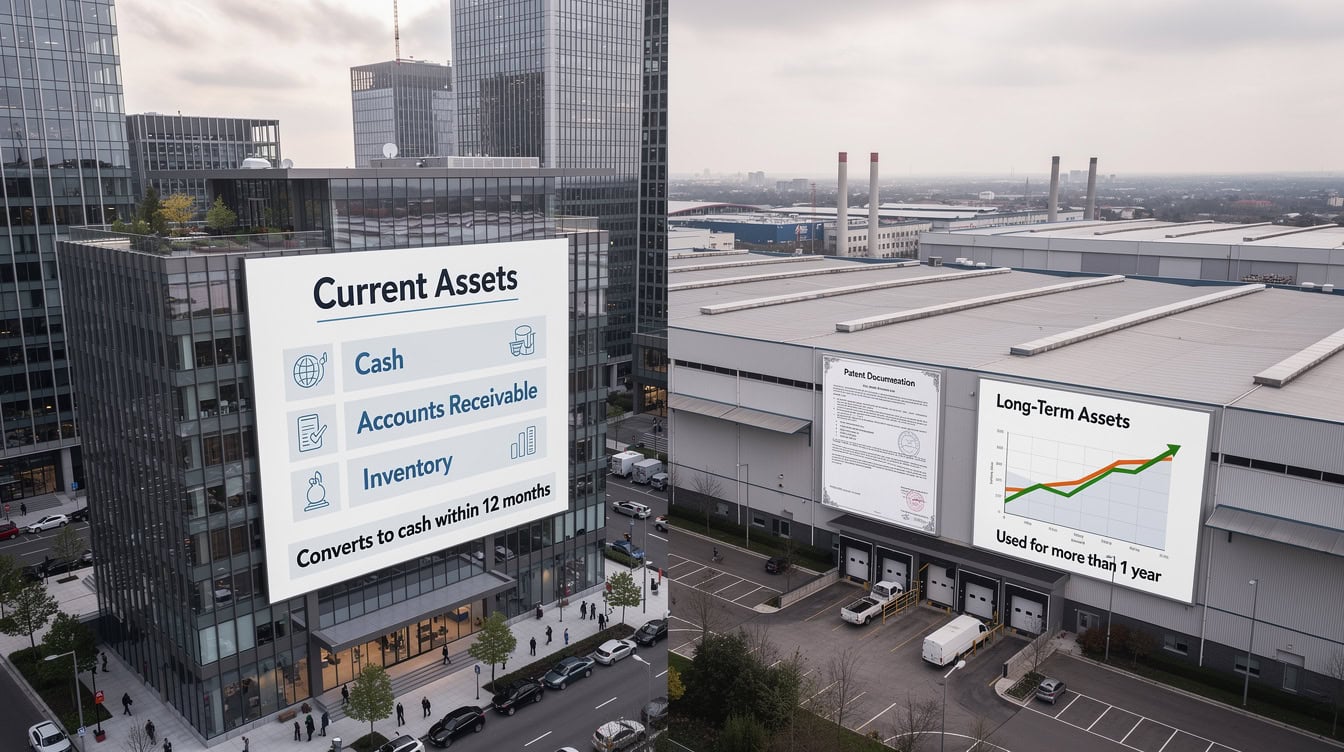
PP&E and intangibles generate value over years; current assets fund this week’s operations.
Liabilities: What Your Business Owes
Liabilities represent legal obligations to transfer assets or provide services to outside parties in the future. Like assets, they split into current and long-term categories.
Current Liabilities: Obligations Due Within One Year
Current liabilities are debts and obligations your business must settle within 12 months. High current liabilities relative to current assets signal potential cash flow stress.
- Accounts payable (AP): Amounts owed to suppliers for goods or services received but not yet paid. Standard payment terms of net 30 or net 60 days are common in most industries.
- Accrued expenses: Costs incurred but not yet billed or paid, such as wages earned by employees through month-end but paid on the 5th of the following month.
- Short-term debt: Bank lines of credit or loans maturing within 12 months.
- Current portion of long-term debt: The slice of a multi-year loan due within the next 12 months. A 5-year $500K loan with equal annual payments would show $100K here each year.
- Deferred revenue: Cash received from customers before the service is delivered (a software subscription paid annually upfront). It’s a liability because the company still owes the service.
Long-Term Liabilities: Future Obligations Beyond One Year
Long-term liabilities are obligations due more than 12 months from the balance sheet date. They fund major capital investments and acquisitions.
- Bonds payable: Debt securities issued to investors, typically with fixed interest payments and a maturity date years in the future.
- Mortgages: Long-term loans secured by real property.
- Long-term bank loans: Multi-year credit facilities from financial institutions.
- Deferred tax liabilities: Taxes owed in future periods because of timing differences between accounting income and taxable income.
The 12-month threshold separates current from long-term liabilities — a critical distinction for liquidity analysis.
Shareholders’ Equity: The Ownership Stake
Shareholders’ equity (also called owners’ equity or net assets) is the residual interest in the company’s assets after deducting all liabilities. It represents what owners would theoretically receive if the company sold everything and paid every creditor.
Equity has four main components:
- Common stock (par value): The nominal face value of shares issued, often $0.01 or $1 per share. This is a legal formality, not the market price.
- Additional paid-in capital (APIC): The amount investors paid above par value. If a company issues 1,000 shares at $10 each with a $1 par value, APIC is $9,000.
- Retained earnings: Cumulative net income the company has kept rather than distributed as dividends. Retained earnings grow when the company is profitable and shrink when it pays dividends or reports losses. This is the direct link between the income statement and the balance sheet.
- Treasury stock: Shares the company has repurchased from the market. It reduces equity (shown as a negative number).
- Accumulated other comprehensive income (AOCI): Unrealized gains and losses on certain investments and foreign currency translations that bypass the income statement.

Retained earnings is the largest equity component for most mature businesses — it accumulates every dollar of profit not paid out as dividends.
Step-by-Step Example: How a $500K Loan and $200K Equity Raise Change a Balance Sheet
A worked example makes the accounting equation concrete. Meet SoftStart Inc., a small software company that begins with a simple balance sheet, then executes two transactions.
Starting position (before transactions):
SoftStart has $150,000 in cash, $80,000 in accounts receivable, $20,000 in prepaid expenses, and $30,000 in computer equipment (net of depreciation). Total assets: $280,000. Liabilities: $60,000 in accounts payable. Equity: $220,000 in retained earnings. The equation checks: $280,000 = $60,000 + $220,000. ✓
Transaction 1: SoftStart borrows $500,000 from a bank (5-year term loan).
- Cash increases by $500,000 (asset up).
- Long-term debt increases by $500,000 (liability up).
- Equity is unchanged.
- New totals: Assets = $780,000. Liabilities = $560,000. Equity = $220,000. Check: $780,000 = $560,000 + $220,000. ✓
Transaction 2: SoftStart raises $200,000 from an angel investor in exchange for equity.
- Cash increases by $200,000 (asset up).
- Additional paid-in capital increases by $200,000 (equity up).
- Liabilities are unchanged.
- New totals: Assets = $980,000. Liabilities = $560,000. Equity = $420,000. Check: $980,000 = $560,000 + $420,000. ✓
Here’s the math in a single view:
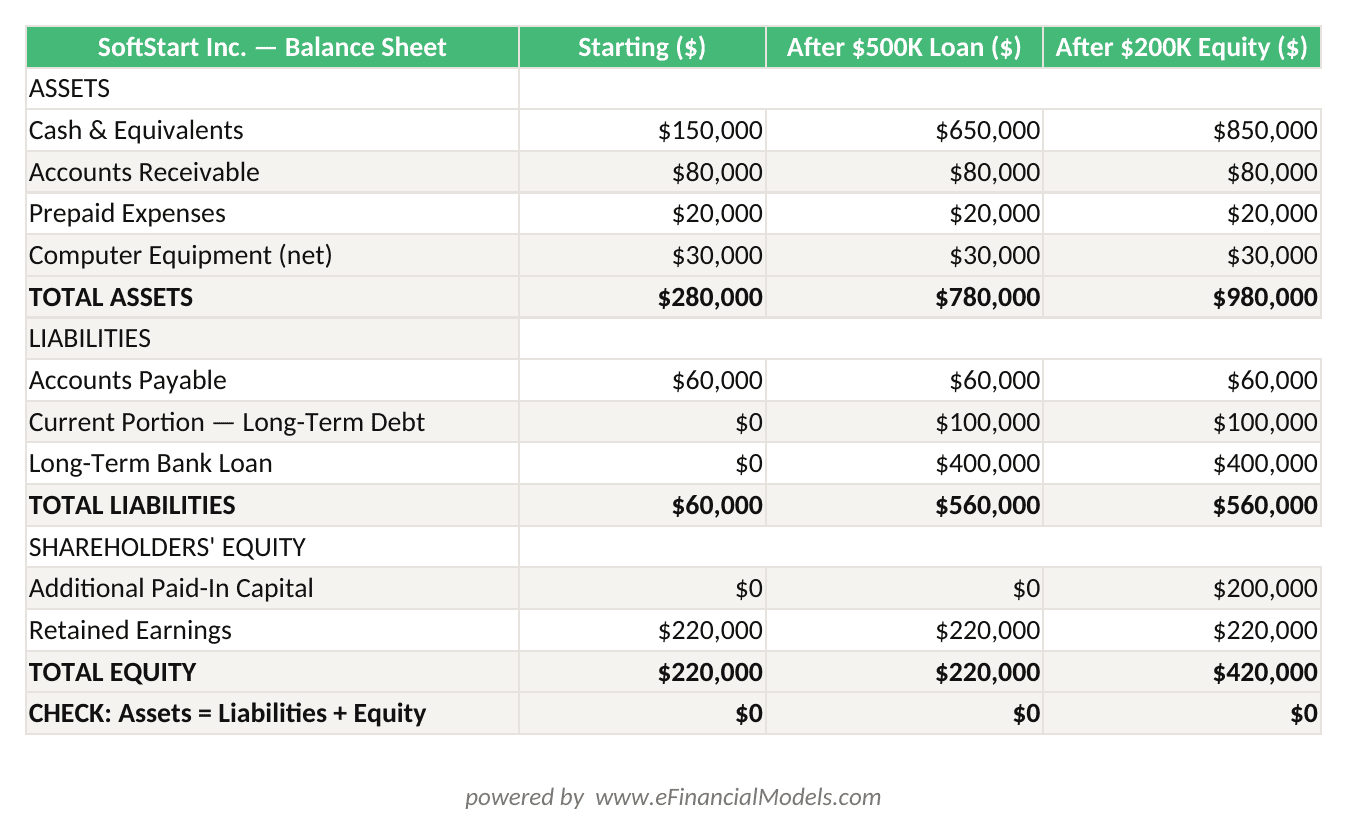
SoftStart balance sheet: Assets = $980K, Liabilities = $560K, Equity = $420K after both transactions. Equation checks: $980K = $560K + $420K.
Key insight: The loan created a liability; the equity raise did not. Both added the same type of asset (cash), but the source of funding determines whether the right side of the equation grows in liabilities or equity. This distinction drives the debt-to-equity ratio and signals very different risk profiles to lenders and investors.
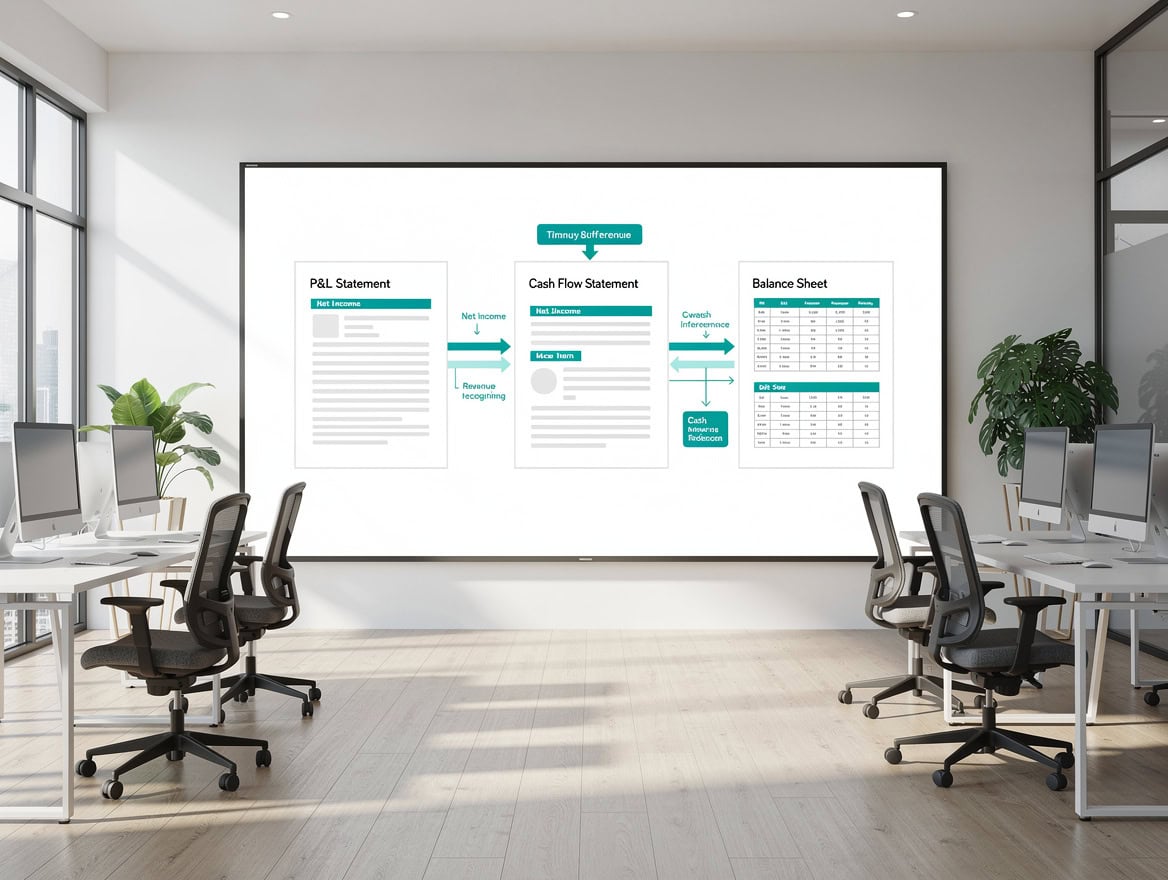
The loan adds $500K to both assets and liabilities; the equity raise adds $200K to both assets and equity — same cash result, very different risk profile.
Reading Your Balance Sheet: Key Ratios and What to Look For
Two ratios give you an immediate read on financial health directly from balance sheet data.
Current Ratio measures short-term liquidity. It answers: can the business pay its near-term bills?
Formula: Current Assets / Current Liabilities
Using SoftStart’s post-transaction balance sheet: Current assets = $150,000 + $200,000 + $500,000 (new cash) + $80,000 AR + $20,000 prepaid = $950,000. Current liabilities = $60,000 AP + $100,000 current portion of the 5-year loan = $160,000.
Current Ratio = $950,000 / $160,000 = 5.94
A current ratio above 1.0 means current assets exceed current liabilities. Most analysts consider 1.5 to 3.0 healthy for manufacturing businesses, while service companies often operate comfortably below 2.0. Source SoftStart’s ratio of 5.94 is high, suggesting the company is holding excess cash rather than deploying it.
Debt-to-Equity Ratio (D/E) measures financial leverage, meaning how much of the company is funded by debt versus owners’ money.
Formula: Total Liabilities / Total Shareholders’ Equity
SoftStart post-transaction: $560,000 / $420,000 = 1.33
A D/E ratio of 1.33 means creditors have $1.33 in claims for every $1.00 of owner equity. The U.S. Small Business Administration notes that lenders typically prefer D/E ratios below 2.0 for small business loan approvals. Source Capital-intensive industries like utilities routinely carry D/E ratios above 2.0, while software companies often stay below 1.0.
| Metric | Formula | SoftStart Result | Healthy Range |
|---|---|---|---|
| Current Ratio | Current Assets / Current Liabilities | 5.94 | 1.5 to 3.0 |
| Debt-to-Equity | Total Liabilities / Total Equity | 1.33 | Below 2.0 (SBA guideline) |
| Working Capital | Current Assets minus Current Liabilities | $790,000 | Positive |
Red flags to watch for:
- Current ratio below 1.0: the business may struggle to meet short-term obligations.
- Rapidly growing accounts receivable relative to revenue: customers may be slow to pay.
- Negative retained earnings: cumulative losses have exceeded cumulative profits.
- Goodwill exceeding 30% of total assets: heavy acquisition history with integration risk.
SoftStart’s current ratio of 5.94 signals strong short-term liquidity; the D/E of 1.33 sits within the SBA’s preferred lending range.
How the Balance Sheet Connects to Other Financial Statements
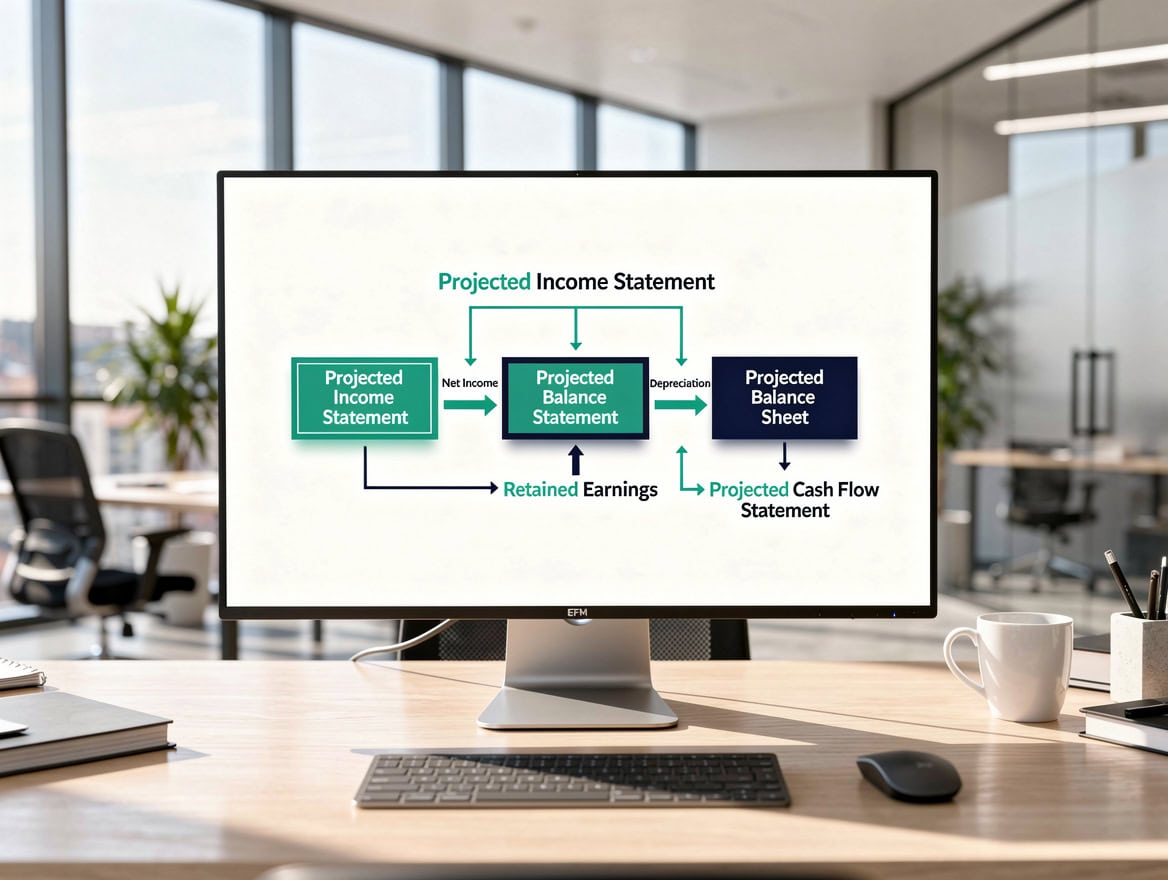
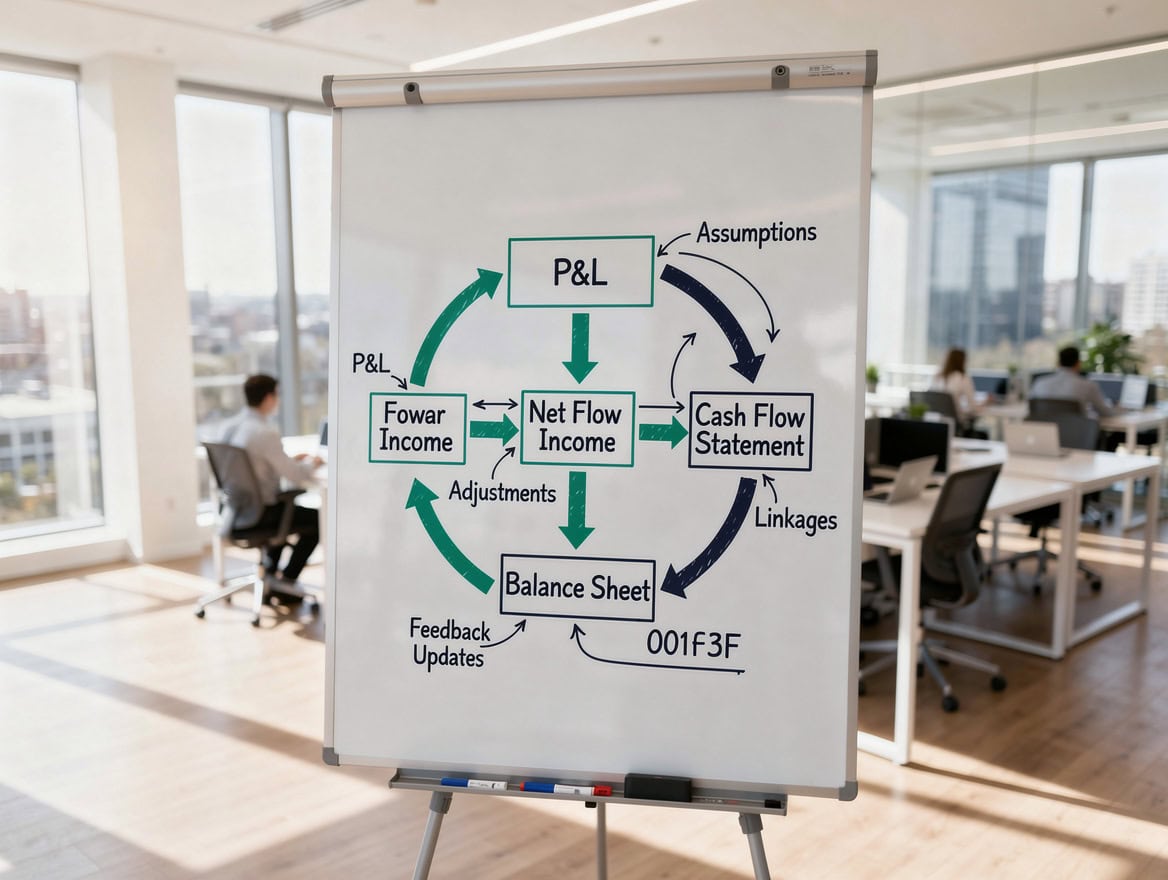
The balance sheet doesn’t stand alone. It connects to the other two core financial statements in specific, traceable ways.
Income statement connection: Net income from the income statement flows into retained earnings on the balance sheet at period end. If SoftStart earns $80,000 in net income and pays no dividends, retained earnings increase by $80,000. This is why a profitable company’s equity section grows over time. You can track this using a 1 Year P&L, Balance Sheet, Cash Flow, and Breakeven Analysis model that links all three statements automatically.
Cash flow statement connection: The cash flow statement explains the change in the cash line on the balance sheet between two periods. If cash was $150,000 at the start of the year and $350,000 at year-end, the cash flow statement shows exactly where that $200,000 came from (operations, investing, or financing activities). A Cash Flow Dashboard Spreadsheet can help you visualize these movements.
Practical tip: Always read the balance sheet alongside the income statement. A company can show strong assets on the balance sheet while losing money on the income statement — a warning sign that asset values may soon erode.
For tracking your business’s financial position over time, the 10 Year P&L, Balance Sheet, Cash Flow, and Break-even Analysis template integrates all three statements across a decade-long horizon.
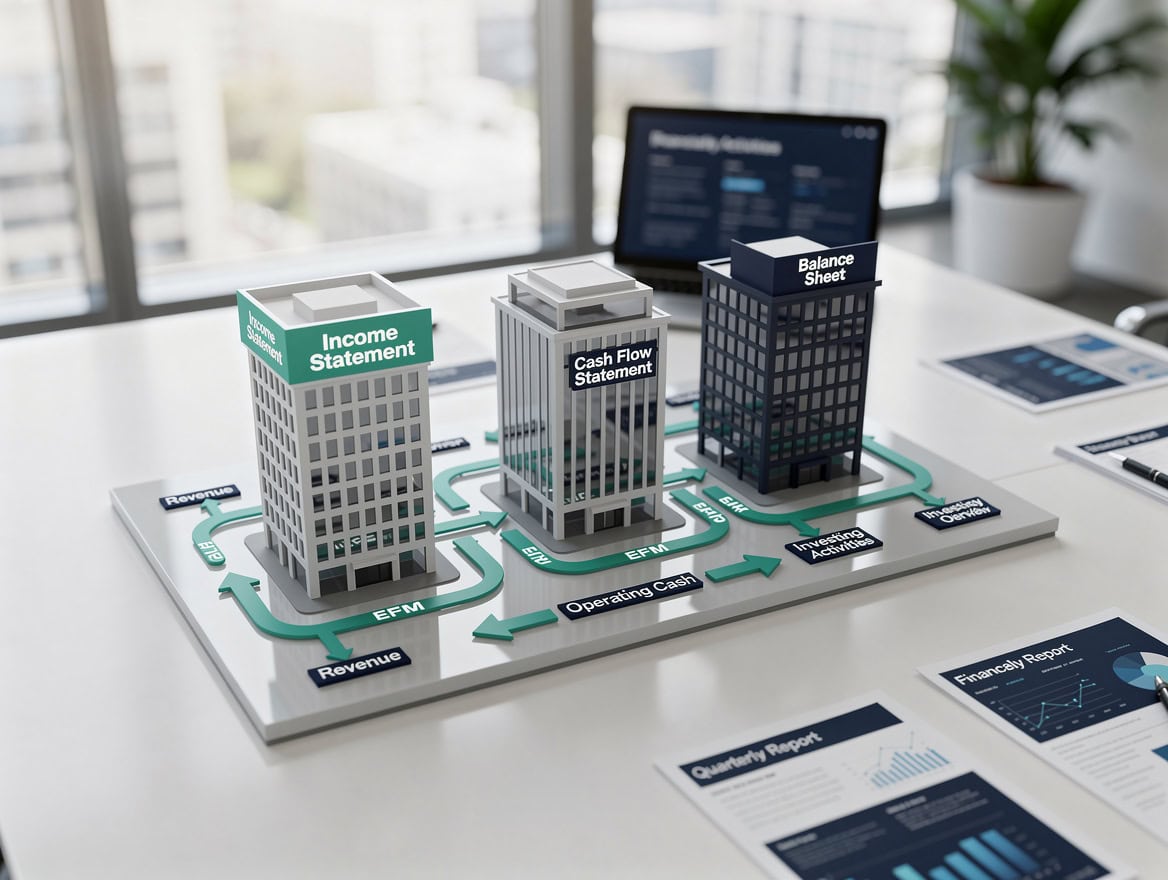
The three financial statements form a closed loop — changes in one always ripple through the others.
Common Balance Sheet Mistakes and How to Fix Them
Even experienced managers misread balance sheets. Here are the 5 most common errors.
Mistake 1: Confusing the balance sheet date with a period. The balance sheet shows position on one day, not performance over time. Fix: always check the heading. “As of March 31” is a snapshot; “For the quarter ended March 31” is a period.
Mistake 2: Treating all assets as liquid. A company with $5M in assets but $4.9M in PP&E and only $100K in cash can’t pay next month’s payroll. Fix: calculate working capital (current assets minus current liabilities) separately from total assets.
Mistake 3: Ignoring off-balance-sheet obligations. Operating leases, contingent liabilities, and certain guarantees may not appear as liabilities under older accounting standards. FASB’s ASC 842 (effective for most companies since 2019) now requires most leases to appear on the balance sheet. Source
Mistake 4: Assuming book value equals market value. PP&E is recorded at historical cost minus accumulated depreciation, not current market price. A building bought for $200,000 in 1990 might be worth $2M today but still shows a low book value. Fix: supplement balance sheet analysis with market-based valuation methods.
Mistake 5: Overlooking the current portion of long-term debt. A $500K 5-year loan doesn’t sit entirely in long-term liabilities. The $100K due in the next 12 months belongs in current liabilities, affecting the current ratio. Fix: always check footnotes for debt maturity schedules.
Frequently Asked Questions About Balance Sheets
What is the difference between a balance sheet and an income statement?
A balance sheet shows what a company owns and owes at a single point in time, while an income statement shows revenues, expenses, and profit over a period (a month, quarter, or year). Think of the balance sheet as a photograph and the income statement as a video. The two connect through retained earnings: net income from the income statement increases retained earnings on the balance sheet at the end of each accounting period. A company can be profitable on the income statement (earning net income) while still being insolvent on the balance sheet if its liabilities exceed its assets. Always read both statements together for a complete picture.
How often should a small business prepare a balance sheet?
Most accountants recommend monthly balance sheets for businesses with revenues above $500,000 per year, and at minimum quarterly for smaller operations. The U.S. Small Business Administration advises small business owners to review financial statements at least quarterly to catch cash flow problems early. Source Lenders typically require annual audited or reviewed balance sheets for loan applications. Startups seeking venture capital funding should maintain monthly balance sheets from day one, as investors will scrutinize the burn rate (monthly cash consumption) visible in the cash line.
What does a negative retained earnings balance mean?
Negative retained earnings (sometimes called an accumulated deficit) means the company has lost more money over its lifetime than it has earned. This is common for early-stage startups that invest heavily before generating revenue. For example, a software company that spends $2M building its product before its first sale will show a $2M accumulated deficit. Negative retained earnings are not automatically fatal, but they reduce total equity and can make it harder to secure loans. If total equity turns negative (liabilities exceed assets), the company is technically insolvent under accounting definitions.
What is goodwill on a balance sheet and why does it matter?
Goodwill is an intangible asset that appears when a company acquires another business for more than the fair market value of its identifiable net assets. For example, if Company A buys Company B for $10M but Company B’s assets minus liabilities equal only $7M, the $3M difference is recorded as goodwill. It represents brand value, customer relationships, and expected synergies. Under GAAP, goodwill is not amortized (gradually expensed) but is tested annually for impairment. A large goodwill write-down signals that an acquisition didn’t deliver expected value and directly reduces equity. Microsoft’s $69.4 billion in goodwill reflects its history of major acquisitions including LinkedIn and Activision Blizzard.
How do I calculate working capital from a balance sheet?
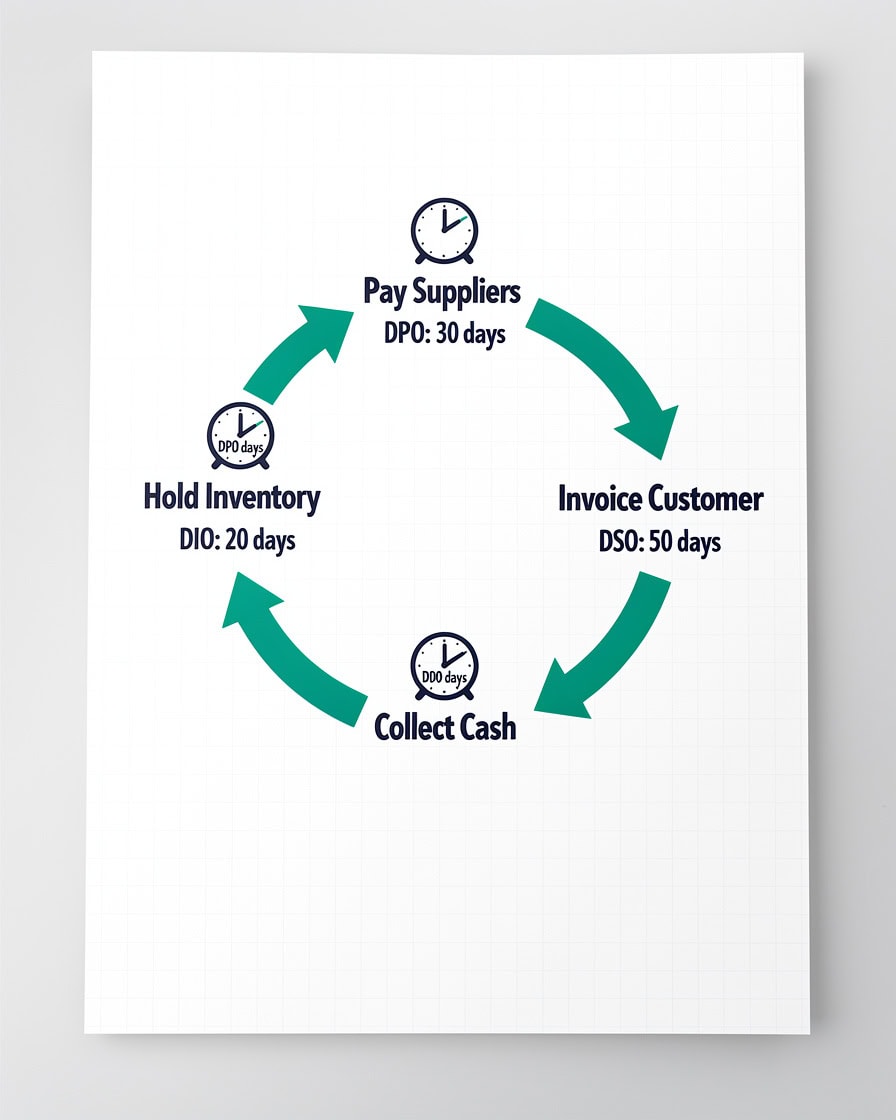
Working capital equals current assets minus current liabilities. It measures the buffer of liquid resources available to fund daily operations. Using SoftStart’s post-transaction numbers: current assets of $950,000 minus current liabilities of $160,000 equals working capital of $790,000. Positive working capital means the business can cover short-term obligations and still have resources left. Negative working capital (current liabilities exceed current assets) is a serious warning sign, though some retailers like grocery chains intentionally operate with negative working capital because they collect cash from customers before paying suppliers. The Profit & Loss Plus Cash Flow Tracking template tracks working capital changes month by month.
What is the difference between book value and market value of equity?
Book value of equity is the number on the balance sheet: total assets minus total liabilities, calculated using historical costs and accounting rules. Market value of equity (market capitalization) is the stock price multiplied by shares outstanding, reflecting what investors believe the company is worth today. For most successful companies, market value far exceeds book value because the balance sheet doesn’t capture brand strength, future earnings potential, or intellectual capital that isn’t tied to a specific acquisition. A price-to-book ratio below 1.0 means the market values the company at less than its accounting net worth, which can signal distress or undervaluation depending on context.
Can a balance sheet be prepared for a business that isn’t incorporated?
Yes. Sole proprietorships, partnerships, and LLCs all benefit from balance sheets, even though they aren’t required to file them publicly. The structure is identical: assets on one side, liabilities and owner’s equity on the other. The equity section for a sole proprietorship is simply called “owner’s equity” rather than “shareholders’ equity,” and it includes the owner’s capital contributions and drawings (withdrawals) instead of stock and dividends. The accounting equation Assets = Liabilities + Equity still holds. Many small business owners use a simple Personal Finance Budget Sheet as a starting point before graduating to a full business balance sheet.
Conclusion
The balance sheet is the foundation of financial literacy for any business owner, student, or manager. Once you understand that Assets = Liabilities + Equity and that every transaction moves at least two line items simultaneously, the rest follows naturally. Current assets fund operations, non-current assets build long-term capacity, current liabilities represent near-term obligations, long-term liabilities fund growth, and equity represents the owners’ stake after every creditor is paid.
The SoftStart example shows exactly how a $500K loan and a $200K equity raise each add cash to the asset side while landing in completely different places on the right side of the equation — one creating debt, the other creating ownership. That distinction drives every ratio, every lending decision, and every investor conversation.
I recommend downloading the 1 Year P&L, Balance Sheet, Cash Flow, and Breakeven Analysis template to build your own linked financial statements and see exactly how your income flows into retained earnings, how your cash changes appear on the balance sheet, and how your ratios shift as your business grows.























































