Van Westendorp’s Pricing Method
Determines optimal and acceptable price points, plots demand curves, estimates revenue maximization points
Introduced in 1976, this method has now become one of the most popular approaches to perform pricing analysis.
The method is based on interviewing respondents asking them four questions about a commodity’s prices simply put as follows:
1) What price do you think would be suspiciously low?
2) What price do you consider reasonable?
3) What price would be somewhat high?
4) What price would be unacceptably high?
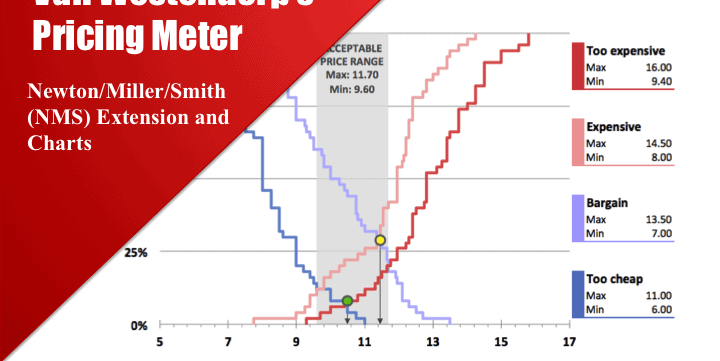
When a sufficient sample of responses is collected, the data is analyzed and plotted as cumulative frequencies. Two of the four cumulative frequencies (usually Cheap and Reasonable) are plotted inversely. The idea is to find the intersections of all plots, after which these intersections are (traditionally) interpreted in this way:
– The price level at which the number of respondents thinking it is Reasonable equals the number of respondents thinking it is High is considered the Indifference Price Point (IPP).
– Intersection of Reasonable and Too High – the Point of Marginal Expensiveness (PME).
– Intersection of Too Low and High – the Point of Marginal Cheapness (PMC)
– Intersection of Too Low and Too High – the Optimal Price Point (OPP)
The range between the Point of Marginal Expensiveness (PME) and the Point of Marginal Cheapness (PMC) is the acceptable price range.
These techniques give indications on price levels, but they say nothing of volumes. Under one of the extensions to this method (Newton/Miller/Smith (NMS) Extension), the respondents are also asked how likely they are to purchase this product at a Reasonable and High price, as they define them. Usually, they measure this on a five-point scale (from 1 point (unlikely) to 5 points (very likely)). These answers are converted into mathematical probabilities and interpreted statistically to build demand figures and revenue maximization points.
The attached file demonstrates how to perform this analysis and to draw the charts. It is accompanied by a guide explaining the method and proving details of calculations, formulas, and charts.
Similar Products
Other customers were also interested in...
Complete Three-Statement Quarterly Budget with Sce...
This is a comprehensive set of templates that will help you build your budget. The templates are bui... Read more
Complete Three-Statement Monthly Budget with Scena...
This is a comprehensive set of templates that will help you build your budget. The templates are bui... Read more
Complete Three-Statement Quarterly Budget
This is a comprehensive set of templates that will help you build your budget. The templates are bui... Read more
Complete Three-Statement Monthly Budget
This is a comprehensive set of templates that will help you build your budget. The templates are bui... Read more
Complete Private Equity (LBO) Financial Model
This is a professional financial model which performs a thorough assessment of a private equity proj... Read more
Private Equity Fund Model (Investor Cashflows)
Private Equity Financial Model to analyze fund cashflows and returns available to Limited Partners (... Read more
All My Financial Models, Spreadsheets, Templates, ...
Lifetime access to all future templates as well! Here is a set of spreadsheets that have some of the... Read more
Due Diligence P&L – Exhaustive Revenue a...
Model for in depth understanding of high level profit and loss and revenue analysis. Big-4 like chec... Read more
Advanced Financial Model with DCF & Valuation
General Overview Advanced Financial Model suitable for any type of business/industry and fully cu... Read more
Startup Company Financial Model – 5 Year Fin...
Highly-sophisticated and user-friendly financial model for Startup Companies providing a 5-Year adva... Read more
You must log in to submit a review.


