Explaining the Gordon Growth Formula for Company Valuations
The Gordon Growth Model Formula (GGM) is a well-known model for assessing a company’s stock values. This article will explain the Gordon Growth formula and how it is used in the context of company valuations.
Please also refer to our video, which explains how the Gordon Growth Valuation Method works and how it can be used in Excel.
What is the Gordon Growth Model?
Myron J. Gordon, a professor at the University of Toronto, created it during the late 1950s. Revenues, earnings, performance, growth, and profit margin are some of the fundamental values of the stock. The Dividend Discount Model (DDM) provides the foundation for this model. The distinction is that DDM forecasts the company’s future dividends based on various factors such as market conditions, profitability, and demand, among others. GGM, on the other hand, thinks that tips should grow at a steady rate independent of market conditions.
Gordon Growth Model can use either based directly on Dividends or Cash Flows. The example below refers to Dividends.
This model has three major components that should be highlighted:
- Dividends Per Share (DPS): It is important to remember that a company’s dividend determines the number of dividends that should be paid to its stakeholders and the return on investment that shareholders receive. The dividend paid to each stakeholder is referred to as the DPS. It will assist stakeholders or investors in determining how much money they will receive from the company, depending on their shares.
- Dividend Growth Rate (g): This is the rate at which a stock’s dividend grows over time. The growth rate is typically calculated on an annual basis to determine a company’s dividend growth rate. If dividends are increasing at a higher rate, it could indicate a substantial likelihood of long-term profitability.
- Rate of Return(r): The rate of returns refers to the opportunity cost of capital an investor should be able to get on the stock market for investing in a stock with similar risk.
The Purpose of Gordon Growth Formula
The Gordon Growth Formula is used to calculate the fair value of a stock and the relationship between value and return, regardless of other factors or current market conditions. If the GGM value is greater than the stock’s current market price, the stock is undervalued and should be purchased. If the value is less than the stock’s current market price, the stock is considered overvalued and should be sold. The Gordon Growth Model, in a nutshell, estimates the value of a company’s stock based on its rate of return and dividend growth.
Another use of the Gordon growth formula is to capture the terminal value as, e.g., of year five onwards in a Discounted Cash Flow Valuation Method.
Gordon Growth Formula Used for Dividends
The value of a stock is established using this model by evaluating the returns that a stockholder will get over time. Divide the expected dividends per share (DPS) in a year by the difference between the investor’s needed rate of return (r) and the dividend growth rate to get the dividend yield.
This is the simple formula:

P stands for value per share
D 1 stands for the value of the dividend next year
r stands for the required rate of return or the return of investment
g stands for constant dividend growth rate
Aside from the Gordon Growth formula, here are some other components you’ll need to understand to compute the value of P finally:
D0 refers to the Current Dividend per share.
Price refers to the current stock market price per stock
Gordon Growth Model Excel Calculation
Here is an example of how to use the Gordon Growth Formula in Microsoft Excel to compute the stock’s value:
Example: Panacea PH
Panacea PH is a cosmetics company whose shares are currently trading at $60. The stockholders require a minimum return rate of 17%. The company just issued a $5 per share dividend, which is set to climb by 9% over the next year. What is the value of a share?
Here’s an example of a Gordon Growth Model excel calculation to get you started:
- First, list down the values:
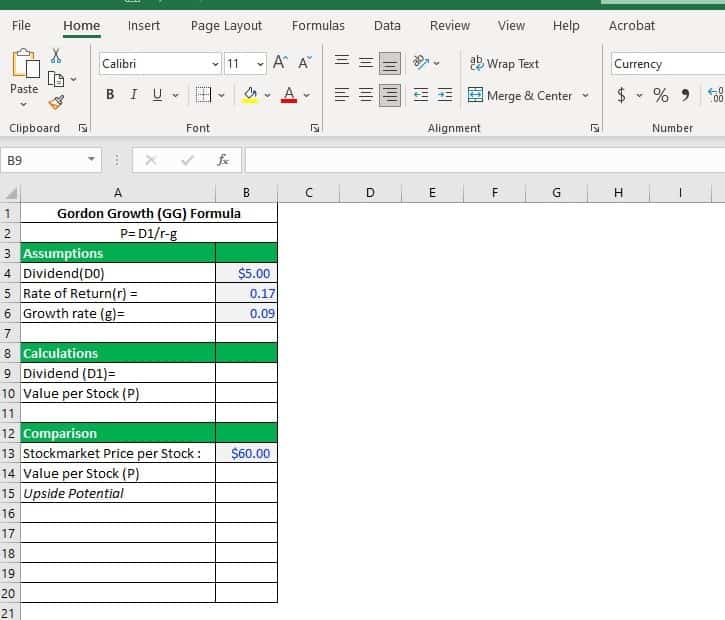
By listing down the values, you can quickly determine the missing values that you need to calculate. In this scenario, you can see that the value for dividends for next year(D1) is missing, and the current value per share (P).
2. We need to determine first the D1 (Value of Dividend next year) in this case scenario. To calculate the value per share (P), you need to calculate first the value for D1.
Here is the formula to calculate the value of D1: D1= D0 (1+g)
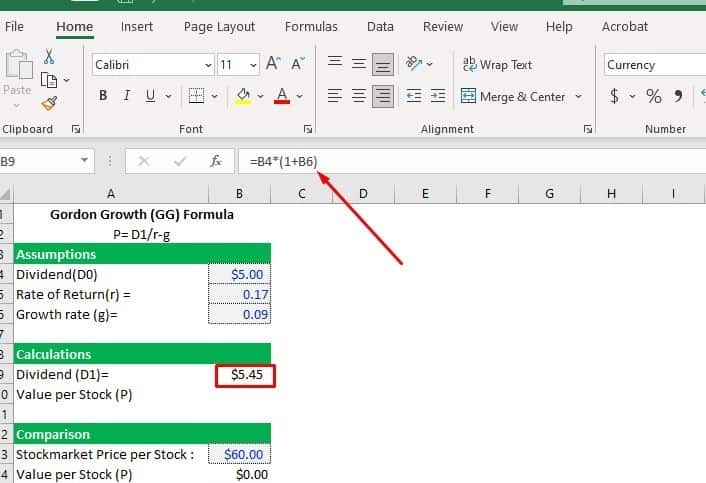
You can get the value of D1 by inputting the formula in the formula bar. Start by putting an equal sign (=) followed by clicking the cell number, which contains the value of D0. Right there, put an asterisk (*), which acts as a multiplication sign followed by the parenthesis () where the values of 1 and the growth rate are inside. Press ENTER to arrive at the answer finally.
Note: The Rate of Return and Growth rate values have been converted to numbers. Press the percentage sign (%) on the upper part to convert the numbers to their percentage value and vice versa.
c. Since you already have the value for D1, it is time to calculate the value per share (P).
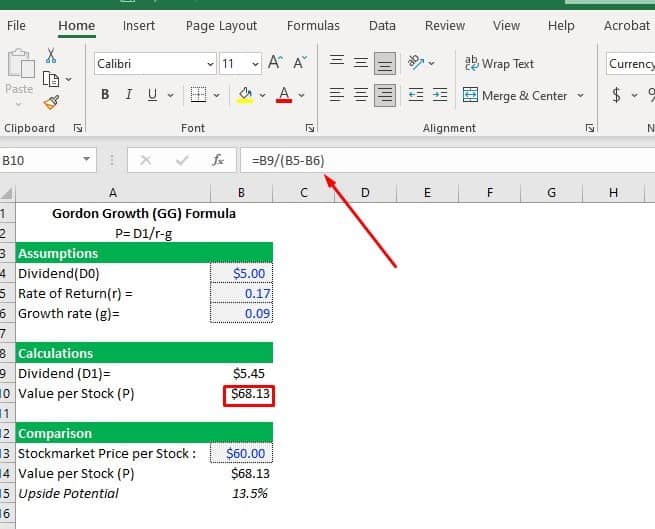
Enter the formula in the formula bar to calculate the value of P. Begin by inserting an equal sign (=), then click the cell number containing the value of D1. It was followed by a slash (/), which serves as a division symbol. Then, insert a parenthesis () and click the cell containing the value or (r) rate of return and subtract it from the value of growth rate (g). Finally, press ENTER to get the answer.
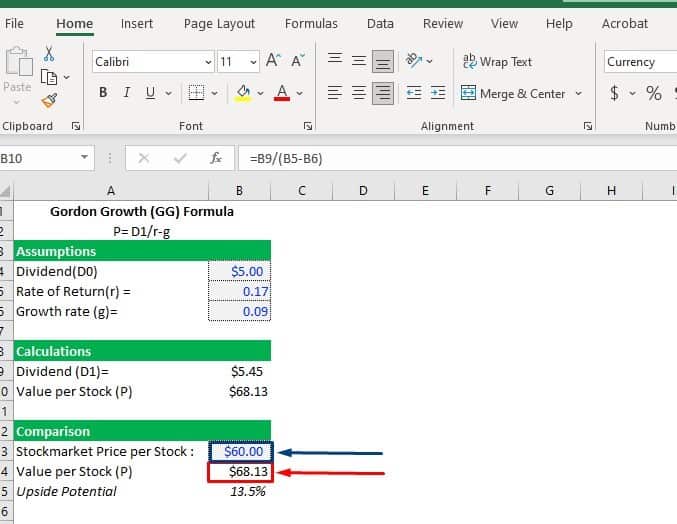
d. The computed value per share is $68.13. If you compare it to its current stock market price of $60, you can conclude that the calculated value per share (P) is higher than the current stock price, which means that it is undervalued. This means that it is an opportune time for investors to buy or invest.
Gordon Growth Model used for Terminal Value Calculation in DCF
Now that we have explained what is the Gordon Growth model in the context of dividend valuation, we focus on its use in DCF valuation. The Gordon Growth Model can also be used to calculate the terminal value in a Discounted Cash Flow (DCF). While GGM’s premise is that dividends will continue to grow endlessly, Terminal value emphasizes the increase of free cash flows indefinitely. Terminal value refers to the estimated value of a business beyond the projected forecast period of DCF. Gordon Growth method comes in a DCF valuation when a company or a business has consistent free cash flows. This assumes that a business or a company will operate steadily and not stop operating even after the forecasted period.
The forecasted period refers to the predicted progress of value, generally within a five-year time frame. Beyond that becomes an actual guessing game, where the Gordon Growth model is employed to calculate the Terminal Value in DCF.
Remember that the time value of money is critical in a DCF valuation. This indicates that after a 5-year prediction of all a firm’s future free cash flows, predicting the value of an asset becomes more difficult as the time frame lengthens. This is where the terminal value comes in.
This is the formula for calculating the Terminal Value using Gordon Growth Model:
Terminal Value (TV) = FCF / (WACC – g)
Below are the values you need to be familiar with to calculate the Terminal Value in a Discounted Cash Flow:
TV stands for Terminal Value
FCF stands for the Free Cash Flow
WACC refers to the Weighted Average Cost of Capital or the discount rate
g refers to the constant growth rate of FCF.
Here’s a STEP-BY-STEP procedure and a sample computation of Terminal Value using the Gordon Growth Model in DCF:
EXAMPLE: Realest Company
Panacea PH wants to know how much Realest, its sister company, is worth. Panacea’s financial team chose to forecast the sister company’s future value using the Gordon Growth Model. While their initial investment is $435,000. However, the existing debt of the company is $500,000. The forecast period concludes at the end of the fifth year. The weighted average cost of capital is 12%, and the perpetuity growth rate is 2.8 percent.
a. List all the projected values based on the assumed data from the example. You can see that by listing all the values, you can quickly determine the missing values.
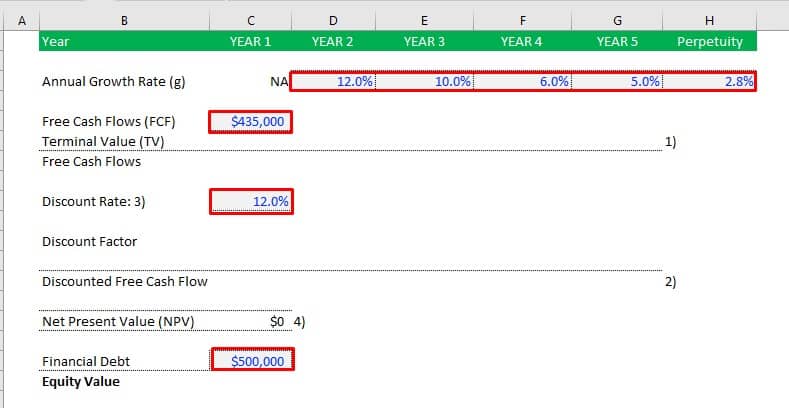
You can see in our example that the yearly growth rate varies from year to year, and you might be asking why the numbers are in descending order, indicating that the rate is decreasing. Remember that it is common practice to assume different growth rates for each stage of the business life cycle when forecasting firm growth. Similarly, you could be perplexed as to why there are no growth rate statistics for Year 1. It’s because we calculate its value after a year to see how much it’s increased. We don’t have any data to compare to from the previous year.
Note: We will use the blue font for the assumed value and the black font for the calculations for this example.
b. To calculate the Terminal Value (TV), we need to complete the first part by calculating first the Free cash flows (FCF) for each year.
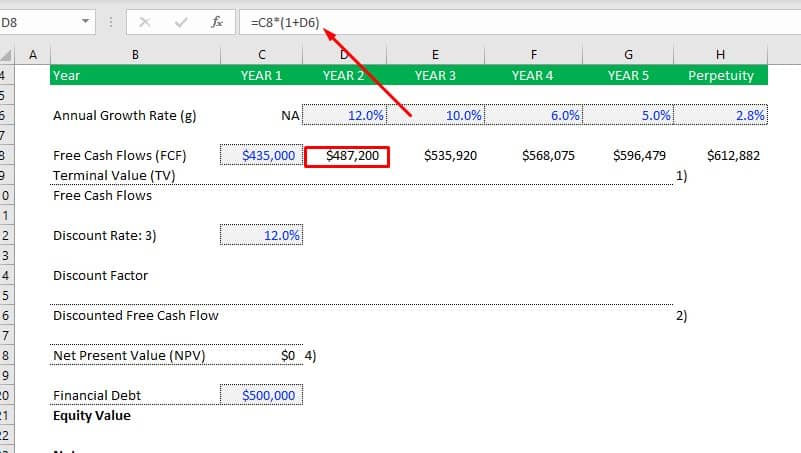
To begin, type the equal symbol (=) into the formula bar. Select the cell (C8) that holds the value of the previous year’s free cash flow. Put an asterisk (*) as a multiplication symbol, then a parenthesis with the number one, an addition sign (+), then the succeeding year’s annual growth rate, which is, in this example, 12%.
c. Since the value for growth rate, discount rate, and cash flows are already given, it’s time to compute the Terminal value (TV).
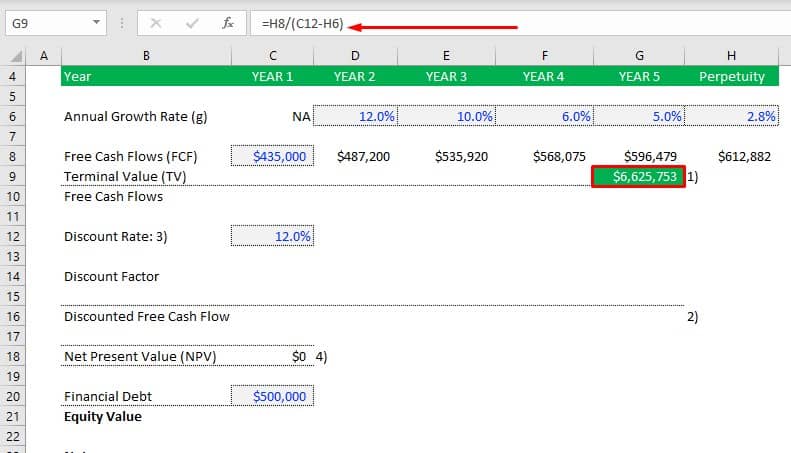
We’ll look for three components to calculate the terminal value: FCF, WACC, and Growth rate. The FCF value utilized in the example is perpetuity, which means it is the assumed value of all free cash flows across time. Start again by putting an equal sign (=) on the formula bar, followed by clicking the cell containing the value for the assumed FCF, which is (H8). Insert a division symbol, a slash followed by a parenthesis, with the discount rate and perpetual growth rate inside.
Note: In this example, WACC is used as a discount rate since it determines the value of future free cash flows of an enterprise or firm. Likewise, this helps to determine whether future cash flows from a project or investment are worth more than the capital expenditure needed for the current project or investment.
You can learn more about WACC by visiting this link: Calculating the discount rate for Discounted Cash Flow Analysis
d. Next, sum up the total value per FCF.
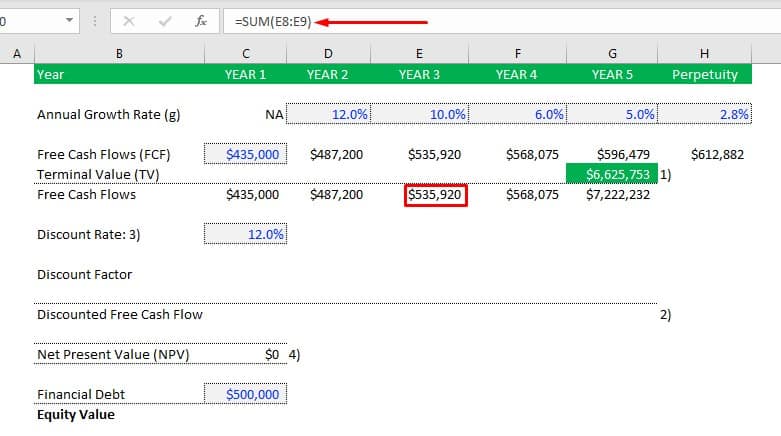
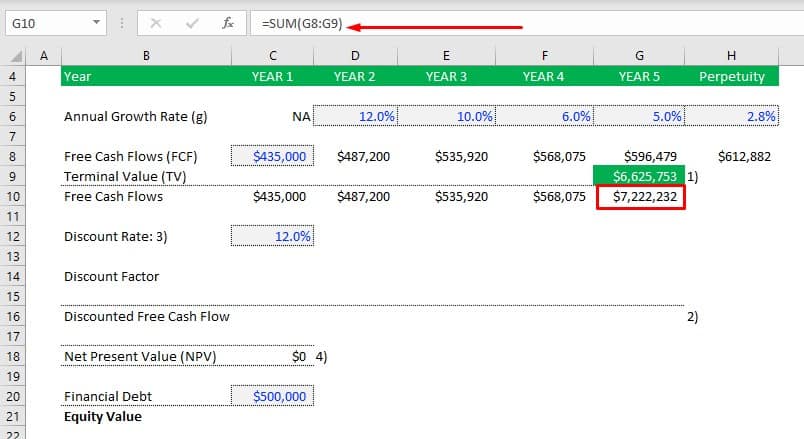
To calculate the total FCF value from year 1 to perpetuity, enter an equal sign (=) in the formula bar, then the function SUM, and finally, a parenthesis (). Click the cell that contains the FCF value for the specific year; in this example, we used the FCF in year three, which is equivalent to $535,920, followed by a colon, and the terminal value, which in this case is equal to zero; thus, the free cash flow total value for year 3 remains the same. In year 5, however, this is not the case because the terminal value has already been calculated. Add the terminal value and the FCF together. The total Free Cash Flows in this example are $7,222,232.
e. Calculate the Discount Factor
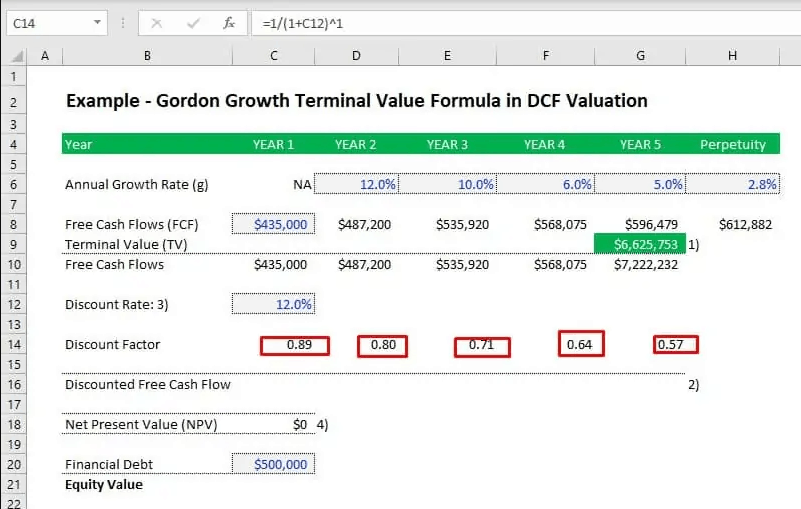
To summarize the essence of the discount factor, its primary purpose is to assist key executives and entrepreneurs in determining whether an investment will generate a positive return. If the net present value is positive, the investment will generate a profit. Otherwise, it is deemed unviable.
Use this formula to calculate the value of each discount factor:
=1/(1+C12)1
Note: The only thing you will change in this formula for each discount factor is the last part. Substitute the period or year for the number.
See the example below:
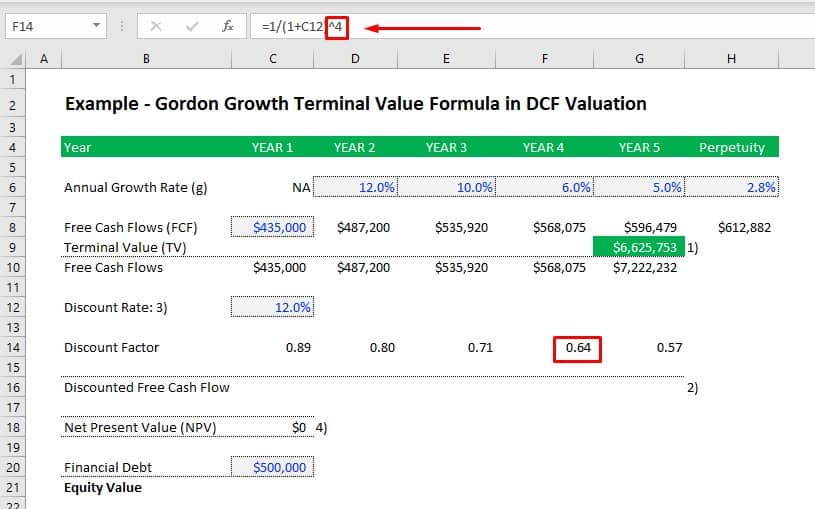
f. Calculate the value of the Discounted Free Cash Flow
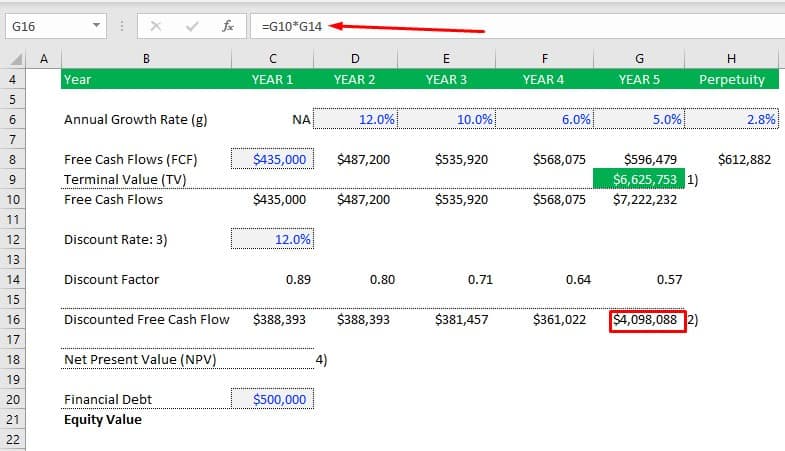
To calculate the value of each discounted free cash flow, multiply its value by its discount factor. Begin by entering an equal sign (=), then click the cell containing the free cash flow value and multiply using an asterisk sign (*), and click the cell containing the discount factor.
g. Next is to compute the value of Net Present Value or (NPV)
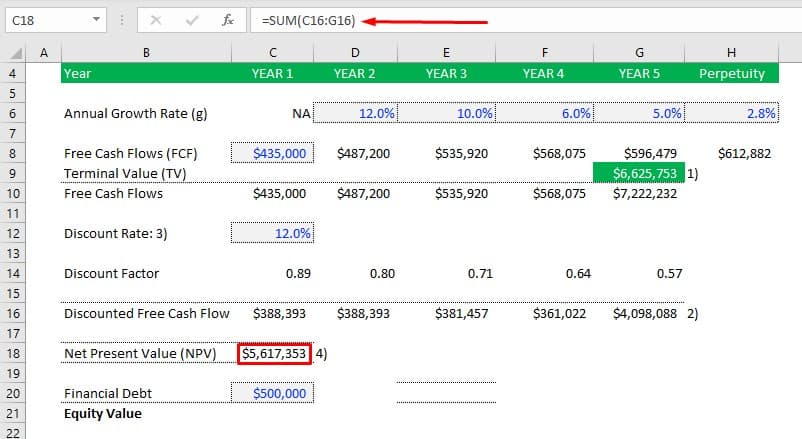
In this case, the value for NPV is $5,617,353. The computed NPV turned out to be positive, indicating that the investment was profitable. To calculate the NPV, begin with an equal sign (=) and then use the function SUM. Insert parenthesis and click all the cells that contain the discounted free cash flow value for each period.
h. Determine the Equity Value
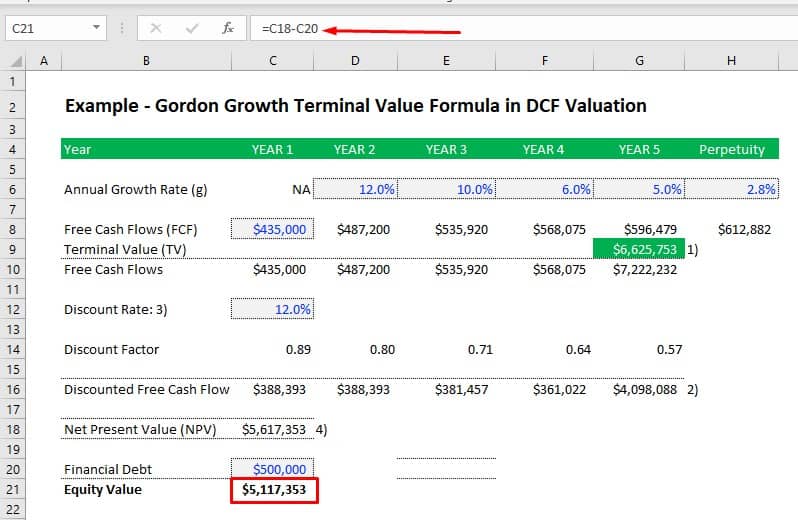
The value that remains for the shareholders after all debts have been paid is referred to as equity. To calculate the equity value, subtract the NPV value from the debt value. Begin again with an equal sign (=) and click the cell containing the NPV value, followed by a subtraction sign (-), and finally, the debt value.
The Pros and Cons of the Gordon Growth Model
Pros
- The Gordon Growth model offers a quick and simple method for determining the value of a stock or share.
- Works best for mature organizations or enterprises with consistent and robust cash flows and growth.
- It only requires a few parameters to estimate.
- This model can be used to calculate the terminal value in a DCF valuation.
Cons
- This model assumes that dividends will continue to grow indefinitely, which restricts its accuracy. Companies may experience changes, problems, risks, and demands as time passes, which may impact the firm. Therefore, the underlying assumption of eternal dividend growth in most cases is not realistic.
- The model may produce a negative value if the needed rate of return is lower than the growth rate; consequently, the model is not efficient or meaningful to use in such instances.
- It ignores non-dividend elements such as customer retention, market trends, company size, and so on, all of which add to a business’s overall worth. E.g., companies that do not pay dividends or do not have positive free cash flows will have zero value when using the Gordon Growth Formula.
- Because the model focuses on consistent growth, businesses with erratic cash flows are not suitable businesses.
Conclusion
We have now explained what the Gordon Growth Model Formula is. It is one of the simplest valuation methods available, which allows you to quickly determine the value of a stock or a privately held company. This is the easiest way because all the inputs are readily available.
The main assumption of the Gordon Growth Model is that dividends will be paid and continue to grow indefinitely. This only works where the market conditions allow it, but in reality, it is not always the case. Also, during the Covid-19 pandemic, many companies have shortened their dividends, making it impossible to value companies solely on dividends. However, the Gordon Growth model can also be used to estimate the terminal value in a Discounted Cash Flow valuation analysis.
Here, we are using cash flows instead of dividends as the basis for our valuation. The Gordon Growth Formula is easier to apply for large and stable organizations with reliable growth patterns than start-ups that might run with negative cash flows for years but will still experience high user growth (e.g. Uber). In this case, preference has to be given to alternative valuation methods. So, while the Gordon growth model formula has its merits, the key is to know when to apply it and when not. With Excel, the Gordon Growth Formula becomes as easy as a cake to apply.
Try some of our Excel Templates to see for yourself.


