Shared Kitchen Financial Model Template: Multiple Brand in One Kitchen
Thinking of new business venture? Why not take the hype of investing in shared kitchen with the chance of housing multiple brand while utilizing the same kitchen facilities and resources?

A Shared Kitchen is a centralized commercial food production plant where any restaurants rent kitchen space to optimize delivery. One kitchen may house multiple brands or the so-called virtual restaurant operating under one roof. It’s like a large warehouse with several stations of their own steel prep tables, stoves, sinks, or hood vents with orders coming directly from customers. The Shared Kitchen allows the restaurant to launch multiple brands utilizing the same kitchen infrastructure and resources.
Shared Kitchens are also adaptable, where you can even launch a brand just for a season. For instance, you could offer a salad brand for summer and poutine for winter, letting you take advantage of each type of food’s seasonal demand without enduring any downturn.
Operating a Shared Kitchen
Running Shared Kitchen needs a kitchen space to rent, licensed brand, delivery app visibility, etc. In short, all operational requirements of a virtual restaurant must be provided by the Shared Kitchen. Renting a coworking space and incubator for food producers to multiple third-party brands could turn you a profit with lower overheads, better efficiency, brand exposure through a delivery app, etc. This model also involves keeping the property in order by providing pest control, security services, kitchen equipment maintenance, and other resources like paper towels and cleaning supplies.
Shared Kitchen Financial Model
This model allows you to manage multiple third-party brands in one kitchen. The model consists of three kitchen sizes, with the largest kitchen operating in 10 brands. The brands are also categorized based on the average spent by customers.
The model generates revenue through rentals of kitchen space and equipment to third-party brands. If you are looking for the same kind of business opportunity, you might as well invest in this kind of template that would allow you to scrutinize and further analyze this industry. It will help you better understand different variables that you may be missing in your study. The financial model template includes:
EXECUTIVE SUMMARY TAB
- Executive Summary section with charts, summarized key financials and the main assumptions of the shared kitchen.
- Key assumptions to enter (blue font) include:
Financial Overview
- Revenue and Cost Scale
- Project Evaluation details
Breakdown, Sources and Uses of Funds
- Paid in Capital
- Loan/loan ratio
- Contingency rate
Investor Consideration
- Equity Stake
- Exit Year
WACC Calculation
- Interest Free Rate
- Beta
- Equity Risk Premium
- Equity and Debt ratio
- Interest Rate
- General Assumption
- Revenue Assumption
- Direct Cost Assumption
- Indirect Cost Assumption
- CAPEX Assumption
- Working Capital Turnover
ASSUMPTION TAB
The calculation of revenue, direct cost, indirect cost, and operating cost are detailed here. Depending on the level of investment estimated, the appropriate debt financing is calculated. The expenses are determined by using the applicable sales ratio from the input in the executive summary.
FINANCIALS TAB
- Projected Financial Statements (Income Statement, Balance Sheet and Cash Flow Statement, Shareholder Statement) for a five-year period
- Five-year financial analysis including relevant KPI’s
- Growth Indicators
- Profitability Indicators
- Liquidity Analysis
- Balance Sheet Analysis
- Efficiency Analysis
- Return Analysis
- Detailed calculation of Project Internal rate of Return (IRR), Net Present Value (NPV) and Payback Period
- Detailed calculation Investor’s Internal rate of Return (IRR), investment returns or equity multiple.
- Calculation of required equity funding
- Detailed WACC calculation
- Detailed Discounted Cash Flow (DCF) Valuation
- Sensitivity Analysis
CHARTS TAB
- Five-year Revenue Chart Projection
- Five-year Profitability Analysis Chart Projection
- Five-year Return Analysis Chart Projection
The Excel model comes in printer-friendly layout including charts and graphs..
Filetypes:
- PDF Adobe Acrobat Reader
- .xlsx (Microsoft Excel
Similar Products
Other customers were also interested in...
Airbnb Financial Model
Air BnB Financial Model Template presents the business case of the purchase of up to 5 properties wi... Read more
Short Term Rentals (Airbnb) Financial Model –...
A short-term rental is a furnished living space available for short periods of time, from a few days... Read more
Bed And Breakfast Financial Model Excel Template
Buy Bed And Breakfast Financial Projection Template. This well-tested, robust, and powerful template... Read more
Hotel/Guesthouse/Resort Development Model and Valu...
This Hotel / Holiday Resort Development Model will take you through a 20-year period of Three Statem... Read more
SHOPPING CENTER or MALL DEVELOPMENT MODEL – ...
This Shopping Center or Mall Development Model will take you through the development timeline accord... Read more
Hotel Acquisition Financial Model
General Overview Advanced financial model presenting an acquisition scenario for a Hotel. The ma... Read more
Yacht Marina Acquisition Financial Model
Financial model presenting an investment scenario of a Yacht Marina, from the acquisition of the pro... Read more
Shopping Center Acquisition Financial Model
Financial model presenting an investment scenario of a Shopping Center, from the acquisition of the ... Read more
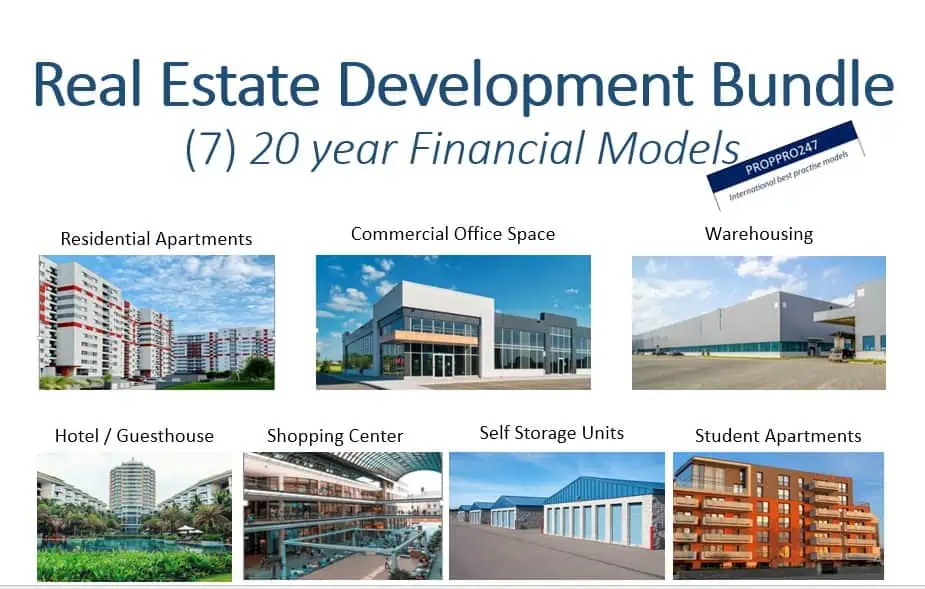
Real Estate Development Bundle
This Real Estate Development Bundle is a collection of real estate calculators or tools in MS Excel ... Read more
Vacation Rentals Hotel Financial Model Excel Templ...
Discover Vacation Rentals Hotel Pro Forma Projection. Use this Excel to plan effectively, manage Cas... Read more
You must log in to submit a review.


