0 ITEMS

Acquisition Valuation Toolkit: 5 Methods to Value a Target

A buyer values a company by running five methods side by side, then paying no more than the target’s stand-alone value plus a share of the synergies. This toolkit explains discounted cash flow, trading comparables, precedent transactions, leveraged buyout analysis and asset-based value, and applies them to one hypothetical target, with leveraged buyout analysis kept as a cross-check.
Key Takeaways
- Discounted cash flow, trading comparables, precedent transactions, leveraged buyout analysis and asset-based value each answer a different question, so no single method sets the price.
- Trading comparables reflect minority prices, while precedent transactions include a control premium, so the gap between them estimates what control costs.
- Synergies belong to the buyer only up to a point, because the seller expects a share, so a buyer should set a walk-away price in advance.
- The acquisition premium is the offer above stand-alone value; in the example it is 6.1%, with half of the net synergies shared with the seller.
- Results work best as ranges on a football-field chart, which shows where the offer sits against each method and the walk-away price.
Five Methods Value a Target From Five Different Angles
Each method answers a different question: what the target’s cash is worth, what similar listed companies trade for, what buyers paid before, what a lender-funded buyer can afford, and what the assets would fetch. A buyer reads the five results as a range.
Enterprise value (EV) is the price of the whole business, including its debt, and equity value is enterprise value minus net debt (borrowings minus cash), the price of the shares alone. Care matters because deal volume is large: PitchBook’s 2025 annual global report on mergers and acquisitions counted 50,810 deals totaling nearly $5 trillion in 2025, with deal value up 37% year over year.
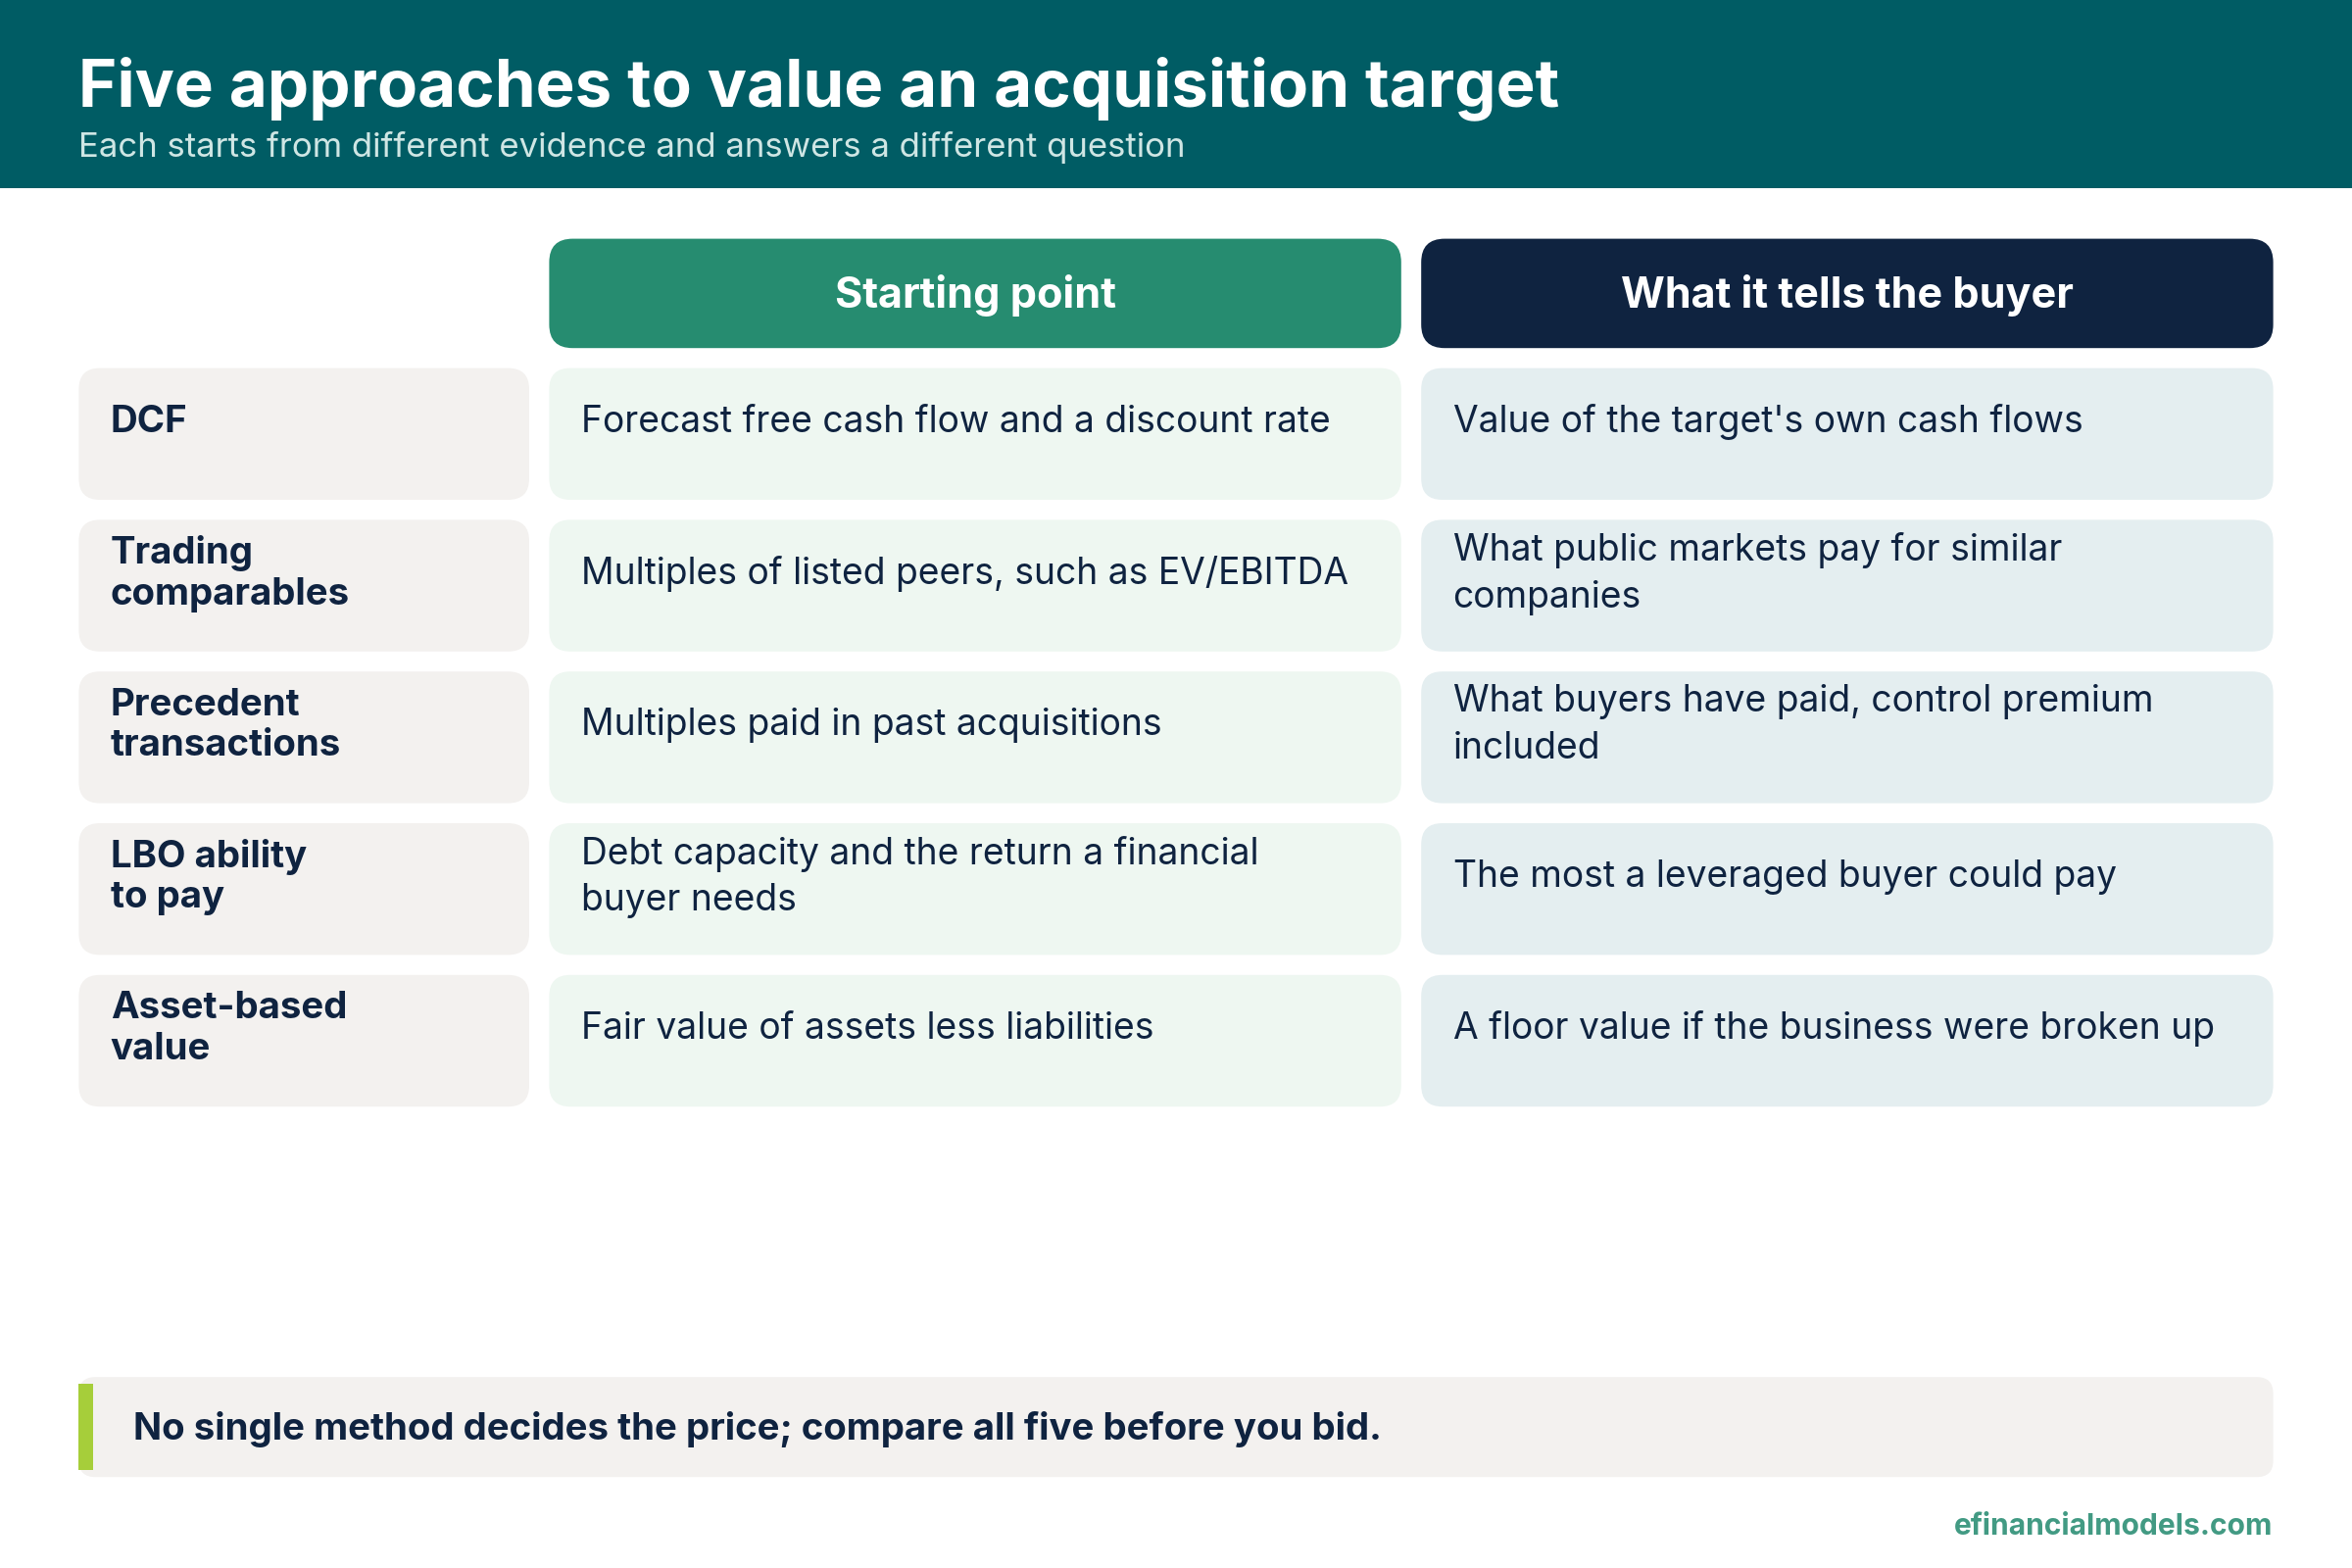
Each approach starts from different evidence and answers a different question about price.
Discounted Cash Flow Values the Target on Its Own Future Cash
Discounted cash flow (DCF) is a method that values a target as the present value of its expected free cash flow, the cash left after operating costs, taxes and reinvestment. Aswath Damodaran’s lecture notes at New York University describe the value of an asset as the present value of the expected cash flows on the asset.
A DCF has three inputs. The forecast covers five to ten years of free cash flow. The discount rate, the annual return required to convert future cash into today’s value, is usually the weighted average cost of capital (WACC), the blended return that lenders and shareholders demand. The terminal value, the value of all cash flows after the forecast period, is commonly the final-year cash flow grown once at a long-term rate and divided by the discount rate minus that growth rate.
Terminal value often supplies most of the result, so a sensitivity analysis, a table showing how value moves when the discount rate or growth rate changes, is essential. Templates are listed under the DCF model tag at eFinancialModels.
Trading Comparables Anchor the Price to Similar Listed Companies
Trading comparables value a target by applying the multiples of similar listed companies to the target’s own metrics. The most common multiple divides EV by earnings before interest, taxes, depreciation and amortization (EBITDA), a proxy for operating profit before financing and non-cash charges. Relative valuation rests on the assumption, in Damodaran’s words, that the market is right on average, so the result is only as reliable as the peer group’s prices.
Two cautions apply. Listed prices reflect minority stakes, so they exclude any payment for control. The peer set also needs judgment, because no two companies share the same growth, risk and size, so a buyer should adjust for those gaps instead of averaging blindly.
Precedent Transactions Show What Buyers Actually Paid
Precedent transactions apply multiples from past acquisitions of similar companies. Because buyers gained control in those deals, the multiples include a control premium, the extra price paid above a minority stake’s value for the right to direct the business. The gap between precedent and trading multiples therefore estimates what control costs for a similar target.
The size of that premium varies by market and period. An advisory firm’s study of tender offers for companies listed on the Warsaw Stock Exchange estimated the control premium level at 17.1% for the 2020-2024 period, a regional figure that shows the order of magnitude rather than a global norm. A premium is only worth paying when the buyer’s synergies cover it.
Leveraged Buyout Analysis Shows What a Financial Buyer Can Afford
A leveraged buyout (LBO) is an acquisition funded mainly with borrowed money, and LBO analysis works backward from a required return to the highest price a financial buyer can pay. The analyst sets a target internal rate of return (IRR), the annual return on the equity invested, forecasts the cash available to repay debt, estimates an exit value in year five, and solves for the entry price.
The result is an ability-to-pay ceiling, which tests whether a price clears a lender’s limits and an investor’s return hurdle. Templates are listed under the LBO tag at eFinancialModels.
Asset-Based Value Sets the Floor
Asset-based valuation takes the fair value of assets minus the fair value of all liabilities, debt included, to reach net asset value. Damodaran describes these approaches as ways to estimate what the assets owned by a firm are worth currently. For a profitable service company it usually sits far below the other methods, which makes it a floor rather than a price.
Synergies Decide How Much Premium a Buyer Can Justify
Synergies are the extra cash the combined business earns beyond the sum of the two separate businesses. Damodaran’s paper on the value of synergy notes that both cost and growth synergies manifest themselves as higher expected cash flows in the future.
The seller will argue for the whole amount, yet Boston Consulting Group writes that acquirers cannot expect to capture 100 percent of those synergies for themselves. Two numbers frame the negotiation. The walk-away price is stand-alone value plus net synergies, the price at which the buyer keeps nothing. The acquisition premium is the offer’s percentage above stand-alone value, and it equals the share of net synergies paid to the seller divided by stand-alone value. Models for these steps are collected under the valuation tag at eFinancialModels.
Worked Example: One Hypothetical Target Through the Methods
In this example, a hypothetical private target earns 10.0 of EBITDA. All figures are assumptions in USD million.
| Method | Key assumptions | Low | Midpoint | High |
|---|---|---|---|---|
| Asset-based | Assumed net asset value | 50.0 | 55.0 | 60.0 |
| Trading comparables | 8.0x EBITDA, range of 10% either way | 72.0 | 80.0 | 88.0 |
| Precedent transactions | 9.0x EBITDA, range of 10% either way | 81.0 | 90.0 | 99.0 |
| DCF | 10% WACC, 2% growth, range from 11% to 9% WACC | 79.3 | 89.5 | 102.7 |
The DCF uses free cash flow of 6.0, 6.5, 7.0, 7.5 and 8.0 over five years. The present values of the five cash flows sum to 26.2. The terminal value is 8.0 x 1.02 / (0.10 – 0.02) = 102.0, which discounts to 63.3, so EV is 26.2 + 63.3 = 89.5.
Trading comparables give 8.0 x 10.0 = 80.0. Precedent transactions give 9.0 x 10.0 = 90.0, an implied control premium of 12.5% over the trading value (90.0 / 80.0 – 1). The buyer treats 90.0 as stand-alone value on a control basis, and the DCF midpoint of 89.5 supports it. The asset-based value of 55.0 marks the floor, and the LBO method needs debt terms this example does not assume.
A football-field chart, a bar chart of the valuation range from each method, shows the result.
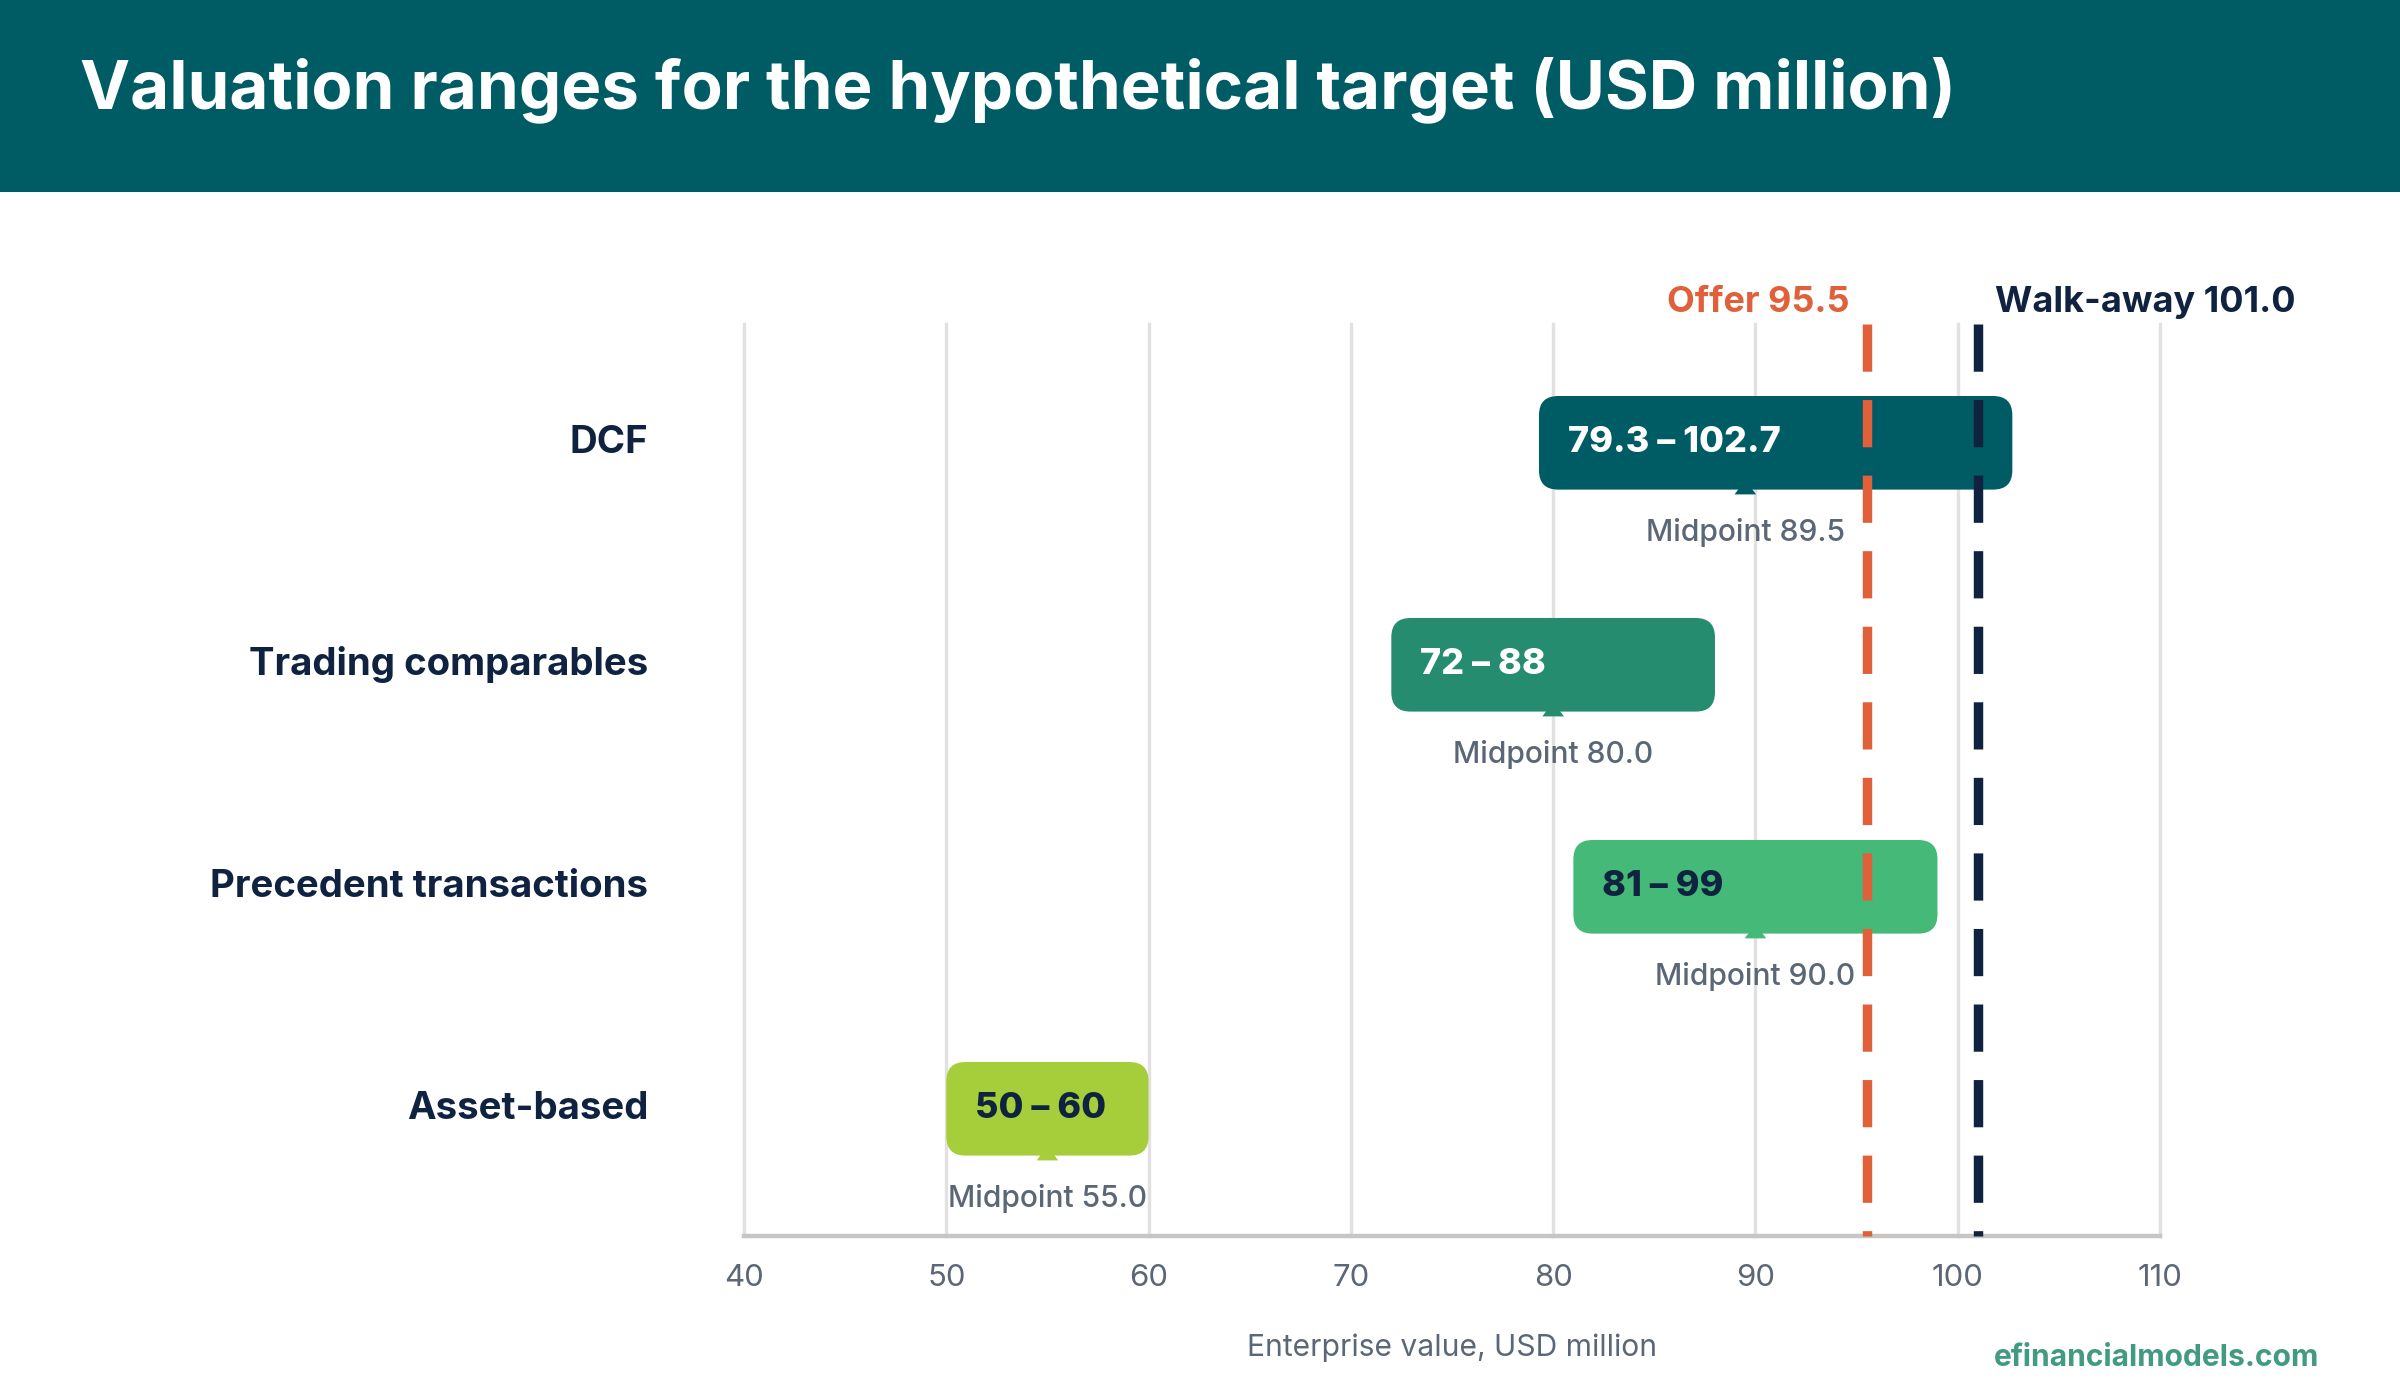
The offer lies within the precedent and DCF ranges and below the walk-away line.
Cost synergies are 2.0 a year before tax, or 1.5 after a 25% tax rate. Capitalized at the same 10% rate with no growth, they are worth 1.5 / 0.10 = 15.0. One-time integration costs of 4.0, assumed after tax and paid at closing, reduce this to net synergies of 11.0, so the walk-away price is 90.0 + 11.0 = 101.0. If the buyer shares 50% of net synergies, the offer is 90.0 + 0.5 x 11.0 = 95.5, an acquisition premium of 95.5 / 90.0 – 1 = 6.1% over stand-alone value. This premium is measured on the control-basis value, so it is separate from the 12.5% control premium already inside the precedent multiples. Because precedent multiples can include synergies that earlier buyers shared with sellers, a buyer should confirm that its own synergies are not counted twice.
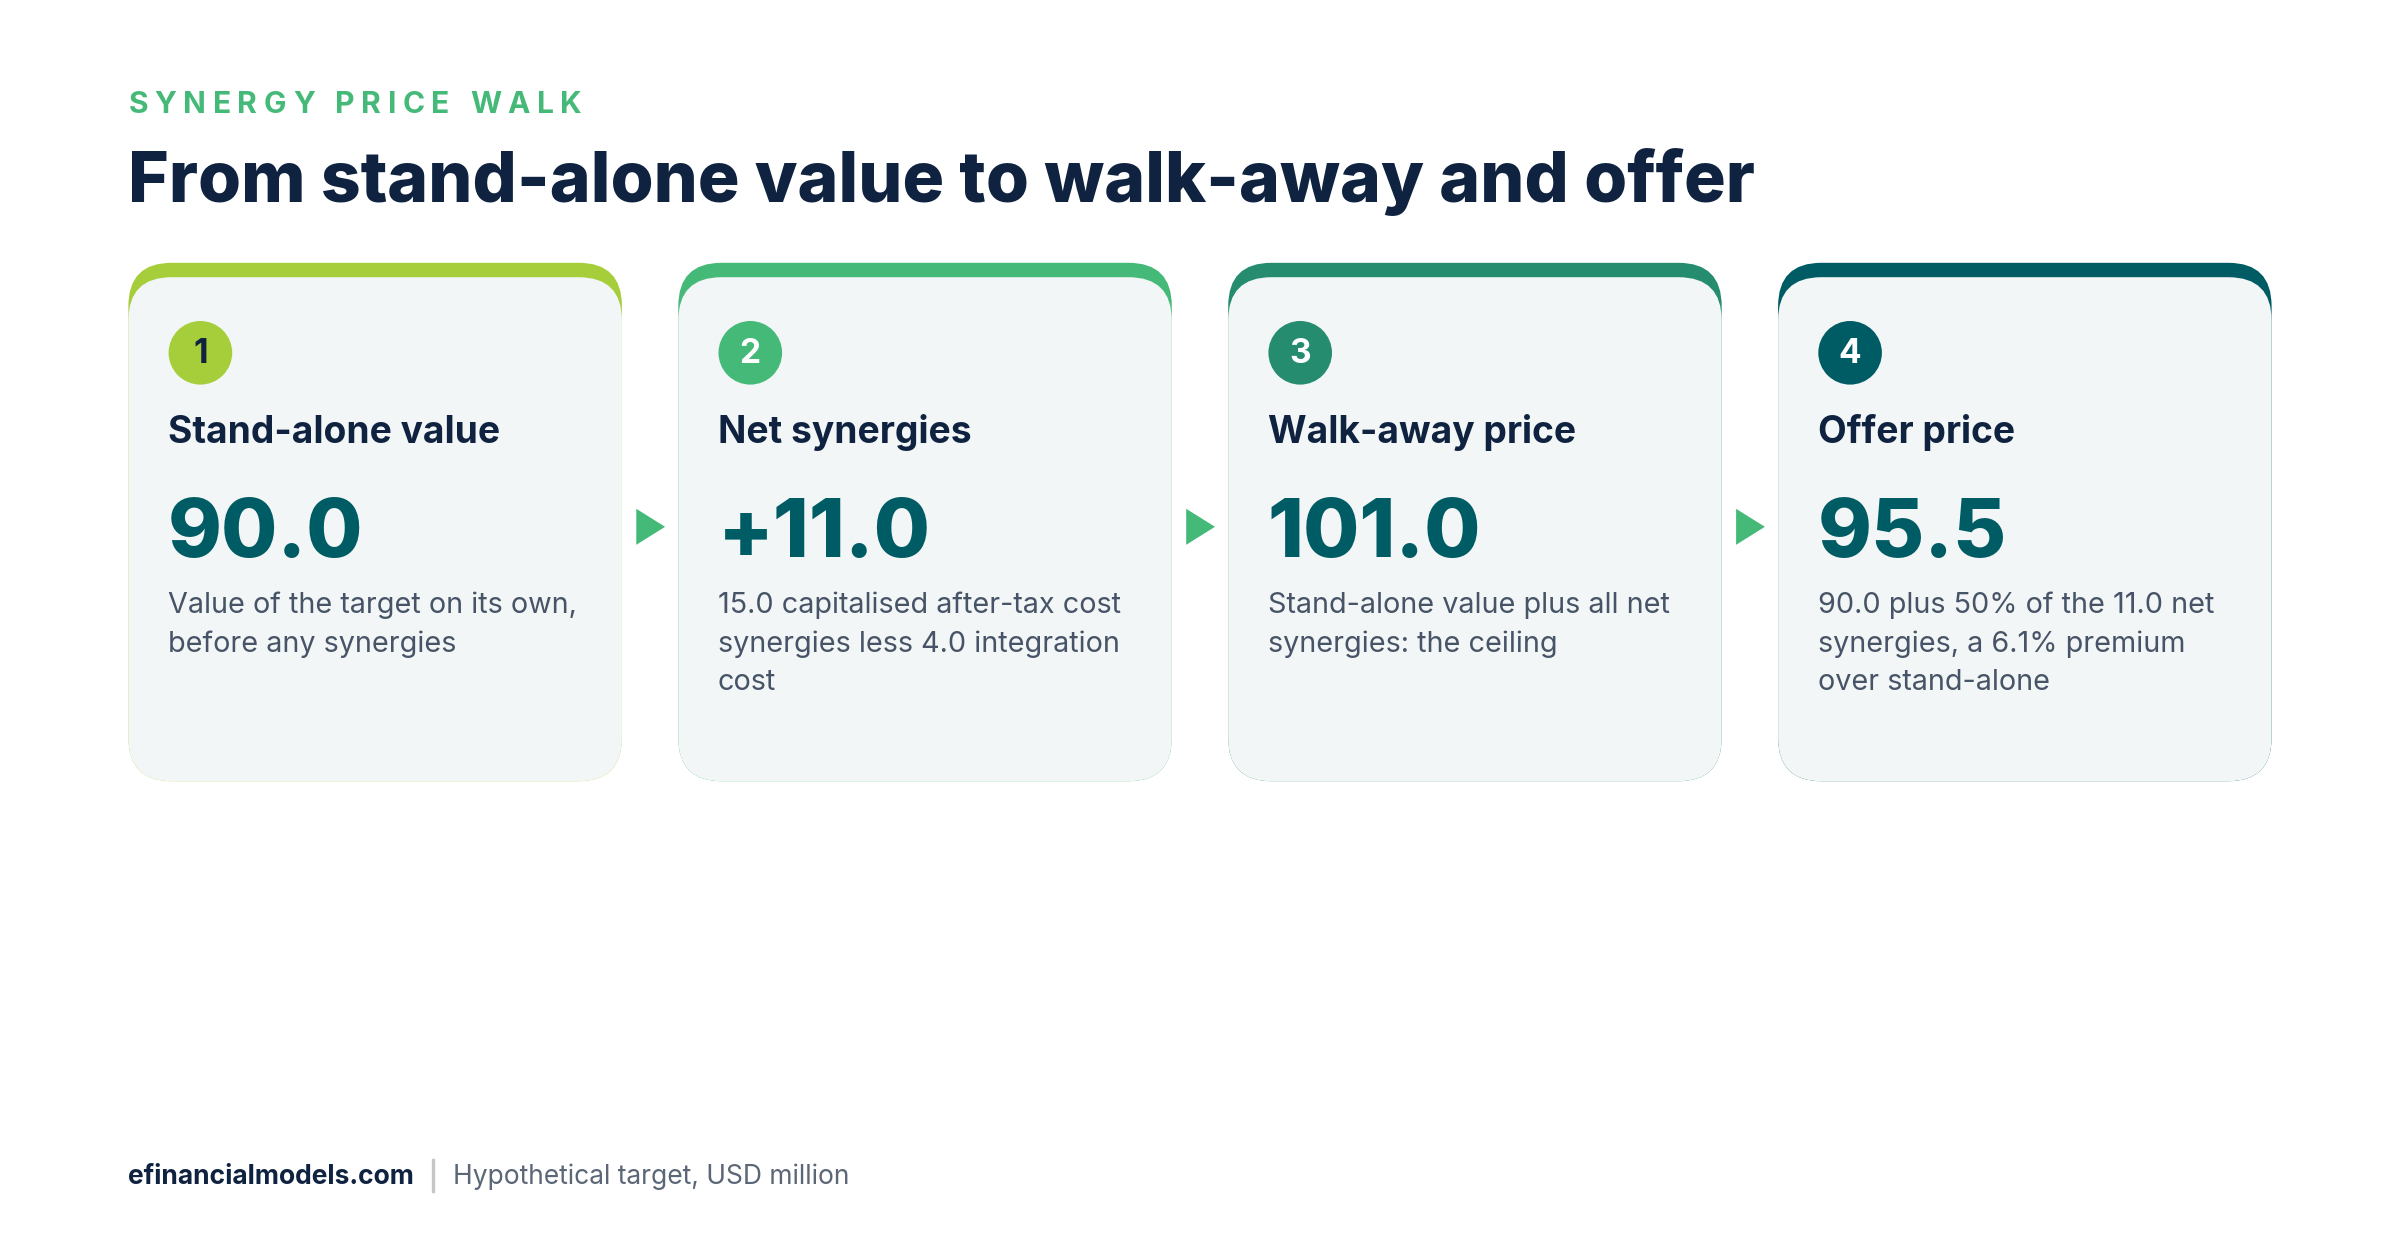
The buyer shares half of the net synergies with the seller and keeps the rest.
Conclusion
A buyer values a target by building the five results into one range, fixing stand-alone value on a control basis, and setting the walk-away price before negotiating. In the example, the offer of 95.5 sits below the walk-away price of 101.0. Buyers who want to build the same comparison in a spreadsheet can use the Mergers and Acquisitions (M&A) Financial Model from eFinancialModels, which values each entity with discounted free cash flow and EV/EBITDA multiples and quantifies potential synergies.
Frequently Asked Questions
Which valuation method should a first-time buyer trust most?
No single method deserves most of the trust, but small private targets usually lean on earnings multiples with a cash flow cross-check, because asset values understate profitable service firms and few deals have public prices. A first-time buyer should ask a broker or accountant for multiples from recent sales of similar businesses, then test that number against the target’s own cash generation.
How is a control premium different from an acquisition premium?
A control premium is the extra value attached to directing a business, and it shows up in market data as the gap between what acquirers paid and where minority shares traded. An acquisition premium is the buyer’s own decision about how far to bid above stand-alone value. The first is market evidence, while the second is a negotiating outcome that should never exceed the net synergies the buyer can deliver.
What discount rate should a buyer use for a private target?
Start from the return that lenders and shareholders would demand for a company of similar size and risk, then add an adjustment when the business is small, depends on a few customers, or relies heavily on its founder. A rate that is too low inflates value and invites overpaying, so a buyer should show the result at several rates and favor the higher end when forecasts are unproven.
When should a buyer walk away from a deal?
A buyer walks away when the seller’s price exceeds the walk-away figure or when diligence lowers the forecasts that justified it. Setting the ceiling in writing before the first meeting helps, because competitive tension and sunk advisory costs push bidders upward. Findings on customer concentration, unpaid taxes or declining margins should each trigger a recalculation, and the revised ceiling should hold even when it ends the talks.
How do debt and cash change the final price?
Enterprise value is not the check written to the seller. Net debt, unpaid taxes, leases and underfunded pensions reduce what the owners receive, while surplus cash adds to it. Contracts usually fix a target level of working capital, the cash tied up in receivables, inventory and payables, and a shortfall at closing reduces the price. The buyer should list these items during diligence so that the headline multiple converts correctly into an equity price.